Article Text

Abstract
Some ethnic minorities with type 1 diabetes (T1D) have worse glycemic control (higher glycated hemoglobin (HbA1c)) and increased risk for vascular complications. There is limited evidence on the impact of ethnicity on early glycemic control when most patients experience transient remission postdiagnosis. We examined associations between ethnicity and longitudinal HbA1c trajectories during the first 6 months postdiagnosis in a multiethnic cohort in East London.
Research design and methods Data on 443 (50% female) children <19 years of age, with T1D and attending one of three clinics in East London between January 2005 and December 2015 were included. Linear mixed-effects modeling was used to assess ethnic differences in longitudinal HbA1c trajectories during the first 6 months postdiagnosis (1,028 HbA1c data points), adjusting for sex, age at diagnosis, socioeconomic status and pH at diagnosis. Growth curve modeling was used to plot discrete HbA1c trajectories by ethnicity.
Results Longitudinal modeling revealed that all ethnic minorities had higher mean HbA1c at diagnosis compared with White children and highest in Bangladeshi (9.7 mmol/mol, 95% CI 5.1 to 14.3), Asian-Other (5.8 mmol/mol, 95% CI 2.2 to 9.3) and Somali (5.2 mmol/mol, 95% CI 0.1 to 10.2) children, and these differences persisted over the 6-month period after diagnosis. During the first month, HbA1c decreased on average by 19.6 mmol/mol (95% CI −21 to −18) for all children. Population averaged HbA1c decreased between diagnosis and 4 months, followed by a gradual increase in HbA1c levels (mean difference of −30 mmol/mol between diagnosis and 6 months).
Conclusions Ethnic minorities present with higher HbA1c at diagnosis, with the largest mean differences observed in Bangladeshi, Asian-Other and Somali children. These higher levels (indicating poorer glycemic control) track into the first 6 months postdiagnosis.
- diabetes mellitus
- type 1
- ethnicity
- glycaemic control
- HbA1c
- inequalities
- United Kingdom
This is an Open Access article distributed in accordance with the Creative Commons Attribution Non Commercial (CC BY-NC 4.0) license, which permits others to distribute, remix, adapt, build upon this work non-commercially, and license their derivative works on different terms, provided the original work is properly cited and the use is non-commercial. See: http://creativecommons.org/licenses/by-nc/4.0/
Statistics from Altmetric.com
Significance of this study
What is already known about this subject?
Ethnic minority children are at greater risk for poorer glycemic control. Almost all patients with type 1 diabetes go through a period of transient remission immediately after diagnosis when the need for exogenous insulin declines.
What are the new findings?
All ethnic minorities had significantly higher glycated hemoglobin (HbA1c) at diagnosis compared with White children, and differences were reported for the first time in Bangladeshi and Somali children resident in the UK. The ethnic differences in glycemic control persisted during the period of transient remission and up to 6 months postdiagnosis.
How might these results change the focus of research or clinical practice?
Interventions early on, at the time of diagnosis and during the first few months are needed to reduce ethnic differences in glycemic control and are especially important as poor early glycemic control is likely to track into later life.
Introduction
Inequalities in pediatric type 1 diabetes outcomes are well recognized.1 Children and young people (CYP) of lower socioeconomic status (SES) and ethnic minorities tend to have poorer glycemic control and increased risk for acute life-threatening complications (diabetic ketoacidosis and hypoglycemia) and chronic vascular complications in later life.2–4 In a recent study using national data on >95% of CYP with type 1 diabetes in England and Wales, we found that all ethnic minorities had poorer glycemic control (higher blood glycated hemoglobin (HbA1c) concentrations) compared with White CYP.5 Lower SES was associated with poor glycemic control in all ethnic groups, but being poor and ethnic minority had significantly worse impact on glycemic control than being poor and White.
Studies show that young patients from lower SES and ethnic minority backgrounds receive a later diagnosis of type 1 diabetes and present with significantly worse symptoms at diagnosis (greater severity of diabetic ketoacidosis and higher HbA1c levels).6 7 A greater level of metabolic derangement at diagnosis may reflect factors such as poorer/late access to medical care,6 8 cultural and/or biological differences between ethnic groups and also a lower level of residual pancreatic beta cell function.9 There have been reports on associations between clinical presentation at diagnosis and subsequent early glycemic control.10 Therefore, if ethnic minorities present with worse clinical factors at diagnosis, one could hypothesize that the stabilization of glycemic control during the period of transient remission (‘honeymoon phase’) experienced by most newly diagnosed patients with type 1 diabetes could also differ by ethnic background.11 However, this has not been comprehensively investigated in a multiethnic population in the UK. This is especially important to study as early glycemic control during the first year postdiagnosis is linked to subsequent future control which may track into adulthood.12
To identify groups of CYP with poor glycemic control based on clinical factors at presentation, we investigated ethnic differences in stabilization of glycemic control during the first 6 months postdiagnosis in a multiethnic population attending diabetes clinics in East London. We also analyzed ethnic differences in ketoacidosis severity at diagnosis (pH levels) and if this affected subsequent glycemic control during the first 6 months. Identification of patients with initial and subsequent poor glycemic control could help in devising targeted policies to help these CYP have better outcomes in the future.
Methods
Design, setting and data source
We undertook a longitudinal cohort study of newly diagnosed patients with type 1 diabetes using data from three pediatric diabetes clinics that are part of the same Healthcare Trust (Barts Health NHS Trust) located in East London, UK. The three clinics largely capture patients living in surrounding areas of East London, where up to 56% of the local population belongs to an ethnic minority, with around 50% of South Asian origin (primarily of Bangladeshi origin) and 40% of Black origin (primarily of Somali origin).
The study was restricted to children <19 years of age who received a diagnosis of type 1 diabetes between 1 January 2005 and 31 December 2015 and attended any one of the three clinics during the same period. Extensive clinical and sociodemographic data were collected prospectively, both at the time of diagnosis and during routine clinic visits. As per recommendations from the National Institute of Health and Care Excellence (NICE), a child with type 1 diabetes is offered an integrated package of care by a multidisciplinary team at a pediatric diabetes clinic four times per year. The team consists of pediatric endocrinologists/diabetologists, diabetes specialist nurses, dieticians, psychologists and interpreters. HbA1c levels are recorded at each visit. All demographical and clinical parameters are systematically measured and electronically documented across all three clinics enabling comparison. Out of 596 children diagnosed with type 1 diabetes during the study period, 571 (96%) children had data on sex, age at diagnosis, duration of diabetes, ethnicity and SES and were eligible to be included in the analysis.
Primary outcome, exposures and covariates
The outcome of interest was glycemic control measured by HbA1c levels. HbA1c was measured at each visit using the point of care Siemens/Bayer DCA 2000+ Analyzer. HbA1c values recorded as percentages were converted to mmol/mol using the formula: (HbA1c value in %−2.15)×10.929.
The main exposures of interest were ethnicity and SES. Participants (or their parents) were asked to self-identify their ethnicity when they visited a clinic and we used the first recorded entries for ethnicity at the time of diagnosis. They were given the option to choose 1 of 15 categories or the option to decline identifying their ethnicity. For this study, the 15 ethnic categories were collapsed into six broad groups: White, mixed ethnicity (any mixed ethnicity combination), Black, African-Somali, Bangladeshi and Asian-Other (any Asian origin excluding Bangladeshi) which reflects the ethnic distribution of the study area in East London. The latter group included CYP mostly of Indian or Pakistani origin and a much smaller proportion originating from other Asian countries. The pH value (blood capillary samples) measured closest to initial presentation was used in the analysis.
SES was derived from postcode of residence using indices of multiple deprivation (IMD) 2010 for England. The IMD is a small geographical area measure of deprivation. It is multidimensional and scores are derived from a weighted combination of several indicators across seven distinct measures of deprivation including: income, employment, education skills and training, health, barriers to housing and services, living environment and crime.13 It captures the ‘relative’ deprivation experienced by an individual living in an area. IMD scores are calculated at the level of lower-layer super output areas, with each area comprising 1500 individuals on average. IMD rank scores were grouped into quartiles for the analysis, with the first and fourth quartiles corresponding to the most and least deprived, respectively.
Other covariates adjusted for in the analysis include: sex, age at diagnosis calculated by subtracting date of diagnosis from date of birth, age at clinic visit calculated by subtracting date of clinic visit from date of birth, duration of diabetes calculated in months by subtracting the date at first visit in the audit year from the date of diagnosis of type 1 diabetes, which of the three Pediatric Diabetes clinics the child attended and pH levels recorded at diagnosis—used as an indicator of diabetic ketoacidosis severity at presentation, measured in a subgroup of patients.
Statistical analysis
Baseline characteristics were compared across all ethnic groups. Categorical variables were compared as frequencies using χ2 or Fisher's Exact test. Mean differences in baseline continuous variables by ethnicity were analyzed using simple linear regression.
Stabilization of glycemic control during the first 6 months postdiagnosis was assessed using linear mixed-effects models (ie, a random intercept and random slope model), which allow comparison of population average HbA1c levels and change over time for the different ethnic categories while controlling for potential covariates. We approximated time trends using a quadratic model for time since diagnosis as this provided a better statistical fit than a linear model. Ethnicity, SES, age at diagnosis, sex and diabetes clinic were entered as time-invariant predictors. We constructed a series of models using the ‘mixed’ commands in Stata V.14 (StataCorp, College Station, Texas, USA). The first model (Model 1) was an unadjusted growth model using the quadratic function of time since diagnosis (disease duration in months) as the time metameter. Subsequent models were additionally adjusted for our hypothesized predictors: sex and age at diagnosis in years (Model 2), ethnicity (Model 3), SES (Model 4) and which of the three diabetes clinic the child attended (Model 5). We tested for a potential interaction between ethnicity and duration to assess whether HbA1c trajectories differed by ethnic group. We estimated all model parameters by maximum likelihood. We used generalized likelihood ratio statistics, −2 log-likelihood (−2LL), Aikake information criterion (AIC) and sample-adjusted Bayesian information criterion (BIC) to compare model fit between subsequent nested models and Wald statistics to test hypotheses about model parameters. We plotted quadratic growth curves at the group level (ie, ethnicity) to visualize model fit. Analyses were run in Stata V.14. In addition, we ran Models 3 and 5 above in a subgroup of patients with data on pH levels at diagnosis to assess any change to the observed ethnicity–HbA1c associations.
Results
Of the 571 subjects eligible to be included, 89 were excluded as they did not have any recorded data during the first 6 months postdiagnosis. Additionally, 39 had missing data on HbA1c during the first 6 months postdiagnosis leaving 443 (78% of the eligible population) children with 1,028 measurements of HbA1c during the first 6 months, and data on all covariates who were included in the analysis. The mean number of HbA1c measurements per child during the first 6 months was 2.3 (range 1–7). Forty-one per cent presented with diabetic ketoacidosis at diagnosis (defined as pH levels <7.3, table 1).
Characteristics of the study population (n=443) diagnosed with type 1 diabetes between 1 January 2005 and 31 December 2015. Values are means (SD) or proportions
Characteristics of the study population at baseline and 6 months postdiagnosis
Fifty per cent of the study population were female. Mean HbA1c (ie, the mean of all HbA1c measurements in the first month postdiagnosis) at diagnosis was 93.7 mmol/mol (table 1). All ethnic groups had relatively high HbA1c levels at diagnosis with the highest mean levels observed in Bangladeshi children (99.9 mmol/mol (SD 24.1), table 1). Mean deprivation score and the proportion of subjects in the lowest SES quartile (ie, the most deprived) differed significantly by ethnic group, with the African-Somali, mixed ethnicity and Black groups having the lowest mean deprivation scores and largest proportions of CYP in the most deprived SES quartile (table 1). There were no significant differences in HbA1c at diagnosis by SES quartiles. We observed no significant differences in gender, age at diagnosis and pH levels by ethnicity. HbA1c decreased by an average of 32.4 mmol/mol during the first 6 months postdiagnosis.
Longitudinal modeling of HbA1c trajectories
Table 2 shows the regression parameters from longitudinal modeling. We detected a significant difference in HbA1c when comparing ethnic minority children to White children. All ethnic minority groups had higher mean HbA1c levels at diagnosis compared with the White group. However, differences were statistically significant only in the Bangladeshi (8.8 mmol/mol, 95% CI 4.3 to 13.3) and Asian-other (5.8 mmol/mol, 95% CI 2.3 to 9.4, table 2) groups which exhibited the largest mean differences in HbA1c levels at diagnosis compared with White children. Adjustment for SES slightly enlarged the estimates for all ethnic groups, and the estimate for the African-Somali group reached statistical significance (5.1 mmol/mol, 95% CI 0.1 to 10.1, table 2). However, SES, age at diagnosis and gender were not significantly associated with HbA1c levels at diagnosis. We also observed a significant difference in mean HbA1c at diagnosis by diabetes clinic.
Mixed-effects models for change in glycaemic control (HbA1c) during the first 6 months postdiagnosis in children with type 1 diabetes and attending paediatric diabetes clinics in East London
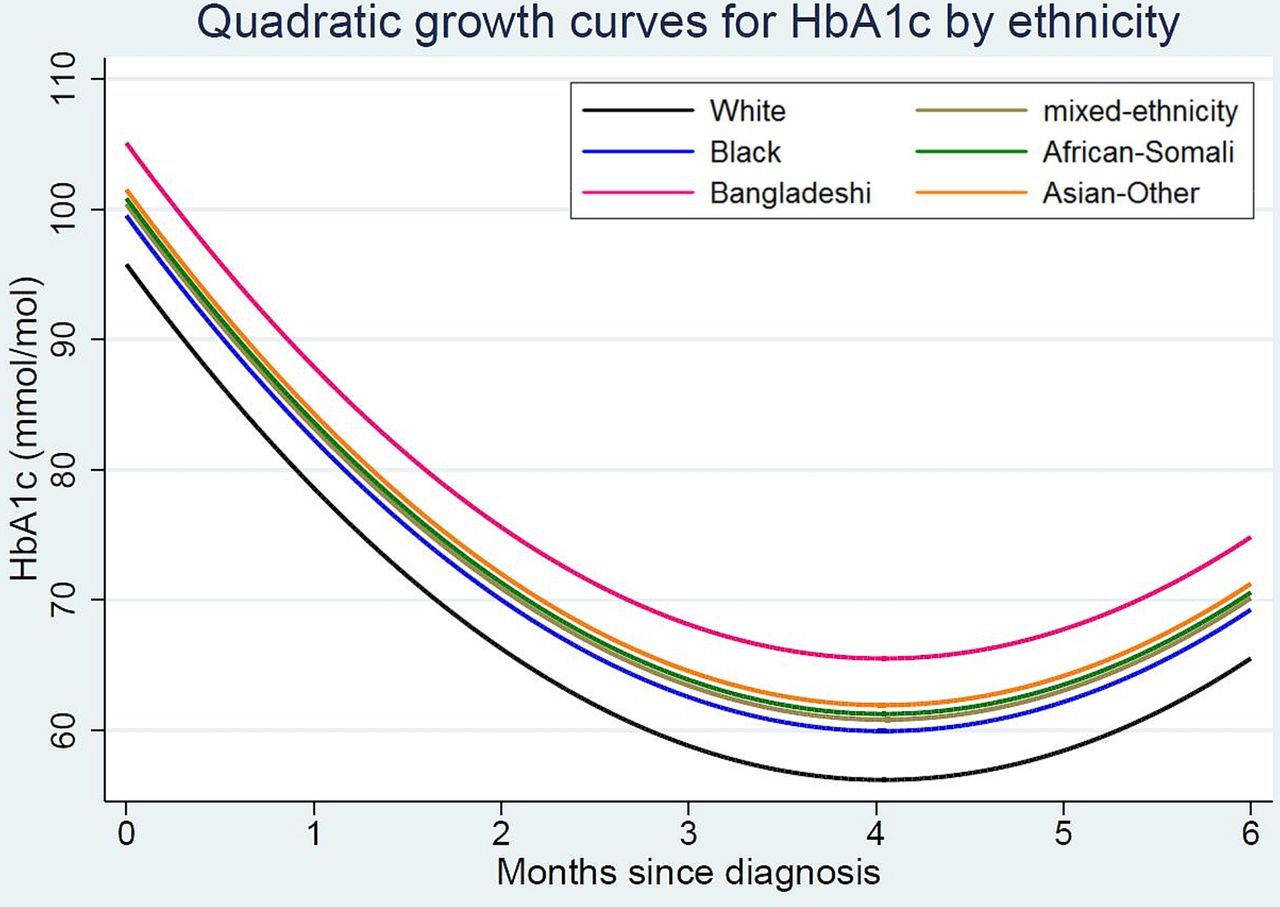
All ethnic groups experienced an initial decrease in HbA1c levels during the first 4 months postdiagnosis followed by a slight gradual increase between months 4 and 6, with a statistically significant quadratic term in all models (figure 1, table 2). HbA1c levels decreased by an average 19.6 mmol/mol during the first month after diagnosis for the entire group. Likelihood ratio tests showed that each subsequent model had a statistically better fit than the preceding model with fewer covariates. Model 5 with all covariates had the best fit (−2LL=8635 and AIC=8673, table 2). In the final Model 5 with all covariates, 76% of the variation in HbA1c was due to individual differences (intraclass coefficient (ICC)=0.76, table 2).

Predicted glycemic control (glycated hemoglobin or (HbA1c) trajectories during the first 6 months postdiagnosis by ethnicity. Trajectories are estimated for a sample group with a mean age of diagnosis=9 years and indices of multiple deprivation=quartile 3.
The model testing for an interaction between ethnicity and duration was not statistically significant, indicating no evidence of a difference by ethnicity in HbA1c trajectories over time (data not shown).
Longitudinal modeling for change in HbA1c with pH at diagnosis
Longitudinal models on HbA1c trajectories adjusted for pH at diagnosis were restricted to a smaller sample of 338 children with 764 HbA1c data points (average 2.3 HbA1c data points per subject, range 1–6) as pH at diagnosis was not documented in all cases.
All ethnic minorities had higher mean HbA1c at diagnosis compared with White children as observed in models comprising the entire study sample (n=443), described above. However, estimates for the mixed and Black groups previously not significant were observed to be statistically significantly different from the White group. pH at diagnosis was inversely associated with HbA1c at diagnosis. For every one unit increase in pH levels, HbA1c decreased by an adjusted average of −15.7 mmol/mol (95% CI −25.1 to −6.3, table 3). Adjusting for pH at diagnosis had no impact on the previously observed ethnicity–HbA1c associations (table 2).
Mixed-effects models for change in glycaemic control (HbA1c) during the first 6 months postdiagnosis adjusted for pH levels at diagnosis, in children with type 1 diabetes
Discussion
Our aim was to use longitudinal modeling to determine whether glycaemic control (HbA1c trajectories) differed by ethnicity during the first 6 months after diagnosis. As expected, we observed a general and rapid improvement in HbA1c levels for the entire study sample that reached a nadir around 4 months postdiagnosis. This was followed by a slight gradual increase in HbA1c levels between 4 and 6 months postdiagnosis. We found that all ethnic minority children presented with poorer HbA1c at diagnosis compared with White children and the magnitude of this difference did not change over the study period—the children that started behind remained behind in terms of glycemic control. An additional aim was to assess the effect of pH (a marker of disease severity at diagnosis) on glycemic control during the first 6 months after diagnosis. We found that while pH at diagnosis was negatively associated with HbA1c during the first month postdiagnosis, it did not affect the subsequent observed ethnicity–HbA1c trajectories.
Comparisons with the literature
Few studies and none from the UK have investigated early glycemic control (control during the first year after diagnosis) using longitudinal data from diagnosis onwards. Most did not investigate the impact of ethnicity on early glycemic control, did not use advanced methods to analyze longitudinal data (such as mixed effects models) or had longer follow-up periods without focusing on the transient remission (‘honeymoon phase’) period as in this study. Our finding of initial very high HbA1c levels at diagnosis, followed by a steep decline, is reported in other studies with comparable study populations (age at diagnosis and proportion of female subjects). However, those studies that reported HbA1c levels at diagnosis and during the first year postdiagnosis (including data points at 6 months postdiagnosis) did not investigate trends in glycemic control and were restricted to study populations of White ethnicity limiting comparisons.10 14–16 Chase et al found a steep decline in HbA1c levels at 2–4 months followed by a gradual increase similar to our findings.17 Studies that analyzed data using longitudinal modeling with a focus on ethnic differences in metabolic control had a much longer follow-up and thus did not report exclusively on the first 6 months postdiagnosis when most patients undergo transient remission.18 19 Initial high HbA1c levels at diagnosis and lower levels at 6 months reported elsewhere are similar to that observed in our study.
There have been conflicting reports on the association of age at diagnosis and gender with HbA1c levels at diagnosis and during follow-up. Some studies report that females and older children have higher HbA1c levels at diagnosis and during follow-up, whereas others show an interaction between gender and age at diagnosis on subsequent HbA1c levels during the first year postdiagnosis.14 16 19 We observed no association between gender and age at diagnosis with initial and subsequent HbA1c levels.
Strengths and limitations
Our methods allowed for the inclusion of a large number of longitudinal data points. The study sample was drawn from East London where the majority (67%) belonged to an ethnic minority. This enabled us to study for the first time, pediatric glycemic control in specific ethnic minority groups such as the Bangladeshi and Somali groups. Such vulnerable groups often get overlooked as they are analyzed in combination with other ethnic groups masking potential underlying differences. Ethnicity was self-identified which is considered to be the ‘gold standard’ in studies on ethnicity and health.20
Our study also has certain limitations. The study sample was drawn from three pediatric diabetes clinics which operate together as a network since 2012 and results may not be generalizable to the rest of the country. One cannot exclude the possibility of residual confounding due to other factors known to impact on glycemic control at diagnosis and during early follow-up which may interact with ethnicity including family structure, family history of diabetes, pubertal status and incidence of severe hypoglycemia and diabetic ketoacidosis. Our finding of no association between SES and metabolic control at diagnosis was unexpected. This could be explained by the fact that a significant proportion of the study sample was highly deprived (reflecting the neighborhood from which the sample was drawn) leading to low variability in SES. Black and mixed ethnic children have increased risk for poorer metabolic control.5 However, the statistically non-significant estimates for both groups could be due to low statistical power. We were unable to calculate the proportion of subjects undergoing remission at different time points by known methods as we lacked the information needed (insulin dose-adjusted HbA1c or total daily insulin dose/kg body weight/day). Insulin pump therapy is known to substantially improve glycemic control, but we were unable to control for treatment type as it was missing for a significant proportion of subjects.21 However, we are aware that only a smaller proportion of subjects attending these three clinics were on insulin pump therapy which was introduced towards to second half of the study period (verbal communication) and we do not expect adjustment for treatment type to change our observed results. We plan to analyze the role of treatment type in future studies on this cohort.
Several factors may explain the observed ethnic differences in metabolic control at diagnosis and during early follow-up including physiological (greater loss of insulin-producing beta cells in some ethnic groups and greater disease severity at diagnosis) and psychosocial (later presentation at diagnosis, attitudes towards understanding disease symptoms and seeking care at later stages) factors. Studies indicate that younger children often present with greater acidosis, experience a more rapid loss of insulin-producing beta cells and worse symptoms at diagnosis.13 However, we found no differences in age at diagnosis by ethnicity that could explain the observed differences in HbA1c at diagnosis.
Our outcomes are timely, given the long-term data from the Diabetes Control and Complications Trial/Epidemiology of Diabetes Interventions and Complications (DCCT/EDIC) recently reported by Orchard and colleagues.22 During 30 years of follow-up, fewer cardiovascular disease events occurred in the former intensive treatment group subjects compared with the former conventional treatment group subjects. The lower HbA1c levels during the DCCT/EDIC, achieved through intensive insulin therapy, statistically account for all of the observed treatment effect on cardiovascular disease risk. While similar long-term data are required for childhood-onset type 1 diabetes, the DCCT/EDIC outcomes indicate that achieving very early target HbA1c has important benefits in later life. The mechanisms for the ethnic differences observed in our study require further investigation.
Conclusions
Ethnic minority children with type 1 diabetes presented with higher mean HbA1c levels at diagnosis compared with White children. These differences in HbA1c by ethnicity were sustained throughout the study period including the ‘honeymoon’ phase when all groups experienced a steep decline in HbA1c levels. Our study highlights the importance for formulating interventions early on, at the time of diagnosis and during the first few months to ensure that differences in glycemic control are reduced. This is especially important as people with poor early glycemic control are more likely to have poor control later in life.
Acknowledgments
This study and the Policy Research Unit in the Health of Children, Young People and Families (CPRU, GOS Institute of Child Health, UCL) is funded by the Department of Health Policy Research Program. This is an independent report commissioned and funded by the Department of Health. The views expressed are not necessarily those of the Department.
We thank members of the Policy Research Unit for the health of children, young people and families: Catherine Law, Amanda Edwards, Ruth Gilbert, Steve Morris, Helen Roberts, Cathy Street and Miranda Wolpert.
We would also like to acknowledge the diabetes teams of Barts Health NHS Trust and especially Dr Claire Hughes (Royal London Hospital), Dr Abdul Moodambail (Newham University Hospital) and Dr Paramita Cifelli (Whipps Cross Hospital) for approving the study and facilitating access to data.
Acknowledgments
None
References
Footnotes
Contributors AK and RA conceived the research question. AK researched the data. AK wrote the manuscript with contributions from RA, DTR, RMV, JW, EFG and TR. All authors read and approved the final version of the manuscript. All authors were involved in developing the research idea and analysing the results.
Funding This work was supported by the Children's Policy Research Unit (CPRU), UCL (funding reference 10090001), which is funded by the Department of Health Policy Research Programme and supported by the National Institute for Health Research Biomedical Research Centre at Great Ormond Street Hospital for Children NHS Foundation Trust and University College London.
Competing interests None declared.
Provenance and peer review Not commissioned; externally peer reviewed.
Data sharing statement No additional data available.