Article Text

Abstract
Objective The aim of this study was to examine the impact of pre-existing malnutrition on survival and economic implications in elderly patients with diabetes.
Research design and methods A retrospective observational study was conducted to examine the impact of malnutrition with or without other significant health conditions on survival time and healthcare costs using the Centers for Medicare and Medicaid Services (CMS) data from 1999 to 2014 for beneficiaries with a confirmed first date of initial diagnosis of diabetes (n=15 121 131). The primary outcome was survival time, which was analyzed using all available data and after propensity score matching. Healthcare utilization cost was a secondary outcome.
Results A total of 801 272 beneficiaries were diagnosed with malnutrition. The analysis on propensity score-matched data for the effect of common conditions on survival showed that the risk for death in beneficiaries with diabetes increased by 69% in malnourished versus normo-nourished (HR, 1.69; 99.9% CI 1.64 to 1.75; P<0.0001) beneficiaries. Malnutrition increased the risk for death within each of the common comorbid conditions including ischemic heart disease (1.63; 1.58 to 1.68), chronic obstructive pulmonary disorder (1.60; 1.55 to 1.65), stroke or transient ischemic attack (1.57; 1.53 to 1.62), heart failure (1.54; 1.50 to 1.59), chronic kidney disease (1.50; 1.46 to 1.55), and acute myocardial infarction (1.47; 1.43 to 1.52). In addition, the annual total spending for the malnourished beneficiaries was significantly greater than that for the normo-nourished beneficiaries ($36 079 vs 20 787; P<0.0001).
Conclusions Malnutrition is a significant comorbidity affecting survival and healthcare costs in CMS beneficiaries with diabetes. Evidence-based clinical decision pathways need to be developed and implemented for appropriate screening, assessment, diagnosis and treatment of malnourished patients, and to prevent malnutrition in normo-nourished patients with diabetes.
- retrospective study
- malnutrition
- mortality
- health care utilization
This is an Open Access article distributed in accordance with the Creative Commons Attribution Non Commercial (CC BY-NC 4.0) license, which permits others to distribute, remix, adapt, build upon this work non-commercially, and license their derivative works on different terms, provided the original work is properly cited and the use is non-commercial. See: http://creativecommons.org/licenses/by-nc/4.0/
Statistics from Altmetric.com
Significance of this study
What is already known about this subject?
Malnutrition increases morbidity, but in diabetes is not studied due to the prevailing obesity or overweight conditions.
What are the new findings?
This retrospective study using the Centers for Medicare and Medicaid Services data shows malnutrition in beneficiaries with diabetes worsens survival and increases healthcare costs.
How might these results change the focus of research or clinical practice?
This study underlies the importance of concentrated efforts in identification and treatment of malnutrition in patients with diabetes.
Introduction
Diabetes is a debilitating disease of epidemic proportions, both domestically and globally. According to the WHO,1 the prevalence of diabetes in adults increased from 4.7% in 1980 to 8.5% in 2014 worldwide. In the USA alone, the prevalence of diabetes (diagnosed and undiagnosed) was 25.9% in 2012.2 Diabetes exerts a substantial clinical and economic burden in the USA, with an estimated cost of $245 billion in 2012 due to an increased use of healthcare and reduced productivity.3 The prevalence of diabetes among adults aged 65 years or older is more than 25%, with this rate being projected to double by 2050, in part due to the aging of the overall population in the USA.4 Patients in this age group have considerable risks for amputation, myocardial infarction, end-stage renal disease, and other diabetes-related complications.5
Malnutrition is also a common, but frequently under-recognized, health concern in older adults.6 Depending on the screening and assessment methods used, malnutrition is present in 5%–30% of community-dwelling older adults.6 Although the term ‘malnutrition’ is most often associated with undernutrition, it can also result from overnutrition, specific nutrient deficiencies, increased dietary requirements, or poor nutrient absorption, or increased nutrient losses due to certain diseases.7 Malnutrition is often used as a general term that encompasses cachexia, sarcopenia, and inadequate nutrient intake.7 Acute or chronic diseases and treatment interventions may also lead to the aggravation of malnutrition, especially undernutrition, due to changes in metabolism.8 This disease-related malnutrition complicates treatment plans and negatively impacts patient outcomes such as recovery time, risk for complications, and readmission rates, which exert a greater pressure on health services.9 10 Hence, there is a growing recognition of the importance of malnutrition on health-related and economic outcomes.11 12
Several factors, including diagnosis of diabetes and older age (>65 years), have been shown to be associated with an increased risk for malnutrition.13 Unfortunately, malnutrition in older adults is poorly understood and most likely underdiagnosed, especially in those who are overweight or obese. By using the data from 2011 to 2014, the National Center for Health Statistics reported that 37% of the adults were aged 60 years and older and also obese.14 The risk for malnutrition increases with age and number of comorbidities6; however, the precise estimates among those with diabetes are unknown. One multicenter observational study of hospitalized, elderly patients with diabetes reported that 39% of the patients had risks for malnutrition and an additional 21% had malnutrition, and both were unrelated to body mass index (BMI).15 Malnutrition in geriatric patients, especially those with diabetes, leads to impaired muscle function and wound healing, decreased bone mass, immune dysfunction, and general functional decline.13
The current evidence indicates that there is a large population of patients with both malnutrition and diabetes who would be expected to have worse outcomes and higher healthcare costs than those with diabetes alone; however, these relationships need to be clarified. Therefore, the purpose of this large retrospective study is to examine the impact of pre-existing malnutrition on survival and economic implications in elderly patients with diabetes by using propensity score-matched cohorts of Medicare beneficiaries.
Research design and methods
Data source
A retrospective observational study was designed to examine the impact of malnutrition and chronic conditions on survival by using the Centers for Medicare and Medicaid Services (CMS) claims database. Medicare is the national health insurance program in the USA for people aged 65 years or older, certain younger people with disabilities, and people with end-stage renal disease.16 The CMS hosts a warehouse of 27 chronic conditions for researchers to facilitate investigations to improve quality of care and reduce costs and utilization. The Chronic Conditions Data Warehouse definition of the first date of diagnosis was used, for seven selected chronic conditions, namely acute myocardial infarction (AMI), chronic kidney disease (CKD), chronic obstructive pulmonary disease (COPD), heart failure (HF), ischemic heart disease (IHD), lung cancer, and stroke or transient ischemic attack (TIA).17 These seven chronic conditions along with malnutrition have been referred to as common conditions. The authors submitted a protocol and signed a data use agreement with the CMS. On approval, the authors were granted access to Research Identifiable Files from the CMS through a secure CMS Virtual Research Data Center to conduct this analysis.
Study population
Data from January 1, 1999 to December 31, 2014 were procured for beneficiaries who had a diagnosis of diabetes (n=25 799 975). Patients were included in this analysis cohort (AC) if they had been in the database for at least 1 year without the diagnosis of diabetes. The first date of diagnosis of diabetes was defined as time zero (TZ).
This inclusion criterion resulted in an AC of 15 121 131 beneficiaries (15 121 131/25 799 975=58.61%). The AC was broadly segregated into two groups: malnourished group (MNG) and normo-nourished group (NNG). The MNG (n=801 272) consisted of beneficiaries with a diagnosis of at least one of the following International Classification of Diseases, Ninth Revision (ICD-9) codes before TZ: 260 (Kwashiorkor), 261 (nutritional marasmus), 262 (other severe, protein-calorie malnutrition), 263 (other unspecified protein-energy malnutrition), 263.0 (moderate malnutrition), 263.1 (mild malnutrition), 263.2 (arrested development following protein-calorie malnutrition), 263.8 (other protein-calorie malnutrition), 263.9 (unspecified protein-calorie malnutrition), or 783.22 (underweight) (figure 1, table 1). The transition to ICD-10 was in 2015 and thus was not used in this analysis. The NNG (n=14 319 859) consisted of beneficiaries without any of the above-mentioned ICD-9 codes before TZ.
Study cohorts

Study cohorts.
Outcomes
The primary outcome variable for this retrospective study was survival time: calculated as time from TZ to death (if death was observed) or censored at December 31, 2014 (if the survival was documented beyond this date). The secondary variables were annual healthcare utilizations, including annual total costs (Medicare parts A, B, D, and combined); annual number of acute and other inpatient, skilled nursing facility (SNF) and hospice covered days; annual number of acute and other inpatient, SNF and hospice stays; and annual number of hospital readmissions.18
Statistical analysis
Three primary analyses were performed. The first analysis evaluated the effect of common conditions on survival. All available data (AAD) for common conditions were generated as two cohorts as follows: a case cohort with the first diagnosis date of the condition before TZ and a control cohort without the diagnosis of the condition before TZ. The survival analysis of AAD and propensity score-matched samples was performed by using a Cox proportional hazard model with a robust variance estimator,19 adjusting for age, gender, ethnoracial identity, and 26 other disease conditions (indicators for having or not having the disease condition) with two exceptions: the analysis for AMI did not include IHD as a covariate and the analysis for IHD did not include AMI as a covariate (all patients having AMI at baseline also had IHD). The case and control cohorts underwent propensity score matching for each of the common conditions using a greedy matching method.20 The propensity scores were generated using the set of covariates included in the survival analysis. Propensity score matching was performed by randomly selecting 40 064 (5% of MNG) of the case group followed by propensity score matching without replacement with a five-time larger randomly selected patient population (5×40 064=200 320) from the control group. Each beneficiary in the case group was matched with a beneficiary in the control group with the closest logit propensity score within a caliper width (maximum difference) of 0.2 SD of the logit propensity score.20 In case of equal matching of more than one beneficiary, one of them was selected randomly.21 This propensity score matching approach was used for all common conditions. This approach was adopted to ensure that the resulting propensity score-matched data sets were comparable with the propensity score-generating variables,22 thus reducing or eliminating the effects of confounding factors.20 Survival of the beneficiaries in the case versus control cohorts was compared by using two-sided 0.001 level tests. The P values, HRs, and 99.9% CIs were reported for each of the constituent conditions.
The second analysis was performed to evaluate the effect of malnutrition within each common condition by using a similar approach to the first analysis, which did not include IHD as a covariate within AMI, and the analysis within IHD did not include AMI as a covariate. A similar approach to the first analysis was used for propensity score matching within all other common conditions, except for lung cancer. Within lung cancer, all malnourished beneficiaries at baseline (n=28 961) were matched with all normo-nourished beneficiaries (207 965), because the number of all malnourished beneficiaries with lung cancer at TZ was small (n<40 064).
The third analysis was performed on the annual healthcare utilizations to compare the MNG and NNG cohorts by using the propensity score-matched sample. Data were obtained from the Medicare Master Beneficiary Cost Summary – Cost and Use file from 1999 to 2014. The healthcare cost for each beneficiary in the propensity score-matched data set was derived from Medicare parts A, B, and D.23 The annual medical spending for each beneficiary was calculated from the year of TZ to the year of death or 2014. The propensity score-matched differences (MNG – NNG) were tested by using a two-sided Wilcoxon signed-rank (0.001 level) test. The P values, median values for MNG and NNG, and the difference (MNG – NNG) with 99.9% CI were reported by using only the matched pairs included in the test. The annual variables (per year), acute inpatient covered days, other inpatient covered days, SNF covered days, and hospice covered days, acute inpatient stays, other inpatient stays, SNF stays, hospice stays, and hospital readmissions were categorized into two categories. The two categories were created in response to the following question: Is the value of the variable for this cohort greater than the value of the other cohort? The categorized variables were analyzed by generalized estimating equations adjusted for age, gender, ethnoracial identity, and 26 other disease conditions. The OR, 99.9% CIs, and P values were reported. Statistical software SAS V.9.4 and SAS Enterprise Guide V.7.1 were used for all analyses.
Results
The baseline demographic information of the MNG and NNG cohorts for AAD and propensity score-matched sample is presented in table 2. The MNG and NNG cohorts differed in terms of age, gender, and ethnoracial identity. The mean (±SD) age of the MNG beneficiaries was 75.4 (±13.3) years, and 57.63% were women, 74.93% were whites, and 18.10% were blacks. The mean (±SD) age of the NNG beneficiaries was 71.3 (±11.4) years, and 52.79% were women, 79.24% were whites, and 12.58% were blacks. The cohorts also differed in terms of chronic conditions. However, after propensity score matching, the MNG and NNG cohorts were comparable for all variables (table 2).
Baseline characteristics of the study participants
The analysis of AAD for the effect of common conditions on survival showed that the risk for death in beneficiaries with malnutrition was higher (HR, 1.66; 99.9% CI 1.65 to 1.66; P<0.0001) than for other conditions such as IHD, AMI, stroke or TIA, COPD, CKD, and HF, except for lung cancer, for which the risk was the highest (HR, 2.70; 2.68 to 2.72), as shown in table 3.
Time to death from diabetes diagnosis for all available data adjusted for age, gender, race, and other conditions
The analysis of AAD for the effect of malnutrition within each of other seven common conditions showed that malnutrition had significant effect on survival (all P<0.0001). The greatest impact of malnutrition on survival was within COPD (HR, 1.66; 99.9% CI 1.64 to 1.67) and the smallest impact of malnutrition on survival was within AMI (HR, 1.47; 1.44 to 1.49) (table 3).
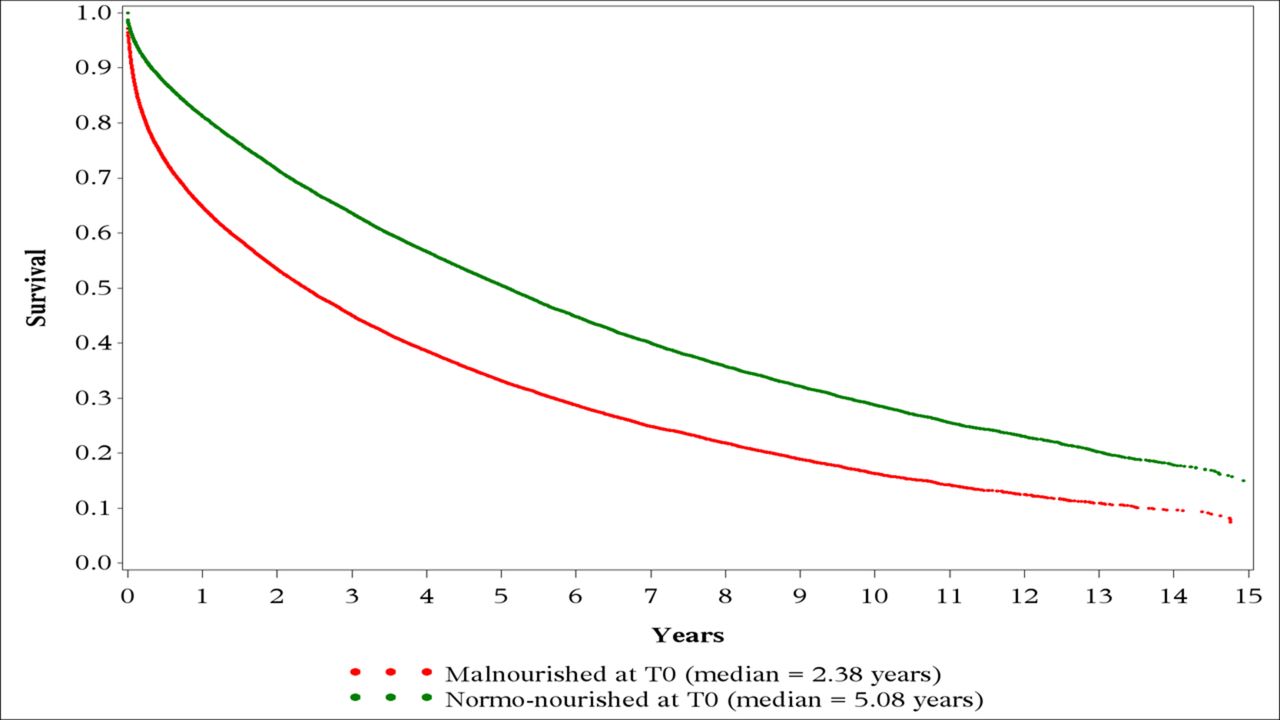
The analysis of propensity score-matched data for the effect of common conditions on survival exhibited the same trend as AAD with the risk for death in beneficiaries with malnutrition increasing by 69% (HR, 1.69; 99.9% CI 1.64 to 1.75; P<0.0001). Other conditions that conferred an increased risk for death were IHD (HR, 1.06; 1.02 to 1.10), AMI (HR, 1.19; 1.15 to 1.23), stroke or TIA (HR, 1.21; 1.18 to 1.26), COPD (HR, 1.43; 1.38 to 1.48), HF (HR, 1.50; 1.45 to 1.56), CKD (HR, 1.58; 1.53 to 1.64) and lung cancer (HR, 2.48; 2.41 to 2.56). The P value was <0.0001 for all as shown in figure 2A. The Kaplan-Meier survival curve for time to death from diagnosis of diabetes after propensity score matching revealed that the median survival times for the MNG and NNG were 2.38 and 5.08 years, respectively (figure 3).
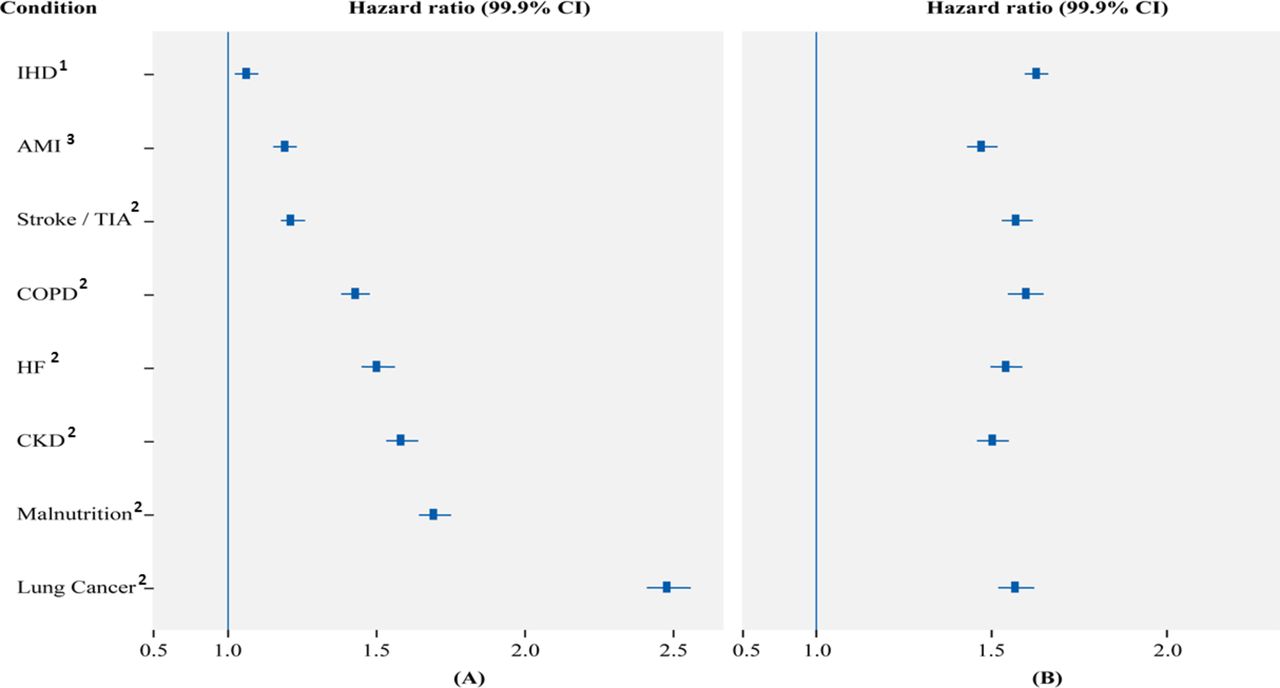
Time to death from diabetes diagnosis for propensity-matched sample adjusted for age, gender, race, and other conditions. HR and 99.9% CI for malnutrition and other comorbid conditions (A); effect of malnutrition within other common comorbid conditions (B). All P<0.0001. 1Adjusted for all other conditions at time zero, excluding AMI; 2adjusted for all other conditions at time zero; 3adjusted for all other conditions at time zero, excluding IHD. AMI, acute myocardial infarction; CKD, chronic kidney disease; COPD, chronic obstructive pulmonary disorder; HF, heart failure; IHD, ischemic heart disease; TIA, transient ischemic attack.
Kaplan-Meier survival curve for time to death from diabetes diagnosis (T0) using propensity score-matched sample for malnourished group and normo-nourished group.
The analysis of the effect of malnutrition on survival within the common conditions demonstrated that malnutrition had a significant effect in every case (all P<0.0001). The increased risk for death ranged from 47% within AMI (HR, 1.47; 99.9% CI 1.43 to 1.52) to 63% within IHD (HR, 1.63; 1.58 to 1.68) (figure 2B). Malnutrition significantly increased the risk for death by 50% within CKD (HR, 1.50; 1.46 to 1.55), 54% within HF (HR, 1.54; 1.50 to 1.59), 57% within stroke or TIA (HR, 1.57; 1.53 to 1.62) and 60% in COPD (HR, 1.60; 1.55 to 1.65) (figure 2B).
The healthcare utilization data for the MNG and NNG are presented in tables 4 and 5. The average annual healthcare cost for the individuals in the MNG (table 4) was 1.7 times greater than those in the NNG (median, $36 079 vs $20 787; P<0.0001). The bulk of this difference (median, $8775; P<0.0001) was from Medicare part A, with a smaller contribution from Medicare part B (median, $2113; P<0.0001). The annual spending in Medicare part D was not different between the MNG and NNG (P=0.87; table 4). All ORs (odds of greater number in MNG over odds of greater number in NNG) were statistically significant (P<0.0001) and greater than one acute inpatient covered days per year, other inpatient covered days per year, SNF covered days per year, hospice covered days per year, acute inpatient stays per year, other inpatient stays per year, SNF stays per year, hospice stays per year and hospital readmissions per year (table 4). Acute inpatient covered days per year had the highest OR of 3.08 (99.9% CI 2.87 to 3.30), meaning for a matched pair in the sample, the odds were 3.08:1 that the subject in the MNG group had more acute inpatient covered days than the subject in the NNG group. The other ORs in table 5 have similar interpretations. The MNG beneficiaries had 2.50-fold (2.33 to 2.67) and 2.08-fold (1.94 to 2.24) odds of higher acute and other inpatient stays, respectively, compared with the NNG beneficiaries (table 5).
The propensity score-matched differences between MNG and NNG in annual healthcare utilization
OR for annual healthcare utilization in propensity score-matched MNG and NNG adjusted for age, gender, ethnoracial identity, and 26 disease conditions
Discussion
Worldwide, the prevalence of diabetes continues to rise among adults, with over a quarter of US adults aged 65 years or older being affected. A WHO multinational study of vascular disease in diabetes confirmed that cardiovascular disease and renal disease accounted for 52% and 11% of the deaths, respectively, in patients with diabetes.24 Recently, a study by the Emerging Risk Factors Collaboration group demonstrated that in addition to vascular disease, diabetes is associated with increased mortality due to cancer, infectious diseases, liver disease, intentional self-harm, COPD, and other causes.25 However, malnutrition is not commonly listed as a comorbidity of diabetes, although there is evidence to indicate worsening of clinical outcomes when diabetes is associated with poor nutritional status, especially in geriatric patients.15 26 Malnutrition is estimated at 29%–61% in an elderly hospital population and is shown to be associated with markedly increased morbidity and mortality, lower quality of life (QoL), and increased healthcare costs.27–29 This is the first large retrospective cohort study to directly analyze the impact of malnutrition and common comorbid conditions on survival and annual healthcare utilization in elderly patients with diabetes by using the CMS claims database. The effect of common comorbid conditions including malnutrition on survival was analyzed for AAD as well as by propensity score matching by comparing the cohort having the condition with the cohort not having the condition at TZ, the first date of diagnosis of diabetes. The overall frequency of protein-energy malnutrition (PEM) in the Medicare population of over 15 million people with diabetes was 16.5%, with 5.3% malnourished at the time of diabetes diagnosis. When the effects of malnutrition and other common comorbid conditions on survival were analyzed after adjusting the confounders, the risk for mortality was increased in all available malnourished and propensity score-matched malnourished study populations. The risk for mortality was increased by 69% in beneficiaries with malnutrition, providing compelling evidence that malnutrition is an independent prognostic factor for survival among patients with diabetes. In fact, the risk for mortality observed for malnutrition is of a higher magnitude than the risk for mortality observed for any other chronic catabolic diseases associated with diabetes, such as CHF, CKD, and COPD. Considering the early and significant impact of malnutrition on survival identified by these analyses, appropriate malnutrition screening, assessment, diagnosis, and treatment in this population are critical.
Unfortunately, malnutrition is not widely recognized as a relevant comorbid condition in diabetes. This may be due in part to a misperception that PEM cannot coexist with overweight/obesity and/or use of nutritional assessment tools that use low BMI or underweight as part of the criteria, which can underestimate malnutrition in this population. Additionally, few studies have specifically evaluated malnutrition in older patients with diabetes. A prospective observational study of 1110 consecutive patients admitted across multiple hospitals in Spain reported that 21.2% of those with diabetes were malnourished, accounting for half of the inhospital deaths. Furthermore, 15.5% of the malnourished patients with diabetes were obese.15 In a large single-center observational study of mortality risk in critically ill patients, obesity was protective against 30-day mortality except in those with malnutrition wherein the 90-day mortality risk in obese malnourished patients (with BMI ≥30.0 kg/m2) was increased by 67% relative to normo-nourished patients.30 Thus, malnutrition does occur with relatively high prevalence in the context of elevated body weight, and as such presents an interesting paradox. In this current study, 10.22% of the total number of diagnoses were related either with underweight or severe malnutrition (ie, Kwashiorkor-like syndrome or marasmus), suggesting that the majority of diagnoses were related to clinical characteristics potentially independent of weight status. Currently, there is no biomarker used to diagnose PEM. According to the consensus by the Academy of Nutrition and Dietetics and the American Society for Parenteral and Enteral Nutrition, malnutrition is assessed based on weight loss (either fat or muscle), in combination with other clinical assessments such as energy intake, fluid accumulation, and/or fatigue.31 Use of assessment tools based on these guidelines should be helpful in standardizing malnutrition diagnoses for ICD-10 in at-risk populations, independent of body weight. In light of the results of this current study, however, further research on malnutrition assessment methods for patients with diabetes is needed and nutrition assessment for malnutrition at the time of diabetes diagnosis is critical.
Nutrition is an integral part of diabetes care; however, there may be additional considerations for older adults such as reduced energy requirements, decreased taste and smell sensitivities, decreased food variety and appetite, polypharmacy, difficulty in preparing food, social isolation and depression.5 32 Importantly, a cost-effective intervention for malnutrition can include oral nutritional supplements.33 34 A systematic review of 49 studies (not specifically patients with diabetes) reveals that nutritional supplements can improve nutrient intakes and mortality outcomes in malnourished older patients.35 A recent randomized controlled trial of 652 malnourished inpatients with COPD, CHF, AMI, and pneumonia showed that initiation of a specialized high-protein nutrition intervention with beta-hydroxy-beta-methylbutyrate during hospitalization and continuation postdischarge significantly decreased mortality compared with placebo receiving similar standard of care. The authors concluded that nutritional interventions that are effective in maintaining lean body mass benefit survival.36 While these findings were not specific for diabetes populations, the findings can have important implications as patients with diabetes also have higher incidence of sarcopenia despite a higher BMI, as a result of decreased antiproteolytic actions from insulin resistance or insulinopenia.37
According to the American Diabetes Association in 2012, the total estimated cost of diagnosed diabetes was $245 billion, including $176 billion for direct medical costs and $69 billion for reduced productivity.2 A major part of this cost (59%) for diabetes care in adults aged 65 years or older is provided by Medicare in the USA.2 Malnutrition in patients with diabetes further compounded the economic cost of diabetes as demonstrated by this analysis, in which there was a 58% increase in the cost of average annual healthcare in malnourished patients with diabetes compared with those who were normo-nourished. This increase in cost was attributed to longer durations of hospital stays and increased nursing and pharmacy costs. The diagnosis and treatment of malnutrition could result in a significant reduction of healthcare expenses in elderly population with diabetes.
The strength of the study is that it includes a large study cohort derived from the CMS database, which offers the advantages of a large population coverage, clinical validity of the Medicare data, and ease of data availability. Similar to other retrospective studies, this study has limitations. The analyses are limited by the lacunae in the CMS database such as non-availability of laboratory results and limited clinical information. The results of this study are limited to Medicare beneficiaries only, and therefore may not be generalizable to other populations. Malnutrition is recognized to be underdiagnosed, especially in those who are considered overweight or obese, which include many patients with diabetes. The baseline differences in multiple variables in the cohorts are the shortcomings of this study, although these were adjusted by using propensity scores for age, gender, ethnoracial identity, and 26 other disease conditions. Furthermore, cause and effect relationships of malnutrition to other chronic conditions prior to diabetes diagnosis in this retrospective analysis could not be studied: yet, in all analyses, malnutrition stood out to have a significant effect on survival time even within each chronic condition. Although the main focus of this study was mortality as a primary variable with cost as a secondary variable, the role of malnutrition on the QoL in patients with diabetes also needs to be evaluated.
In conclusion, this study confirmed malnutrition as a significant comorbidity for CMS beneficiaries with diabetes, affecting survival both independently and within other common comorbidities, providing compelling evidence that malnutrition is an independent prognostic factor for survival among patients with diabetes. Malnutrition in patients with diabetes further compounded the cost of diabetes care with a well over 50% increase. The results of this study may help guide nutrition assessment and clinical decision-making for the betterment of care for patients with diabetes, as well as lead to potentially significant cost savings. Given that patients experience short-term and long-term impact on survival after being diagnosed with diabetes, malnutrition assessment and diagnosis should be crucially considered and initiated at the time of diabetes diagnosis.
Acknowledgments
The authors would like to thank Ramu Periyasamy for assistance with the preparation of this manuscript and Dr Osama Hamdy for initial consultation.
References
Footnotes
Contributors The authors meet the criteria for authorship recommended by the International Committee of Medical Journal Editors and take full responsibility for all content in the manuscript and all editorial decisions. Concept and development and design of study: NA, SG, YC, VAM; data collection, analysis and interpretation: NA, SG, YC, VAM, SC, ML, JIM; development and review of the manuscript: NA, SG, YC, VAM, ML, JIM; finalization and approval of the manuscript: NA, SG, YC, VAM, SC, ML, JIM; guarantor of the study: NA.
Funding This study was sponsored by Abbott Nutrition.
Competing interests All except JIM are shareholders and employees of Abbott. JIM has served in the advisory board of Abbott Nutrition and has been a compensated advisor of Abbott Nutrition.
Provenance and peer review Not commissioned; externally peer reviewed.
Presented at 77th Annual ADA Scientific Sessions, poster, health care delivery–economics, 173-LB, 2017.