Article Text

Abstract
Objective Resting energy expenditure (REE) is linked to obesity, insulin resistance and type 2 diabetes (T2DM). REE and T2DM are inherited traits. Therefore, we investigated the effect of parental T2DM on REE in normoglycemic subjects.
Methods Eighty-seven subjects with parental T2DM and 83 subjects without parental T2DM were matched in age, gender, race, BMI, weight and waist circumference. Subjects underwent a 75 g oral glucose tolerance test; REE was determined by indirect calorimetry and body composition was assessed by dual energy X-ray absorptiometry. Statistical analysis was performed using Student’s t-test, analysis of variance and regression analysis.
Results The mean age was 38.8±11.3 years, 57% were females and 53% were African-Americans. The mean BMI was 28.5±6.1 kg/m2, waist circumference 91.8±15.1 cm, weight 83.9±20.3 kg, fat mass 31.0%±10.0%, mean fat-free mass (FFM) 54.4±12.9 kg. REE was significantly lower in subjects with parental diabetes, normalized REE 1364.4±263.4Kcal/day vs 1489.4±323.2 Kcal/day, p=0.006 and 29.2±5.3Kcal/kg FFM/day vs 31.9±6.0 Kcal/kg FFM/day, p=0.002. African-Americans had a lower REE compared with Caucasians 28.6±5.4Kcal/kg FFM/day vs 32.6±5.5 Kcal/kg FFM/day, p<0.0001. In a multiple regression model, ethnicity (p<0.0001), parental history of T2DM (p=0.006) and FFM (p=0.021) were independent predictors of REE.
Conclusion Compared with subjects without parental diabetes, offspring with parental T2DM had lower REE, which was more pronounced in African-Americans. This metabolic alteration could increase the risk of obesity, insulin resistance and dysglycemia.
- energy expenditure and obesity
- insulin resistance
- type 2 diabetes
This is an Open Access article distributed in accordance with the Creative Commons Attribution Non Commercial (CC BY-NC 4.0) license, which permits others to distribute, remix, adapt, build upon this work non-commercially, and license their derivative works on different terms, provided the original work is properly cited and the use is non-commercial. See: http://creativecommons.org/licenses/by-nc/4.0/
Statistics from Altmetric.com
Significance of this study
What is already known about this subject?
REE is higher in subjects with prediabetes and diabetes compared with normoglycemic individuals.
REE is lower in African-Americans compared with Caucasians.
What are the new findings?
Normoglycemic offspring of parents with type 2 diabetes (T2DM) have lower REE compared with subjects without parental diabetes.
Among subjects with parental diabetes, REE was lower in African-Americans compared with Caucasians.
How might these results change the focus of research or clinical practice?
Longitudinal studies are needed to determine:
If lower REE in subjects with parental diabetes and African-Americans would lead to weight gain, insulin resistance and incident dysglycemia.
If lower REE in African-Americans would explain the disparate prevalence of T2DM in ethnic minority groups.
Introduction
Energy expenditure plays a role in regulating body weight and correlates with the rate of change in body weight.1 The risk of gaining 7.5 kg in body weight over a 2-year period was increased fourfold in subjects with a low adjusted 24 hours energy expenditure.1 Low resting energy expenditure (REE) is a positive predictor of future weight gain in adults2 and has been linked to the disparate prevalence of obesity in ethnic minority groups.1 3 Also, alteration in body weight is accompanied with compensatory changes in energy expenditure which are aimed at restoring the usual weight of the individual.4 The association among obesity, insulin resistance and type 2 diabetes (T2DM) is well known.5
Both T2DM and energy expenditure are inherited traits, the concordance rate for T2DM in monozygotic twins approaches 100% with advancing age6 and available evidence indicates that resting metabolic rate is inherited independent of body composition, age, and sex.7–10 About 40% of the variance in energy expenditure may be explained by inherited characteristics.9 Very few studies have investigated the effect of parental diabetes on energy expenditure. In one of the studies, infants born to mothers with diabetes were reported to have lower REE compared with infants without parental diabetes.11 In another study, a history of T2DM in a first-degree relative was associated with lower REE and lipid oxidation, which could play a role in the development of obesity, insulin resistance and T2DM.12 Both impaired glucose tolerance13 14 and T2DM14–16 have been associated with higher REE compared with normoglycemic individuals. This may represent an early abnormality in the pathogenesis of T2DM. Considering the role of heredity and the relationship among energy metabolism, obesity, insulin resistance and T2DM, we hypothesized that normoglycemic offspring of parents with T2DM would exhibit discernable alterations in REE. Therefore, we sought to determine the effect of parental diabetes on REE in normoglycemic subjects.
Methods
Subjects inclusion criteria
Included in this study were healthy subjects aged 18–65 years who had biological parent(s) with or without T2DM. Additionally, subjects identified themselves as Caucasian or African-American and had normal blood glucose during a 75 g oral glucose tolerance test (OGTT).
Exclusion criteria
Subjects who had diabetes or were taking medications which affect glucose metabolism or body weight including antihyperglycemic agents, corticosteroids and hydrochlorothiazide were excluded from this study. Pregnant women and subjects who had history of recent hospitalization (within 6 weeks), those who were involved in a weight-loss program or have had bariatric surgery were also excluded from the study.
We enrolled a total of 170 participants; 83 subjects who did not have parental history of T2DM were matched in terms of demography and anthropometry with 87 offspring of parents with T2DM who were selected from the Pathobiology of Prediabetes in a Biracial Cohort (POP-ABC) Study. The details of the study design and methods of the POP-ABC Study have been described previously.17–19
Parental diabetes was determined by a questionnaire which obtained parental history including parents’ gender and age at diagnosis, use of antihyperglycemic agents and diabetes complications.17 18 Written informed consent was obtained from all subjects before participation in the study. The study, which was conducted in keeping with the principles of the Helsinki Declaration was carried out at the General Clinical Research Center of the University of Tennessee Health Science Center.
Study procedure
Each participant had a screening visit at which time a medical history was obtained and a physical examination was conducted. A standard 75 g OGTT was performed. Subjects who fulfilled the inclusion criteria underwent measurement of REE using indirect calorimetry and assessment of body composition using dual energy X-ray absorptiometry scan. Subjects were studied after an overnight fast. Weight was measured in duplicate using a calibrated balance beam scale and standing height was measured in duplicate with a standard stadiometer. The body mass index (BMI) was calculated as the weight in kilograms divided by the height in meters squared (kg/m2). Waist circumference was measured at the midpoint between the iliac crest and the lowest costal margin in the midaxillary line, with a Gulick II tape measure (Country Technology, Gays Mills, Wisconsin, USA). Blood pressure was measured with an automated sphygmomanometer with the subject in the seated position. In preparation for OGTT, subjects were instructed to consume a usual diet with adequate carbohydrates but to avoid strenuous exercise, consumption of alcohol, coffee, tea or smoking before the test. OGTT was performed between 7:00 and 11:00, after fasting for about 12 hours. Venous blood sampling for glucose and insulin was performed before ingestion of 75 g of glucose (Trutol 75; Custom Laboratories, Holden, Missouri, USA) and at 30 min and 120 min after glucose ingestion.
Biochemical measurements
Plasma glucose was measured using the glucose oxidase method (Yellow Spring Instruments Co, Yellow Spring, Ohio, USA) and plasma insulin was assessed by ELISA in our Endocrine Research Laboratory.
Measurement of REE by indirect calorimetry
Before measurement of REE, subjects were instructed to avoid strenuous exercise and alcohol consumption for 24 hours before the test. Also, they were instructed to avoid smoking and consumption of coffee or tea before the test. The test was performed between 7:00 and 11:00, after fasting for approximately 12 hours. Energy expenditure was measured using Cardio Coach CO2 Metabolic Monitor model 9002-CO2 (KORR Medical Technologies, Salt Lake City, Utah, USA). Prior studies have examined the validity and reliability of handheld indirect calorimeter machines such as the Cardio Coach CO2 Metabolic Monitor for measuring REE.20 21 The Cardio Coach CO2 Metabolic Monitor measures the volume of oxygen consumed and the volume of carbon dioxide expired and calculates the REE using the modified Weir equation. The Cardio Coach CO2 and ReeVue Metabolic System have been found to yield comparable results with the MedicalGraphics indirect calorimeter machine.22
On arrival to the General Clinical Research Center, the procedure was explained to the subject who was seated comfortably, relaxed and awake in a reclining chair for 30 min before indirect calorimetry was performed. The machine was calibrated, a mouthpiece was placed in the subject’s mouth making a tight seal around the tubing with the lips; a nose clip was then placed gently around the alae nasi to close the nostrils. The subject was then connected to the machine using flexible extendable plastic tubing and was instructed to breathe through the mouth as naturally as possible. A reading of the estimated REE was displayed automatically by the Cardio Coach CO2 Metabolic Monitor after a steady state was achieved. The report produced by the machine was then printed and stored in the subject’s records. A steady state was achieved by the Cardio Coach CO2 Metabolic Monitor after 10–15 min of breathing through the mouth piece and resting comfortably in the reclining chair while awake. The measurement was repeated for accuracy.
Calculation of normalized REE
Given that the intercept of the linear relationship between REE and fat-free mass (FFM) is different from zero,23 we confirmed FFM normalized REE using residuals of REE after adjustment for FFM in a linear regression model. We included age, sex, and fat mass as covariates for a more accurate normalized determination.
Predicted REE was calculated using the following formulae which were derived from linear regression models:
Subjects without parental history of diabetes
Women: REE=548.3 + (18.5×FFM) + (age − 4.5) + (18.3×fat mass) – 460.2
Men: REE=548.3 + (18.5×FFM) + (age − 4.5) + (18.3×fat mass)
Subjects with parental history of diabetes
Women: REE=587.5 + (18.9×FFM) + (age – 4.7) + (5.6×fat mass) − 69
Men: REE=587.5 + (18.9×FFM) + (age – 4.7) + (5.6×fat mass)
Normalized REE = (mean group REE +subjects measured REE) – predicted REE24
Statistical analysis
Data are reported as means±SD unless otherwise specified. Significance level was set as p<0.05. Anthropometry, body composition and REE were compared between parental diabetes status and between ethnicity using Student’s t-test and χ2 test as appropriate. Multiple regression was used to determine the independent effect of anthropometry, body composition, parental diabetes status and ethnicity on REE. Normality assumption was tested using the Anderson-Darling test. All statistical analyses were performed with the use of SAS statistical software, V.9.4 (SAS Institute, Cary, North Carolina, USA).
Results
Anthropometry/body composition
The study population comprised 170 subjects with mean age 38.8±11.3 years, 57% were women and 53% were African-Americans. The mean BMI of the population was 28.5±6.1 kg/m2, waist circumference was 91.8±15.1 cm. The mean weight was 83.9±20.3 kg, body fat comprised 31% of the body weight and FFM was 54.4±12.9 kg. Subjects with parental diabetes and those without parental diabetes were statistically comparable in age, sex, ethnicity, BMI, weight, waist circumference and body composition (p>0.1). The anthropometry, body composition and energy expenditure by parental diabetes status is shown in table 1.
Anthropometry, body composition and energy expenditure by parental diabetes
African-Americans had a higher BMI, weight, waist circumference and lean body mass compared with Caucasians (p<0.05) but body fat composition was similar in both groups. The anthropometry, body composition and energy expenditure by ethnicity is shown in table 2.
Anthropometry, body composition and energy expenditure by ethnicity
Energy expenditure
Effect of parental diabetes
Normalized REE was significantly lower in subjects with parental diabetes compared with those without (1364.4±263.4 Kcal vs 1489.4±323.2 Kcal, t=2.78, p=0.0063). Similarly, REE per FFM was significantly lower in subjects with parental diabetes compared with those without (29.2±5.3 Kcal/kg FFM/day vs 31.9±6.0 Kcal/kg FFM/day, t=3.14, p=0.002). In a multiple regression analysis, parental history of diabetes emerged as a strong independent predictor of REE (t value 2.8, p=0.0057)
Effect of ethnicity
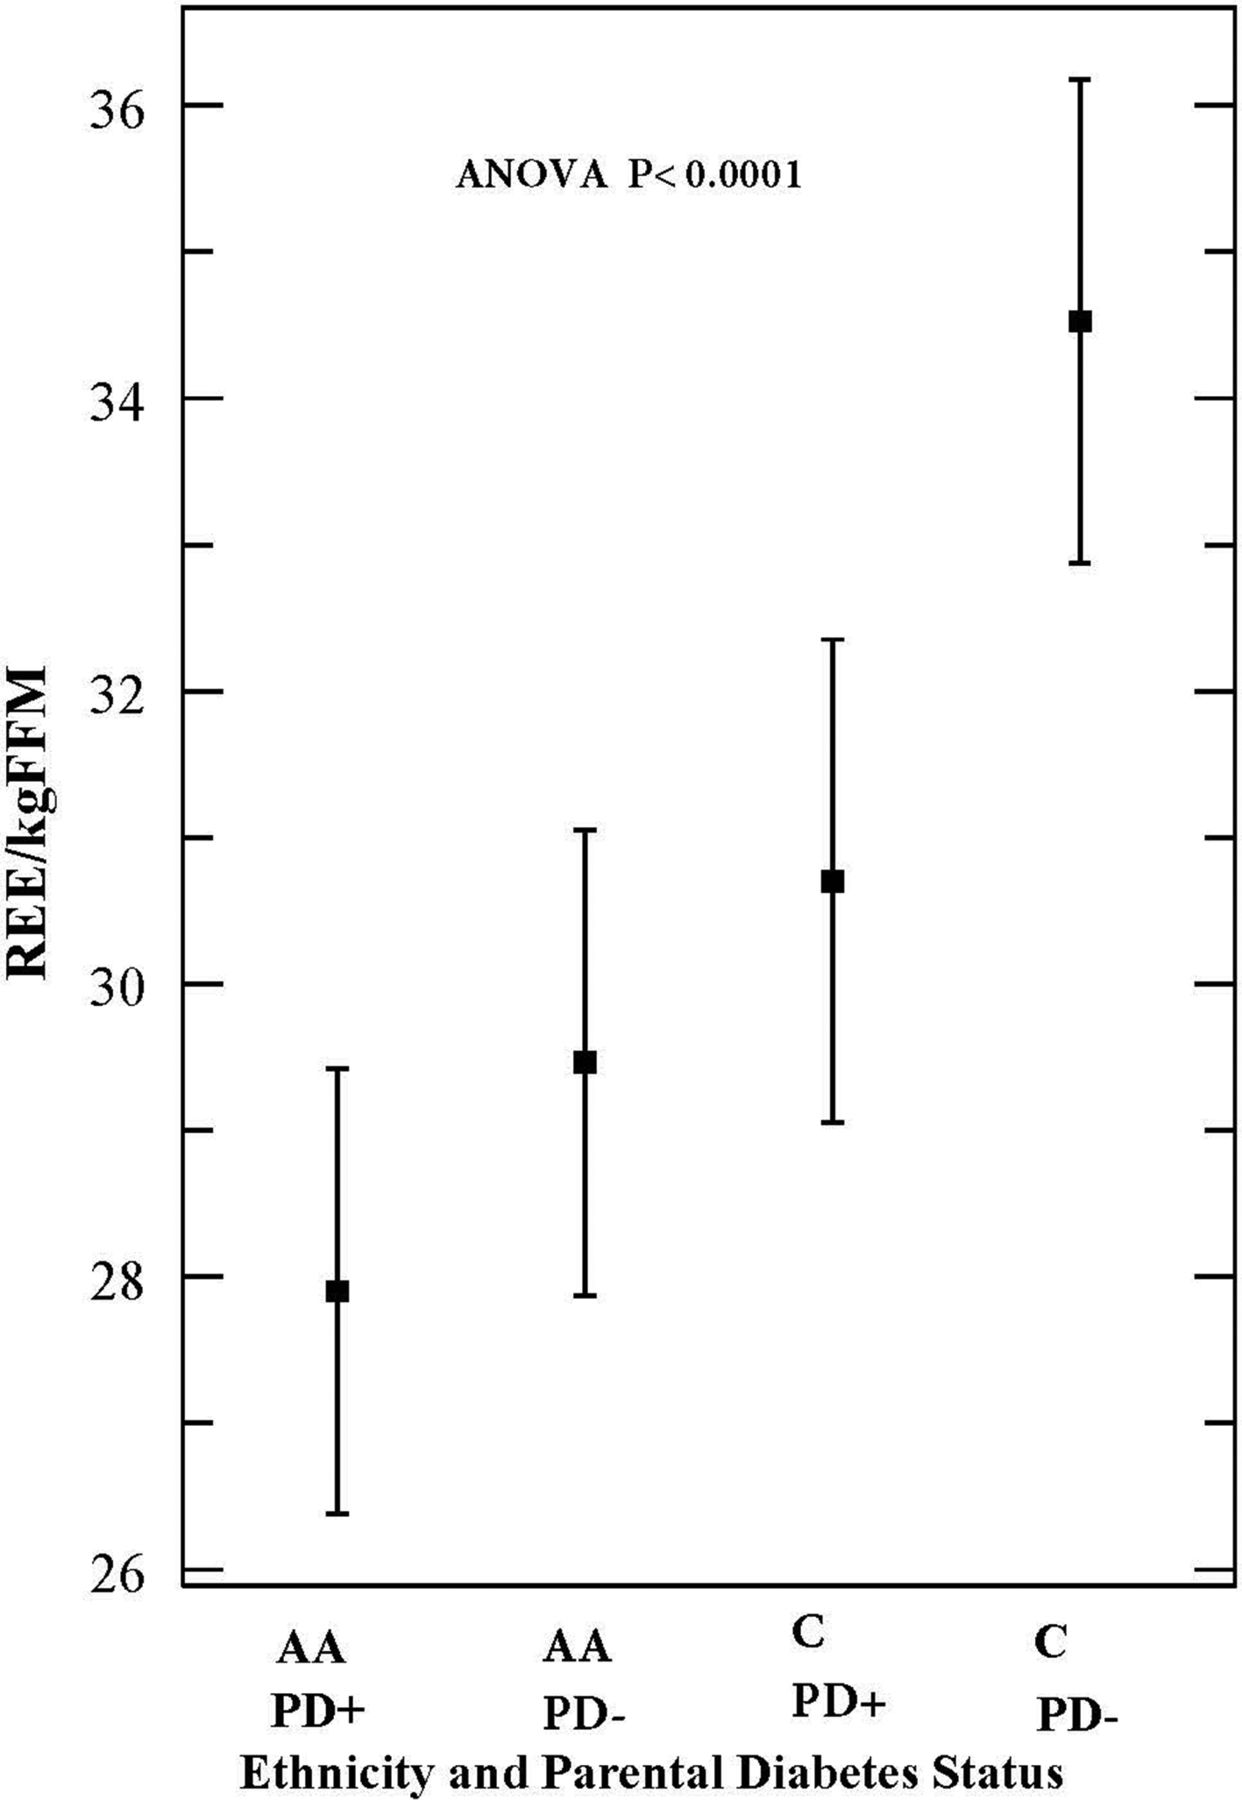
African-Americans had lower REE compared with Caucasians, normalized REE (1362.7±291.9 Kcal/day vs 1496.1±294.6 Kcal/day, t=2.96, p=0.0035) and REE per FFM (28.6±5.4 Kcal/kg FFM/day vs 32.6±5.5 Kcal/kg FFM/day, t=4.75, p<0.0001). Analyzed by ethnicity and parental status using analysis of variance, African-Americans with parental diabetes had the lowest REE per FFM (27.9±5.2 Kcal/kg FFM/day), while Caucasians without parental diabetes had the highest REE (34.5±5.4 Kcal/kg FFM/day) (p<0.0001; figure 1).

Effect of ethnicity and parental diabetes on resting energy expenditure (REE) (group means with 95% CIs) AA, African-American; ANOVA, analysis of variance; C, Caucasians; PD+, subjects with parental history of type 2 diabetes; PD, subjects without parental history of type 2 diabetes.
Although, all participants were normoglycemic, subjects with parental diabetes were more insulin-resistant (HOMA-IR: 1.65±1.71 vs 0.94±0.86, t=3.36, p=0.0009) and had a higher 2 hours glucose during OGTT compared with those without parental history of diabetes (125.0±30.0 mg/dL vs 112.8±18.6 mg/dL, t=−3.17, p=0.0018).
In a multiple regression model, which included FFM, fat mass, sex, age, BMI and parental diabetes status, the independent predictors of REE were ethnicity (p<0.0001), parental diabetes status (p=0.006) and FFM (p=0.021) (see table 3). In a separate regression analysis using glucoregulatory indices as covariates, fasting plasma glucose (p=0.09), 2 hours glucose during OGTT (p=0.36) and HOMA-IR (p=0.33) did not predict REE. We performed a similar regression analysis as shown in table 3 in subgroups by age and BMI (age (<38 years and ≥38 years) and BMI (<25 kg/m2and ≥25 kg/m2)). These findings were consistent across subgroups categorized by age and BMI.
Multiple regression: effect of anthropometry, body composition, parental diabetes and ethnicity on resting energy expenditure (REE)
Anderson-Darling test for normality indicated that a normal distribution may be assumed for REE (p>0.25).
Conclusion
In this study, we have shown that in comparison with subjects without parental diabetes, offspring of parents with T2DM had a lower REE that would amount to an energy surplus of 2.7 Kcal/kg FFM/day. Taking into account mean FFM of 53.8 kg, this translates to ~145 Kcal/day or 53 020 Kcal per year (~6.9 kg weight gain per year). According to the data published by Wishnofsky,25 one pound has a caloric value of 3500 Kcal or (1 kg=7700 Kcal). We derived the estimated weight gain in kg by dividing the projected energy accrual by 7700. When normalized REE is used for this estimation, subjects with parental diabetes had a daily energy surplus of 125 Kcal which would translate to ~6 kg weight gain per year.
Furthermore, we have replicated the previously reported ethnic disparity in REE1 3 16 26 and have extended those findings by demonstrating that the deficit in energy expenditure was more pronounced in African-Americans with parental diabetes. A comparison of REE/FFM between Caucasians and African-Americans showed that African-Americans had an energy surplus of ~229 Kcal/day or 83 804 Kcal/year (~10.9 kg weight gain per year). Alternatively, estimation using normalized REE yielded a surplus of 133.3 Kcal/day or 48 654.5 Kcal/year (~6.3 kg weight gain/year).
Although a lower energy expenditure has been widely reported in African-Americans, its genesis remains poorly understood. A cross-sectional study which compared the mass of high-metabolic-rate organs such as the liver, kidney, heart, spleen and brain in African-Americans and Caucasians reported that the lower REE in the African-Americans may be accounted for by a lower mass of highly metabolically active FFM.27 However, the study was limited by relatively large differences between the racial groups in baseline anthropometric and body composition data and very few African-American men. Also, the volume of other lean organs such as the lungs, intestines and stomach were not measured in that study. Considering the fact that the brain, liver, heart and kidneys, which constitute a small proportion of total FFM account for about 60%–70% of REE in adults,28 it appears plausible that small differences in the composition of these organs could influence REE across ethnic groups. Second, we have reported a lower fasting blood glucose in African-Americans compared with Caucasians in our POP-ABC cohort,18 a trend that was observed in this study. Given that hepatic glucose production is a major contributor to fasting glycemia, we speculate that a lower rate of gluconeogenesis, which is an energy consuming process29 could play a role in the lower REE observed in African-Americans. In our study, a multiple regression analysis using glucose levels during OGTT and homeostatic model assessment of insulin resistance (HOMA-IR) as covariates, fasting blood glucose showed an insignificant trend towards prediction of REE. Thus, the mechanism(s) for low REE in African-Americans remain to be fully elucidated.
Our findings have implications for future risk of obesity and dysglycemia. For example, low REE has been reported to be a predictor of future weight gain in adults2 and has also been linked to the high prevalence of obesity among ethnic minority groups.1 3 Excess weight gain has been linked to the development of insulin resistance, insulin secretory dysfunction and T2DM in longitudinal studies.30 31 For example, weight gain predicted progression from normoglycemia to prediabetes in Pima Indians and deterioration from prediabetes to T2DM was associated with a further increase in weight.30 Also, in the POP-ABC Study which recruited euglycemic offspring of parents with T2DM, the mean weight change among individuals who remained euglycemic was 0.48 kg compared with 2.54 kg in subjects who developed prediabetes during a mean follow-up of 2.62 years.18 Interestingly, the average weight change tended to be greater in African-Americans compared with Caucasians among those that developed dysglycemia.18
Given the inverse association between low resting and exercise energy expenditure and weight gain, our findings of a lower REE in African-American offspring predicts increased risk of obesity and dysglycemia among these subjects. By the same token, the Caucasian offspring who had lower REE than Caucasians without parental diabetes would be at increased risk of obesity and dysglycemia. These notions are consistent with our previous report showing that self-reported physical activity level was a predictor of incident prediabetes and metabolic syndrome.32 Paradoxically, hyperglycemia has been associated with higher REE compared with normoglycemia.13–16 Higher REE in dysglycemic states may be explained by endogenous glucose production via gluconeogenesis.14 Gluconeogenesis, which is the primary source of endogenous glucose production in T2DM, is an energy dependent process; sleeping metabolic rate measured in a metabolic chamber was positively correlated with endogenous glucose output in Pima Indians.33 It has been estimated that the energy requirement of increased gluconeogenesis could account for over 50% of the observed higher energy expenditure in subjects with T2DM.29 A higher endogenous glucose production is a late event in the pathogenesis of T2DM, which occurs during the transition from prediabetes to T2DM.30 Therefore, the observation of higher REE in hyperglycemia does not invalidate the expected relationship between energy expenditure and weight trajectory among normoglycemic subjects observed in our study.
We hereby show a discordance in energy expenditure between normoglycemic subjects with and without parental diabetes, which is in accord with the few previous reports on the subject.11 12 In one of those reports, infants born to mothers with diabetes during pregnancy were observed to have lower REE than infants without maternal diabetes, suggesting that the discordance in energy expenditure may be programmed early in life.11 In the second report, a family history of T2DM not only predicted lower REE but also lower lipid oxidation, factors that would be strongly predictive of downstream risk of obesity, insulin resistance and T2DM.12 Furthermore, in accordance with our finding, decreased REE was reported in first-degree relatives of subjects with T2DM in the Botnia Study.34 Additionally, evidence from a recent report in Pima Indians living in Arizona, who have high prevalence of obesity, indicates that energy expenditure is a familial trait with heritability equal to 0.52 and that lower energy expenditure predicted weight and fat mass accrual.35
The strength of our study includes a well characterized study population with rigorously matched anthropometric data in the comparison groups and validated methodology for assessing REE. Our study has limitations. We performed a cross-sectional study which did not track weight gain and dysglycemia. Indeed a longitudinal study would be required to gain such specific insights. Lower energy expenditure may not always equate to an energy surplus as energy intake could be lower in subjects with lower REE or physical activity energy expenditure may be higher, thus balancing the total energy expenditure.
In summary, compared with subjects without parental diabetes, normoglycemic offspring of parents with T2DM had diminished REE. This metabolic alteration could increase the risk of obesity, insulin resistance and incident dysglycemia.
Acknowledgments
The authors thank the participants who volunteered for this study.
References
Footnotes
Contributors SD-J: Principal investigator, design of study, review and revision of manuscript; guarantor. EAN: data collection, drafting and revision of manuscript; IO: data collection, review and revision of manuscript; CCO: data collection, review of manuscript; JYW: statistical analysis, review and revision of the manuscript.
Funding This study was funded by the National Institutes of Health (Grants R01 DK067269, R01 DK067269-04S1), American Diabetes Association (Grant 7-07-MN-13), and the State of Tennessee (UTHSC GCRC Fund).
Disclaimer The funding sources had no role in the design and execution of the study nor in the analysis and publication of the data obtained.
Competing interests None declared.
Patient consent Not required.
Ethics approval The Institution Review Board of the University of Tennessee Health Science Center.
Provenance and peer review Not commissioned; externally peer reviewed.
Data sharing statement No additional data are available.
Collaborators POP-ABC Research Group: Current: SD-J, MD (Principal Investigator), Amy Brewer, MS, RD, Fatoumatta Ceesay, BS, IO, MBBS, MPH, Nkiru Umekwe, MBBS, JIW, PhD. Past members: Emmanuel Chapp-Jumbo, MBBS (2009–2011), Ruben Cuervo, MD (2006–2007), Sotonte Ebenibo, MBBS, MPH (2012–2015), Chimaroke Edeoga, MBBS, MPH (2007–2013), Nonso Egbuonu, MBBS (2007–2010), Nicoleta Ionica, MD (2007–2008), Dorota Malinowski, MD (2007–2008), Casey Provo, MS, RDN (2016-2017). Consultant: Steven Haffner, MD; Data and Safety Officer: Murray Heimberg, MD, PhD.