Article Text

Abstract
Objective The German Diabetes Risk Score (GDRS) is a diabetes prediction model which only includes non-invasively measured risk factors. The aim of this study was to extend the original GDRS by hemoglobin A1c (HbA1c) and validate this clinical GDRS in the nationwide German National Health Interview and Examination Survey 1998 (GNHIES98) cohort.
Research design and methods Extension of the GDRS was based on the European Prospective Investigation into Cancer and Nutrition (EPIC)-Potsdam study with baseline assessment conducted between 1994 and 1998 (N=27 548, main age range 35–65 years). Cox regression was applied with the original GDRS and HbA1c as independent variables. The extended model was evaluated by discrimination (C-index (95% CI)), calibration (calibration plots and expected to observed (E:O) ratios (95% CI)), and reclassification (net reclassification improvement, NRI (95% CI)). For validation, data from the GNHIES98 cohort with baseline assessment conducted between 1997 and 1999 were used (N=3717, age range 18–79 years). Missing data were handled with multiple imputation.
Results After 5 years of follow-up 593 incident cases of type 2 diabetes occurred in EPIC-Potsdam and 86 in the GNHIES98 cohort. In EPIC-Potsdam, the C-index for the clinical GDRS was 0.87 (0.81 to 0.92) and the overall NRI was 0.26 (0.21 to 0.30), with a stronger improvement among cases compared with non-cases (NRIcases: 0.24 (0.19 to 0.28); NRInon-cases: 0.02 (0.01 to 0.02)). Almost perfect calibration was observed with a slight tendency toward overestimation, which was also reflected by an E:O ratio of 1.07 (0.99 to 1.16). In the GNHIES98 cohort, discrimination was excellent with a C-index of 0.91 (0.88 to 0.94). After recalibration, the calibration plot showed underestimation of diabetes risk in the highest risk group, while the E:O ratio indicated overall perfect calibration (1.02 (0.83 to 1.26)).
Conclusions The clinical GDRS provides the opportunity to apply the original GDRS as a first step in risk assessment, which can then be extended in clinical practice with HbA1c whenever it was measured.
- risk assessment
- clinical practice
- type 2 diabetes
- HbA1c
This is an Open Access article distributed in accordance with the Creative Commons Attribution Non Commercial (CC BY-NC 4.0) license, which permits others to distribute, remix, adapt, build upon this work non-commercially, and license their derivative works on different terms, provided the original work is properly cited and the use is non-commercial. See: http://creativecommons.org/licenses/by-nc/4.0/
Statistics from Altmetric.com
Significance of this study
What is already known about this subject?
The original version of the German Diabetes Risk Score (GDRS) including only non-invasively measured risk factors is an accurate and valid tool for prediction of diabetes risk.
Previous research suggests that biomarkers like hemoglobin A1c (HbA1c) improve prediction beyond non-invasive risk factors.
What are the new findings?
Including HbA1c in the GDRS (clinical GDRS) improved the accuracy of prediction for incident diabetes—particularly among future diabetes cases—and application of this clinical GDRS in a nationwide cohort confirmed external validity with excellent discrimination as well as good calibration.
How might these results change the focus of research or clinical practice?
The clinical GDRS represents a validated tool for predicting diabetes in clinical practice and may be applied by physicians to enable the evaluation of the patient’s risk profile from a more detailed perspective.
Introduction
The clinical value of risk scores in the context of detection of high-risk individuals and prevention has been confirmed by implementation of the Framingham Risk Score1–3 and by recommendations within the European prevention guidelines for cardiovascular diseases.4 While prediction models including only non-invasively measured risk factors are advantageous for application among the general population and thus enabling laypersons to estimate their individual diabetes risk, prediction models including clinical markers are targeted toward the clinical setting where information about blood parameters is readily available. For diabetes, various prediction models were developed within the past decades, including models based on solely non-invasively measured risk factors or on additional clinical markers.5 6 However, only a limited number of these models were externally validated or provided an instrument for use in clinical practice.5 Thus, only a few diabetes risk scores have the potential for application in the clinical context. One advantage of such an application was shown in a recent study indicating that preceding risk calculation based on risk scores may enhance the uptake of screening activities, especially those including blood tests.7 Such a stepwise approach with identification of high-risk individuals and following blood test might also be valuable in a longer perspective in terms of cost-effectiveness of lifestyle interventions in diabetes prevention strategies (Kristin Mühlenbruch, Submitted, 2018) . For hemoglobin A1c (HbA1c) it was shown that targeting prevention interventions to high-risk individuals based on HbA1c alone was cost-effective.8 Additionally, results from a previous study indicate that HbA1c, although still in the normal range, is related to an increased diabetes risk, suggesting that it might also be informative for diabetes risk prediction.9 Therefore, inclusion of HbA1c as a clinical marker might entail the potential to improve prediction, and to increase success of screening strategies in terms of acceptance, participation and cost-effectiveness for diabetes prevention.”
The German Diabetes Risk Score (GDRS), which originally only includes non-invasively measured risk factors, is an accurate and valid tool for diabetes prediction.10–12 Previous reports of model extensions with glucose markers showed relevant improvement in prediction accuracy.13 However, a clinical version was so far not available since HbA1c was only measured in a case-cohort study design with over-representation of diabetes cases. Absolute risk estimation was not possible from this design; however, a recent study showed that multiple imputation (MI) was a valid approach for absolute risk estimation from case-cohort studies.14 Therefore, the aim of this study was to extend the GDRS with HbA1c using MI in a first step, and in a second step to validate the derived scoring algorithm in a nationwide German cohort. The approach applied in this study offers the opportunity to maintain a version of the GDRS including only non-invasively measured risk factors which is targeted at the general population, and at the same time to provide a version including HbA1c which can be applied in the clinical setting when such data are available.
Methods
Study populations
EPIC-Potsdam
The European Prospective Investigation into Cancer and Nutrition (EPIC)-Potsdam study is a prospective cohort study comprising 27 548 participants from the general adult population mainly aged between 35 and 65 years. Participants were recruited from 1994 to 1998 in Potsdam and surrounding municipalities; follow-up assessment was performed every 2–3 years and was mainly questionnaire-based.15 16 For follow-up rounds 1, 2, 3, and 4 (by August 2005), follow-up procedures successfully achieved response rates of 96%, 95%, 91% and 90%, respectively.17 The baseline assessment included physical examinations, a personal interview, a lifestyle questionnaire and a Food Frequency Questionnaire (FFQ).
Follow-up questionnaires were used for the identification of incident diabetes.17 Systematic information sources for incident cases were self-reports of a type 2 diabetes (T2D) diagnosis, T2D-relevant medication, and dietary treatment due to T2D during follow-up. Furthermore, we obtained additional information from death certificates or from random sources, such as tumor centers, physicians, or clinics that provided assessments from other diagnoses. Although self-reports of T2D were generally reliable, by including other sources of information, we even improved the completeness of case ascertainment. Once a participant was identified as a potential case, disease status was further verified by sending a standard inquiry form to the treating physician. Only physician-verified cases with a diagnosis of T2D (International Classification of Diseases, 10th revision code: E11) and a diagnosis date after the baseline examination were considered confirmed incident cases of T2D.
Erythrocyte levels of A1c were measured in a case-cohort nested within the EPIC-Potsdam cohort. For the construction of this case-cohort study, a random subcohort (n=2500) based on 26 437 participants who provided blood was drawn and all incident diabetes cases with available blood samples (n=820) were included. Measurements were performed at the university clinic in Tübingen with the automatic ADVIA 1650 analyzer (Siemens Medical Solutions, Erlangen, Germany). Measured HbA1c values were generally too high for a healthy population with a median of 6.38% (mean: 6.47%, SD: 0.68%) in the random subcohort, and therefore representative German survey data were used to correct these values. Based on 6266 participants without known diabetes of the German National Health Interview and Examination Survey 1998 (GNHIES98) with a mean HbA1c of 5.47% (SD: 0.61%), a prediction model was derived including age (years), sex (female) and waist circumference (cm) as the predictors:

Comparing the measured HbA1c values with those expected in the case-cohort study nested within the EPIC-Potsdam study by applying the prediction model resulted in a mean difference of 0.98% points; this means that the measured values were about 1% point higher as expected. Consequently, the following correction was applied:

Although HbA1c was only measured in the case-cohort study, the analysis was performed in the full cohort, and we excluded prevalent diabetes cases (n=1554), non-verified diabetes cases (n=13) and participants with missing follow-up and/or age at follow-up (n=589); 25 392 participants remained for analysis. Within a mean follow-up time of 7 years, 857 incident diabetes cases were observed, and 593 incident cases after 5 years of follow-up.
GNHIES98 cohort
The study population comprised individuals who participated in both the ‘German National Health Interview and Examination Survey 1998’ (GNHIES98, 1997–1999) and the following ‘German Health Interview and Examination Survey for Adults’ (DEGS1, 2008–2011). The GNHIES98 included a representative sample of the general population in Germany aged 18–79 years. A two-stage stratified sampling strategy was applied based on information from local population registries.18 Out of 7124 participants of the GNHIES98, a total of 3959 reparticipated in DEGS1, corresponding to a follow-up rate of 62%.19 At baseline (GNHIES98), a standardized self-administered questionnaire including an FFQ was applied, and a standardized physician-administered interview as well as physical examinations were conducted.
Incident cases of diagnosed T2D at follow-up (DEGS1) were defined as (1) self-reported physician-diagnosed diabetes assessed in a standardized physician-administered interview or (2) intake of antidiabetic medication within the 7 days before the interview documented through an automated assessment of medication. Both had to be reported for the first time at follow-up. Incident cases of type 1 diabetes were excluded by taking information on the age at diagnosis and on insulin treatment after diagnosis and at the time of the interview into account. Incident cases of gestational diabetes were excluded by considering information on whether the diagnosis had occurred during pregnancy and whether diabetes during the last 12 months or current taking of antidiabetic medication was reported.20
In GNHIES98, HbA1c was measured in fresh whole blood specimens in the Robert Koch Institute Central Epidemiological Laboratory. For blood analyses, a Diamat high-performance liquid chromatography analyzer (Bio-Rad Laboratories, Munich, Germany) was used and reagents of Recipe (Recipe Chemicals and Instruments, Munich, Germany) were applied.21
Exclusion criteria included prevalent diabetes at baseline (n=132), missing information on diabetes diagnosis at baseline (n=11) or follow-up (n=37), incident gestational diabetes or type 1 diabetes (n=25), and missing or implausible age of diabetes diagnosis at follow-up (n=37), yielding a final ‘GNHIES98 – longitudinal sample’ of 3717 participants. Within a mean follow-up time of 12 years, 230 incident diabetes cases were observed, and 86 incident cases after 5 years of follow-up.
Calculation of the GDRS and assessment of GDRS components in the GNHIES98 cohort
The GDRS is based on modifiable and non-modifiable non-invasively measurable risk factors as described previously.10 11 22 Calculation of the GDRS points is based on individual risk factor values and corresponding coefficients from Cox regression as presented in the following equation:

Individual score points, mean score points and baseline survival were used for calculation of individual 5-year risks using the published equation 14:

The assessment of the GDRS components in the GNHIES98 cohort has previously been described and was mostly comparable with the assessment in EPIC-Potsdam.12 Since sibling history of diabetes was not assessed in the GNHIES98 cohort, it was imputed by the prevalence of a sibling history of diabetes (5.1%) observed in EPIC-Potsdam in accordance with previous validation studies.10 12 Physical activity was assessed as regular sport activity by the following five categories: ‘no sport’, ‘<1 hour/week’, ‘1–2 hours/week’, ‘2–4 hours/week’, and ‘>4 hours/week’. To create a quasi-continuous variable, the mean time of each category was assigned to the respective category, that is, 0, 0.5, 1.5, 3.0 and 4.5 hours/week. Furthermore, only frequencies of dietary intake were assessed. To estimate the amount of intake for each dietary component of the GDRS, information from a subset of 4030 out of the 7124 GNHIES98 participants who took part in the Nutrition Survey module comprising a detailed diet history interview was used as previously described.12
Statistical analysis
In EPIC-Potsdam, missing values were handled with MI with a number of m=10 imputations. This applies to the outcome (incident diabetes), components of the GDRS, auxiliary variables which were used for the imputation model, and HbA1c (online supplementary table S1). HbA1c was not measured for participants outside the previously described case-cohort and was assumed to be missing at random due to the design of the case-cohort study. The validity of this approach was confirmed in a recent methodological investigation based on data from the EPIC-Potsdam study.14 For imputation, variables were sorted by the amount of missing values and imputed with application of chained equations with imputation models specified for each variable separately.
Supplemental material
Cox regression was performed to derive the clinical GDRS model, with the score points of the original non-invasive GDRS and HbA1c as the independent variables in the model. Thus, score points for the clinical GDRS were derived from the beta-coefficients for both from this model. Results from the single imputation data sets were combined by application of Rubin’s rules.23 Baseline survival estimates were combined as proposed by Marshall et al.24 Individual risks were then calculated using combined MI estimates of the mean score points of the clinical GDRS, individual score points of the clinical GDRS and baseline survival from Cox regression. Model performance was evaluated by discrimination, reclassification and calibration; results from the single MI data sets were averaged to get overall estimates of the C-index25 of the net reclassification improvement (NRI) and for calibration. Calibration was evaluated as calibration-in-the-large by comparing the mean predicted risk with observed incidence, graphically with a calibration plot, and with expected to observed (E:O) ratio with 95% CIs, assuming a Poisson variance.26 The NRI was computed using four predefined risk categories which are currently used for communication of GDRS test results (low risk: <2%; still low risk: 2% to <5%; increased risk: 5% to <10%; high or very high risk ≥10% 5-year risk). The single NRI components as well as the overall estimate were presented with 95% CI as proposed by Mühlenbruch et al.27 For calibration, the same four risk groups were analyzed.
For validation in the GNHIES98 cohort, missing values in the GDRS components and in HbA1c were also handled with MI (m=10). Besides the outcome (incident diabetes), variables for calculation of the GDRS, auxiliary variables and HbA1c, the imputation model further included the cluster variable and the weighting factor (online supplementary table S2).28 29 The cluster variable accounts for the complex survey design, whereas the weighting factor accounts for differences between the survey sample and the general population and for the incomplete follow-up.30 MI of the missing values and combination of the results from the single imputed data sets was conducted as described for EPIC-Potsdam. However, for combining the results from the single imputation data sets in the GNHIES98 cohort, SAS (V.9.4) survey procedures again considering the cluster variable and the weighting factor28 were applied. Based on logistic regression, discrimination was assessed through the area under the receiver operating characteristic curve, which in this case is equivalent to the C-index. The 95% CI of the C-index was estimated performing B=1000 bootstrap draws followed by m=1 imputation as suggested by Wahl et al.31 For the bootstrap procedure the individual sample points of the GNHIES98 were resampled,32 and the 2.5% and the 97.5% percentiles of the bootstrapped distribution were then used as confidence limits. Calibration was assessed as described for EPIC-Potsdam. Since the outcome’s incidence in the study population has a strong influence on model calibration, we recalibrated the clinical GDRS to the incidence in the GNHIES98 cohort as described by Kengne et al.33 34

With PClinicalGDRS estimated from the derived equation for the clinical GDRS for each individual and with α as a correction factor calculated from the following equation:

Where 0.0226 is equivalent to the 5-year diabetes incidence in the GNHIES98 cohort as estimated from Kaplan-Meier methods and 0.0347368 is equivalent to the mean estimated 5-year diabetes risk from the clinical GDRS.
In both EPIC-Potsdam and GNHIES98 cohort, all statistical analyses were performed with SAS (V.9.4). The imputation was performed with the SAS procedures PROC MI under usage of the fully conditional specification methods (Fully conditional specification statement) and PROC MIANALYZE for combining the MI estimates. In EPIC-Potsdam, the C-index was computed with the SAS code published by Liu et al,35 and the NRI was computed using parts of a published SAS macro %nriidi by Lars Berglund36 and adaptation to MI.
Results
The baseline characteristics of the EPIC-Potsdam and GNHIES98 cohort populations are presented in table 1. Participants of EPIC-Potsdam were mainly in the age range of 35–65 years and therefore on average older than participants from the GNHIES98 cohort with an age range of 18–79 years. Participants of EPIC-Potsdam also had a lower waist circumference, were more physically active, more likely to have had a diagnosis of hypertension, more likely to be former rather than current smokers and less likely to have a positive family history with one affected parent when compared with participants from the GNHIES98 cohort. Still, the two study populations showed similar GDRS points and 5-year diabetes risk.
Baseline characteristics for participants of the EPIC-Potsdam and the GNHIES98 cohort
The results from Cox regression to derive the clinical GDRS are shown in table 2. The HR for an increment of 1 point in the original GDRS score was 1.009 (95% CI 1.008 to 1.009), and the allocated score points in the clinical GDRS based on the beta-coefficient were accordingly 0.9 per point of the original GDRS. HbA1c was a strong independent risk factor, with an HR of 1.893 (95% CI 1.754 to 2.044) per unit (% points); allocated points in the clinical GDRS score were 63.8 per unit. Score points for the clinical GDRS can thus be calculated using the following equation:
Parameter estimates, HR and allocated points in the clinical GDRS

The baseline survival function from Cox regression was 0.99035, and the mean score point observed in the EPIC-Potsdam study population was 784.13834152. Using this information, the calculation of absolute 5-year risk for developing diabetes with the clinical GDRS is based on the following equation:

We next evaluated the prognostic performance of the clinical GDRS based on the absolute 5-year risks in EPIC-Potsdam. The C-index (95% CI) for the clinical GDRS was 0.87 (0.81 to 0.92), larger than the C-index for the original GDRS (0.83, 0.81 t 0.84). Overall NRI was 0.26 (0.21 to 0.30) with a stronger improvement for the cases compared with the non-cases (NRIcases: 0.24 (0.19 to 0.28); NRInon-cases: 0.02 (0.01 to 0.02)). The C-index in the GNHIES98 cohort was generally higher, with 0.87 (0.84 to 0.90) for the original GDRS and 0.91 (0.88 to 0.94) for the clinical GDRS, respectively; however the increase in discrimination was of similar magnitude (table 3). According to cut-offs of 2%, 5% and 10% absolute 5-year risk (or 838, 932 and 1004 clinical GDRS points, respectively), sensitivity was 0.88, 0.63 and 0.41, while specificity was 0.73, 0.90 and 0.97 in EPIC-Potsdam (table 4). The negative predictive value (NPV) was 1, 0.99 and 0.99, while the positive predictive value (PPV) was 0.07, 0.14 and 0.23 for the aforementioned risk cut-offs. In the GNHIES98 cohort, sensitivity was generally higher while specificity was generally lower for the respective cut-offs. NPV was similar to EPIC-Potsdam, whereas PPV was slightly lower for the three predefined cut-offs of the 5-year diabetes risk (table 4).
Discrimination and reclassification of the original GDRS and the clinical GDRS in the EPIC-Potsdam and GNHIES98 cohort
Se, Sp, PPV, and NPV for selected cut-offs of predicted risk in the EPIC-Potsdam and GNHIES98 cohort
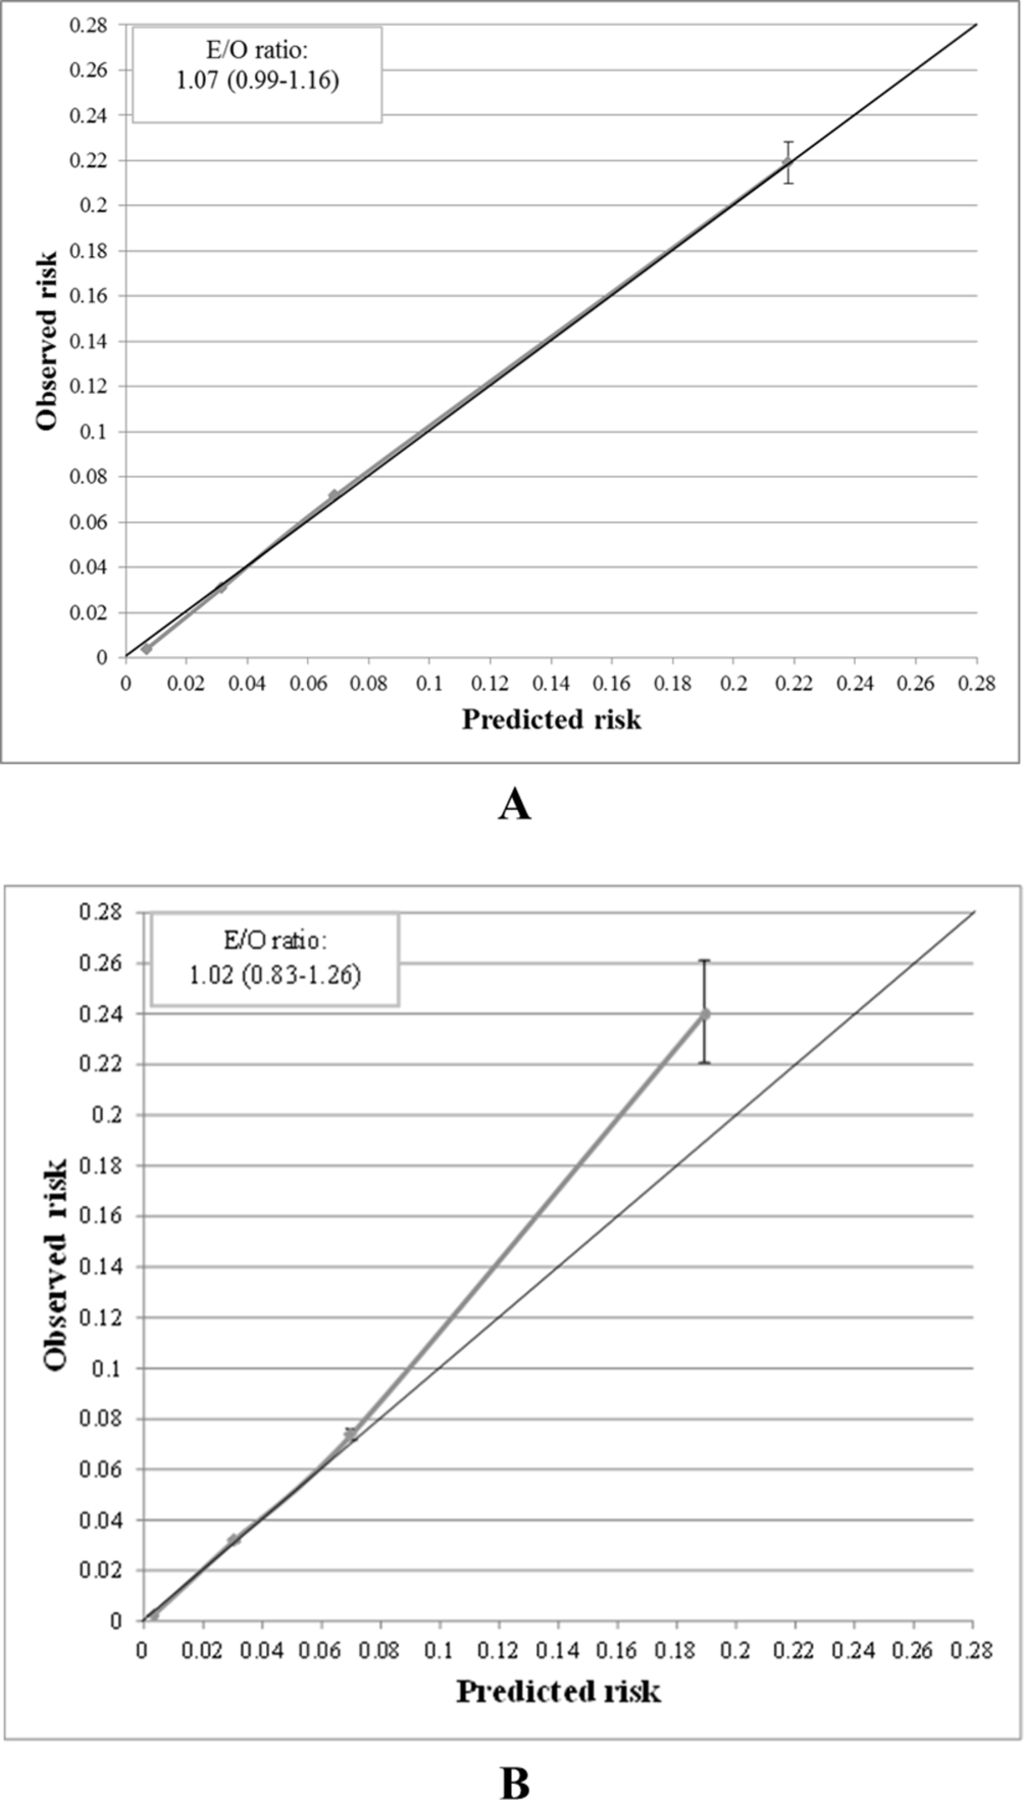
The mean predicted risk was in agreement with the observed 5-year incidence in EPIC-Potsdam (2.5% vs 2.3%), indicating excellent overall calibration. More specifically, the calibration plot (figure 1A) showed almost perfect agreement between observed and predicted risks for the four predefined risk groups in the EPIC-Potsdam study, with a slight tendency toward overestimation in the two lower risk groups also reflected by an E:O ratio of 1.07 (0.99 to 1.16).
Calibration plots for the clinical GDRS in the EPIC-Potsdam study (A) and the GNHIES98 cohort (B). Predicted risks were determined using score points, mean score points and the baseline survival as derived from EPIC-Potsdam. Predicted risks were plotted against observed risks in four predefined risk groups (low risk: <2%, still low risk: 2 to <5%, increased risk: 5 to <10%, high or very high risk ≥10% 5-year risk). Expected-to-observed (E/O) ratios were calculated as expected number of cases (as mean predicted risk multiplied with the overall sample size) divided by observed number of cases; 95% confidence intervals were determined assuming a Poisson variance. For calibration in the GNHIES98 cohort, the clinical GDRS was recalibrated to account for differences in diabetes incidence between the GNHIES98 cohort and EPIC-Potsdam.
Before recalibration, calibration-in-the-large for the validation cohort showed generally an overestimation when comparing the mean predicted risk of 3.5% with the observed 5-year incidence of 2.3%. This was also reflected by the calibration plot and an E:O ratio of 1.51 (1.22 to 1.87) (online supplementary figure 1). When restricted to the age range of EPIC-Potsdam, the E:O ratio in the GNHIES98 cohort was 1.34 (1.06 to 1.69) (data not shown). After recalibration, the mean predicted risk was 2.4%, and the E:O ratio of 1.02 (0.83 to 1.26) indicated perfect agreement between observed and predicted risk. The calibration plot showed perfect calibration for the two lower risk groups, whereas underestimation was evident particularly in the highest risk group (figure 1B).
Discussion
In this study, we extended the original non-invasive version of the GDRS by HbA1c to establish a clinical version of the GDRS. In EPIC-Potsdam, that is, the derivation cohort, inclusion of HbA1c in the original GDRS improved the accuracy of diabetes risk prediction. The clinical GDRS yielded excellent discrimination and showed good calibration. In the external validation cohort, a nationwide sample from the German adult population, the clinical GDRS again showed excellent discrimination and convincing calibration.
Main findings
Inclusion of HbA1c into the non-invasive version of the GDRS10 22 improved prediction of incident diagnosed diabetes in EPIC-Potsdam. An improved prediction for the clinical GDRS as compared with the non-invasive GDRS was also found in the GNHIES98 cohort. Our findings are in accordance with previous studies where risk scores based on solely non-invasively measured risk factors were extended by HbA1c.37–39 These extended risk scores reached a discrimination ranging from a C-Index of 0.76 for a risk score including age, sex, body mass index, waist circumference and HbA1c to 0.83 for a risk score including age, sex, diabetes of parents, hypertension, waist circumference, smoking, alcohol consumption, physical activity, and HbA1c.37 As opposed to the clinical GDRS, none of these previous risk scores have been externally validated, although strongly recommended before their application in clinical practice.40 41
With regard to calibration, the clinical GDRS showed perfect calibration in all predefined risk groups in EPIC-Potsdam. Only in the two lower risk groups diabetes risk was slightly overestimated; however, generally calibration was excellent as indicated with the E:O ratio of 1.07 (0.99 to 1.16). In contrast, without recalibration the clinical GDRS overestimated diabetes risk for all risk groups in the GNHIES98 cohort with an increasing tendency for increasing diabetes risk. This general overestimation was further reflected by an E:O ratio of 1.51 (1.22 to 1.87). An overestimation of diabetes risk particularly in the highest risk group was also observed in previous validation studies of the original GDRS.10 12 33 42 43 For example, in a regional German cohort study including adults aged 45–83 years, the E:O ratio in the highest group of predicted diabetes risk was 3.32, whereas it was 1.65 in the lowest group.43 Also in the EPIC-InterAct study, the E:O ratio of the original GDRS before recalibration indicated an overestimation of diabetes risk after 5 years of follow-up (E:O ratio: 1.78 (1.41 to 2.16)). For a less satisfying model performance in the validation study as compared with the original study, recalibration of the model is one suggested approach.34 41 Following this suggestion, recalibration of the original GDRS strongly improved its calibration (E:O ratio: 1.01 (0.98 to 1.03)) in a previous validation study.33 This could also be observed for other diabetes risk scores such as Finnish Diabetes Risk Score(FINDRISK) or Framingham33 and is in accordance with our findings for the GNHIES98 cohort.
Implications
Diabetes risk scores may be applied in the clinical context to assess individual diabetes risk and thereby identify individuals with a high risk for future diabetes.44 Since blood parameters such as HbA1c have been shown to improve predictive performance of risk scores13 and are generally available in the clinical setting in Germany, the application of the clinical GDRS in the clinical context seems reasonable.
However, compared with the application of other clinical risk scores, the main advantage of our approach of extending the original GDRS by HbA1c is that the original GDRS can be still applied in a first step. This is of particular importance as it has been shown that a preceding non-invasive risk assessment increases the acceptance of following blood tests.7 As a consequence, our approach broadens the field of application of the GDRS to use a more precise model in the clinical setting by still retaining the original GDRS. This is important, since the original GDRS includes modifiable risk factors which have great potential for prevention targets by the practitioner. Furthermore, including HbA1c in the GDRS might increase its acceptance among physicians and thus increase its application in the clinical setting in Germany. Still, the original GDRS is maintained and can be applied to assess individual diabetes risk among the general population or in clinical settings without requiring any further blood testing.
Limitations
Certain limitations need to be taken into account when interpreting the results of this study. In EPIC-Potsdam, HbA1c was measured in a case-cohort study nested within the EPIC-Potsdam cohort, and therefore a high proportion of missing values occurred for a full cohort analysis (Table S1). However, with MI we applied the most accurate available approach for dealing with missing values from a case-cohort design especially when calculating absolute risks and providing a scoring algorithm.14 Furthermore, measurements of HbA1c were generally too high for a healthy population. Therefore, we corrected these values by using representative German survey data. In addition, we did not calculate new coefficients for the non-invasively measurable risk factors of the clinical version of the GDRS but used the original coefficients to derive the score points. Nevertheless, model performance was almost identical between the two approaches and we preferred the presented algorithm for easier application in clinical practice by retaining the original GDRS as an established tool for diabetes risk prediction. Finally, we observed differences in the age distributions of the derivation and validation cohorts; however, to correct for study differences we applied recalibration. Moreover, a previous validation study of the original GDRS in GNHIES98 showed only a slight difference in discrimination when restricting the validation cohort to the age range of EPIC-Potsdam.12 Overall, for Germany validity was confirmed by evaluating model performance in German-wide cohort data and through recalibration of the clinical GDRS for application.
As opposed to EPIC-Potsdam, validation through the treating physician of self-reported diabetes diagnosis was not feasible in the GNHIES98 cohort. Besides, information on history of diabetes in siblings was not available. Therefore, the prevalence of a history of diabetes in siblings from EPIC-Potsdam had to be applied as constant. Due to the resulting lack of variance in this GDRS component, the performance of the clinical GDRS might have been underestimated in the GNHIES98 cohort.10 In addition, there were differences in the assessment of some GDRS components such as dietary intake and physical activity between the derivation and validation cohorts. Finally, the follow-up rate was only moderate in the GNHIES98 cohort; however, we applied a weighting factor to account for the incomplete follow-up.
Conclusion
Extension of an already precise and valid diabetes risk score, which was originally based on only non-invasively measured risk factors, by HbA1c further improved its predictive performance. Its validity was externally confirmed by nationwide data and recalibration was applied to obtain a nationwide well-calibrated model. With the clinical GDRS we broaden the field of application of the GDRS by providing the opportunity to apply the original GDRS as a first step in risk assessment, which can then be extended in clinical practice with HbA1c whenever it was measured. Hereby physicians may get an impression on the patient’s actual lifestyle and formulate potential recommendations; with additionally assessing HbA1c, the patient’s risk profile can then be evaluated from a more detailed perspective.
Acknowledgments
We thank the Human Study Centre (HSC) of the German Institute of Human Nutrition Potsdam-Rehbrücke, namely the trustee and the data hub for the processing, and the participants for the provision of the data, the biobank for the processing of the biological samples and the head of the HSC, Manuela Bergmann, for the contribution to the study design and leading the underlying processes of data generation.
References
Footnotes
KMüh and RP are joint first authors.
CH and MBS are joint last authors.
Presented at Workshop of the German Society of Epidemiology (DGEpi) “Prädiktionsmodelle für kardiometabolische Erkrankungen unter besonderer Berücksichtigung von Ernährungs- und Lebensstilfaktoren”: preliminary results in an invited presentation (28.11.2016, Berlin).
Contributors MBS and CH conceptualized the study. KM and RP defined the analytical strategy, analyzed the data and wrote the manuscript. HB was responsible for data collection of the EPIC-Potsdam study. H-GJ, MBS and CH contributed to the interpretation of the data and critically revised the manuscript. All authors approved the final version of the manuscript.
Funding This work was supported in part by a grant from the German Federal Ministry of Education and Research (BMBF) to the German Center for Diabetes Research (DZD e.V.). The recruitment phase of the EPIC-Potsdam Study was supported by the Federal Ministry of Science, Germany (01 EA 9401) and the European Union (SOC 95201408 05F02). The follow-up of the EPIC-Potsdam Study was supported by German Cancer Aid (70-2488-Ha I) and the European Community (SOC 98200769 05F02). Both GNHIES98 and DEGS1 were funded by the German Federal Ministry of Health.
Competing interests None declared.
Patient consent Not required.
Ethics approval Ethical Committee of the State of Brandenburg (EPIC-Potsdam) and Charité-Universitätsmedizin Berlin (GNHIES98 cohort).
Provenance and peer review Not commissioned; externally peer reviewed.
Data sharing statement In accordance with the German Federal and State data protection regulations, epidemiologic data analyses of EPIC-Potsdam may be conducted upon application addressed to HB (boeing@dife.de). Each application will have to pass a review process by a scientific board. The data set of the GNHIES98 cannot be made publicly available because informed consent from study participants did not cover public deposition of data. However, the minimal data set underlying the findings regarding the validation of the clinical GDRS presented in this study is archived in the ‘Health Monitoring’ Research Data Centre at the Robert Koch Institute (RKI) and can be accessed by all interested researchers. On-site access to the data set is possible at the Secure Data Center of the RKI’s ‘Health Monitoring’ Research Data Centre. Requests should be submitted to fdz@rki.de.