Article Text

Abstract
Objective We constructed a predictive model of long-term risk for severe hypoglycemia (SH: hypoglycemia requiring assistance) in patients with type 2 diabetes (T2DM).
Research design and methods Data from the Action to Control Cardiovascular Risk in Diabetes (ACCORD) study (original n=10 251, n=5135 used in the current analysis), a randomized, multicenter, double 2×2 factorial design study examining the effect of glycemic, blood pressure, and lipid control on cardiovascular outcomes in patients with diagnosed T2DM, were used. Over the follow-up (3.76±1.12 years), the ACCORD participants experienced 607 incident SH events. Cox regression was used to identify the SH risk prediction model.
Results We identified 17 predictors—glycemic management, age, race, education, waist circumference, medications (insulin, antihypertensive, HMG-CoA reductase inhibitors, sulfonylurea, biguanide and meglitinide), years since diabetes diagnosis, history of hypoglycemia in the last week, systolic blood pressure, diastolic blood pressure, serum creatinine, and urinary albumin creatinine ratio—to construct a prediction model for SH (c-statistic=0.782). Using this information, we derived point scores to estimate the 5-year risk for SH in individual patients with T2DM. After adjusting for other variables in the model, the three strongest predictors for SH over 5 years were intensive glycemic management (HR=2.37, 95% CI 1.99 to 2.83), insulin use (HR=2.14, 95% CI 1.77 to 2.59), and antihypertensive medication use (HR=1.90, 95% CI 1.26 to 2.86).
Conclusion Using the ACCORD data, we identified attributes to predict 5-year risk of SH in patients with T2DM, which warrant evaluation in broader populations to determine applicability.
- Hypoglycemia
- Prediction
- Type 2 Diabetes
This is an Open Access article distributed in accordance with the Creative Commons Attribution Non Commercial (CC BY-NC 4.0) license, which permits others to distribute, remix, adapt, build upon this work non-commercially, and license their derivative works on different terms, provided the original work is properly cited and the use is non-commercial. See: http://creativecommons.org/licenses/by-nc/4.0/
Statistics from Altmetric.com
Significance of this study
What is already known about this subject?
Risk factors for serious or severe hypoglycemia in patients with type 2 diabetes (T2DM) are well described.
Models exist to predict hypoglycemia over a short-term (2–12 months) follow-up.
What are the new findings?
We used data from the Action to Control Cardiovascular Risk in Diabetes study, a clinical trial in patients with T2DM with severe hypoglycemia as an adjudicated measure, to establish a prediction model and risk score for severe hypoglycemia over a long-term (5-year) follow-up.
How might these results change the focus of research or clinical practice?
In T2DM, the ability to identify a patient’s long-term risk for hypoglycemia can enhance clinical trial recruitment to the relevant population and guide clinical practice by personalizing glycemic goals.
Type 2 diabetes (T2DM) and its associated complications are a significant public health issue. More than 20 million Americans have T2DM.1 Intensive glucose control to lower hemoglobin A1C (HbA1c) to near-normal levels has many benefits in patients with diabetes, including reduction in microvascular disease2–4 and possibly macrovascular events.3 5 Yet achieving this target safely while minimizing hypoglycemia remains challenging. The current practice is to determine the appropriate A1c target for each patient based on age and comorbidities, and then subjectively develop a treatment strategy that best achieves target A1c with the lowest risk of hypoglycemia.6
Hypoglycemia can limit the ability to achieve near-normal HbA1c in patients treated with insulin or sulfonylurea. These events range from mild events easily treated by the patient, to severe hypoglycemia (SH) where the patient requires the assistance of another person to provide treatment for low blood glucose. Since intensification of glycemic treatment has been repeatedly linked to an increased rate of hypoglycemia,2 7–9 many have suggested that relaxing glycemic control will reduce hypoglycemic events.
Hypoglycemia is a devastating complication of glycemic treatment with direct patient impact. In patients with diabetes, fear of hypoglycemia is associated with a history of hypoglycemia.10 In patients with T2DM treated with oral agents, self-reported hypoglycemia occurred in 63% within the previous 6 months, with hypoglycemia severity and frequency associated with lower quality of life.11 SH is associated with increased emergency room visits.12 SH was also initially presumed to be associated with higher rates of mortality, as suggested by the data from the Action to Control Cardiovascular Risk in Diabetes (ACCORD) study, which was stopped early (median 3.7 years) due to higher mortality rates in the intensively treated group (HR=1.22, 95% CI 1.01 to 1.46) than the standard treatment group.13 However, further analysis of the ACCORD data did not show a link between SH and mortality,14 as intensively treated participants who experienced SH had a lower risk of mortality than standard treatment participants who experienced SH (adjusted HR=0.55, 95% CI 0.31 to 0.99).14 Other studies on patients with T2DM reported higher hypoglycemia rates with intensification of glycemic treatment,2 7 9 with either unchanged7 9 or lower mortality rates.2
Currently, we lack a systematic method to predict the long-term SH risk in patients with T2DM. Many clinical risk factors for hypoglycemia have been described, including older age, diabetes duration, burden of comorbidities, glycemic treatment intensification, current insulin treatment, and duration of insulin treatment.8 15–19 In T2DM, increased risk for hypoglycemia is generally associated with intensification of glycemic treatment2 7–9 and low mean blood glucose.20 Interestingly, a low HbA1c is not a clear risk factor for hypoglycemia, as hypoglycemia has been observed across all levels of glycemic control in T2DM.19 21 22
Previous models predicting short-term (2–12 months) hypoglycemia are available.20 23–26 However, several limitations are notable. Many of these studies included patients with type 1 diabetes23–25; therefore, applicability to T2DM remains limited. These studies relied on hypoglycemic events identified on electronic health records (EHRs) using previously validated International Classification of Diseases, Ninth Revision codes,25 26 or relied on participants’ self-monitored blood glucose.20 23 24 Both processes depend on patient engagement and may miss hypoglycemia events if the patient has impaired awareness of hypoglycemia or inconsistently documents hypoglycemia. In contrast, deriving a hypoglycemia prediction model from a clinical trial, which has structured, adjudicated outcomes, mitigates this concern about missing data.
This project extends earlier findings from ACCORD. Previously, investigators from the ACCORD study reported higher risk for hypoglycemia with intensive glycemic treatment, age, sex, race, educational level, insulin use, duration of diabetes, body mass index (BMI), peripheral neuropathy, albuminuria, serum creatinine, and higher HbA1c.8 For the clinician, however, the relevance of risk factors is better appreciated when incorporated into a prediction model. Therefore, this project leveraged data from the ACCORD study to construct a translatable predictive model to estimate long-term (5-year) SH risk in patients with T2DM.
Research design and methods
The ACCORD study
The ACCORD study was a randomized, multicenter, double 2×2 factorial design study examining the effects of glycemic control (intensive vs standard), blood pressure control and lipid control on cardiovascular (CV) morbidity and mortality in patients with diagnosed T2DM.27 28
Participants were screened for eligibility by history and physical exam. Participants had a clinical diagnosis of T2DM, defined using the 1997 American Diabetes Association (ADA) criteria, and a stable diabetes treatment program for at least 3 months. Participants with self-reported or previously diagnosed type 1 diabetes, secondary causes of diabetes, or gestational diabetes were excluded. The study enrolled 10 251 participants with long-standing T2DM with either diagnosed CV disease or at least two CV risk factors in addition to diabetes. All participants were randomized to standard glycemic treatment (HbA1c target 7.0%–7.9% (53–63 mmol/mol)) or intensive glycemic treatment (HbA1c target <6.0% (42 mmol/mol)). Partway through the study (median follow-up: 3.7 years), participants receiving intensive treatment were transitioned to standard treatment due to higher mortality in the intensive treatment group.29
Deidentified data from the ACCORD study was obtained from Biologic Specimen and Data Repository (BioLINCC) (https://biolincc.nhlbi.nih.gov/).
Primary outcome
The primary outcome of this analysis was SH. Self-reported hypoglycemia events were assessed by the ACCORD staff at each visit. SH was defined as an episode of hypoglycemia requiring medical assistance and either blood glucose less than 2.8 mmol/L or requiring the administration of glucose. For these analyses, only the incident case of SH was used for patients with more than one event over follow-up. Patients in the intensive-therapy group attended monthly visits for the first 4 months and then every 2 months thereafter, with at least one interim phone call and additional visits as needed. Patients in the standard-therapy group had visits every 2–4 months.27 28
Candidate risk factors
Potential SH risk factors were identified from current literature8 15–19 for selection of relevant baseline ACCORD measurements. These risk factors included intensive glycemic management (ACCORD study treatment), sex, race, age, education, cigarette and alcohol use, BMI, waist circumference, systolic and diastolic blood pressure (SBP and DBP), total cholesterol, serum creatinine, globular filtration rate, urinary albumin creatinine ratio (UACR), HbA1c, medication use (insulin, sulfonylurea, biguanide, meglitinide, HMG-CoA reductase inhibitors, antihypertensive medication), existing CV disease, family history of CV disease, time since diagnosis of T2DM, and history of hypoglycemia in the last week. Detailed descriptions of these variables are in online supplementary table 1.
Supplemental material
Model derivation
The characteristics of study participants with and without SH events were compared prior to the development of the risk prediction model. Descriptive statistics were calculated for the entire cohort as well as separately for those who did and did not experience an event. Means and SDs were calculated for continuous variables; if not normally distributed, medians and IQRs were calculated. Counts and percentages were calculated for categorical variables. χ2 and t-tests, for categorical and continuous variables, respectively, were used to compare the characteristics of participants who did and did not experience SH events.
Data were limited to the ACCORD study population with 5 years or less of follow-up (n=5590) for the development of the SH prediction model. Models were conducted as complete case analyses. Potential risk factors were assessed using Cox regression models and stepwise selection with p=0.05 for inclusion. Once a final set of variables was identified, continuous variables were assessed as both continuous and categorical predictors. Categorical variables were collapsed if appropriate. The final set of variables was included in the multivariable adjusted model, with missing values for covariates excluded (n=5135 final sample size). The c-statistic was used to assess the discriminatory ability of the model. The proportional hazard assumption was assessed and was not violated for the majority of the variables; those with violation showed no consistent pattern. Therefore, we ran all models without this adjustment.
Model validation
The predictive ability of the final model was validated internally using fivefold validation with a simple random sampling approach. The cohort was randomly divided into five approximately equal subsections (n~1000/subsection). Each subset was used once as the testing set and as part of the training set for the other four trials. This fivefold validation method was repeated five times using different random divisions of the data. The 25 total model c-statistics were averaged and generated c-statistics in the range of 0.782–0.795, in line with the final model c-statistic of 0.782.
Point score development
Point scores were created from the final Cox regression model to improve the utility of the predictive model for clinical application. Using the final variables, a point score was constructed using methods previously published by Sullivan et al.30 Briefly, continuous variables were split into categories and a reference group was identified for all variables. The differences between the two or more levels of each variable and the reference group were calculated. Reference groups were selected to create point scores such that the lowest values for continuous variables and the absence of a variable (stating ‘no’ to using a medication); positive parameter estimates generated a reference point score of 0 using this modeling approach, while negative parameter estimates in the Cox model produced negative point scores compared with the reference group. Values were standardized to baseline age and 5 years of follow-up, with point values for each level of a variable calculated using the adjusted parameter estimates from the final prediction model. Minimum and maximum point totals were calculated, and the predicted risk versus the point scores was plotted.
All statistical analyses were conducted in SAS V.9.4.
Results
Baseline characteristics
Table 1 presents the baseline characteristics of the study cohort (n=5135 final sample size). The ACCORD participants were on average 62.8 years old (±6.8 years) at baseline. Of those eligible for this study, 37.2% were female, 19.6% were black, 24.8% completed college, and 84.8% had health insurance. There were 607 incident SH events (13.4%) over an average of 3.76 years (±1.1 year) out of the 5135 eligible participants. At the time of enrollment, participants had been diagnosed with T2DM for 11 (±7.7 years) years on average. CV disease was common among the ACCORD participants, with 36.9% reporting a personal history of CV disease.
Baseline characteristics of the ACCORD study participants
In this study, participants who experienced at least one episode of SH tended to be roughly 2 years older than participants who did not experience SH (p<0.0001). There was a higher proportion of women who experienced SH (40.9%) than among those who did not (36.8%, p=0.0493). Compared with participants who described themselves as white, Hispanic or other, black participants were more likely to have an SH event (p<0.0001). Participants who had an SH event were less likely to have completed college than those who did not have an SH event (p<0.0001).
Participants randomized to intensive glycemic management were more likely to experience SH compared with participants randomized to the standard glycemic management (p<0.0001). In addition to the previously observed association in ACCORD between insulin use and SH events,8 we found that participants who experienced SH had significantly higher use of medications for blood pressure and meglitinide, but lower proportions used biguanide and sulfonylurea, and no difference in HMG-CoA reductase inhibitors use. Compared with individuals who did not experience SH, those who did had been diagnosed with T2DM 4 years earlier on average (p<0.0001). Participants who had an SH event had lower BMI and smaller waist circumference than participants who did not experience SH (p=0.0169 and 0.0044, respectively). These participants also had, on average, higher SBP and lower DBP compared with individuals who did not have an SH event (both p<0.0001). Compared with those who did not have an SH event, participants who had at least one SH had higher serum creatinine, higher UACR, and higher HbA1c values, but the total cholesterol levels did not differ (table 1).
Model derivation
Starting with 41 potential risk factors, the stepwise selection models eliminated 24 variables, including cigarette and alcohol use, BMI, total cholesterol, baseline CV disease, family history, insurance, and most categories of medication. Despite being forced into the initial stepwise selection model, sex was not a significant predictor of SH and was dropped from the model. Serum creatinine and UACR both remained in the model after stepwise selection and were retained. Education was collapsed into those with and without college education based on the distribution of education in the study population. Race categories were collapsed into black or other racial groups defined as white, Hispanic, or others due to small numbers of participants in the latter two groups. Continuous SBP and DBP as well as use of antihypertensive medications were independent predictors of incident SH, representing both level and control of blood pressure.
The list of potential predictors of SH was reduced to 17 variables, providing the best balance between predictive ability and fewest variables. The final model for the prediction of SH included intensive glycemic management, age, race, education, insulin use, antihypertensive medication use, years since diabetes diagnosis, history of hypoglycemia in the last week, SBP, DBP, waist circumference, serum creatinine and UACR, HMG-CoA reductase inhibitors, and non-insulin diabetes medications (sulfonylurea, biguanide, and meglitinide). The c-statistic for the final Cox regression model was 0.782.
Risk prediction model
The two variables with the largest amount of missing data were UACR (4.5%) and family history of heart disease (4.2%). After running the stepwise selection Cox regression models and identifying statistically significant predictors of incident SH, the models were rerun with these variables and the missing values removed (n=5135 used in final analysis). Unadjusted and adjusted HRs for the 17 variables in the prediction model are reported in table 2. After adjusting for the other variables in the prediction model, the three variables associated with the greatest risk of SH were intensive glycemic management (HR=2.372, 95% CI 1.985 to 2.833), insulin use (HR=2.138, 95% CI 1.765 to 2.59), and antihypertensive medication use (HR=1.90, 95% CI 1.263 to 2.856). Higher waist circumference was associated with a lower risk of incident SH in both unadjusted and adjusted models (HR=0.895 and HR=0.876, respectively). Higher SBP and lower DBP were also associated with higher hazards of SH (adjusted HR=1.175, 95% CI 1.066 to 1.295 and adjusted HR=0.817, 95% CI 0.735 to 0.907, respectively). SH rates were positively associated with age (adjusted HR=1.134, 95% CI 1.038 to 1.238) and time since diagnosis (adjusted HR=1.125, 95% CI 1.037 to 1.22). Lower educational attainment was associated with greater risk (adjusted HR=1.314 95% CI 1.070 to 1.614). Medications associated with hypoglycemia were both positively (meglitinide, insulin) and inversely (sulfonylurea, biguanide) associated with risk of SH (table 2).
HR for severe hypoglycemia events in the ACCORD study
Point score
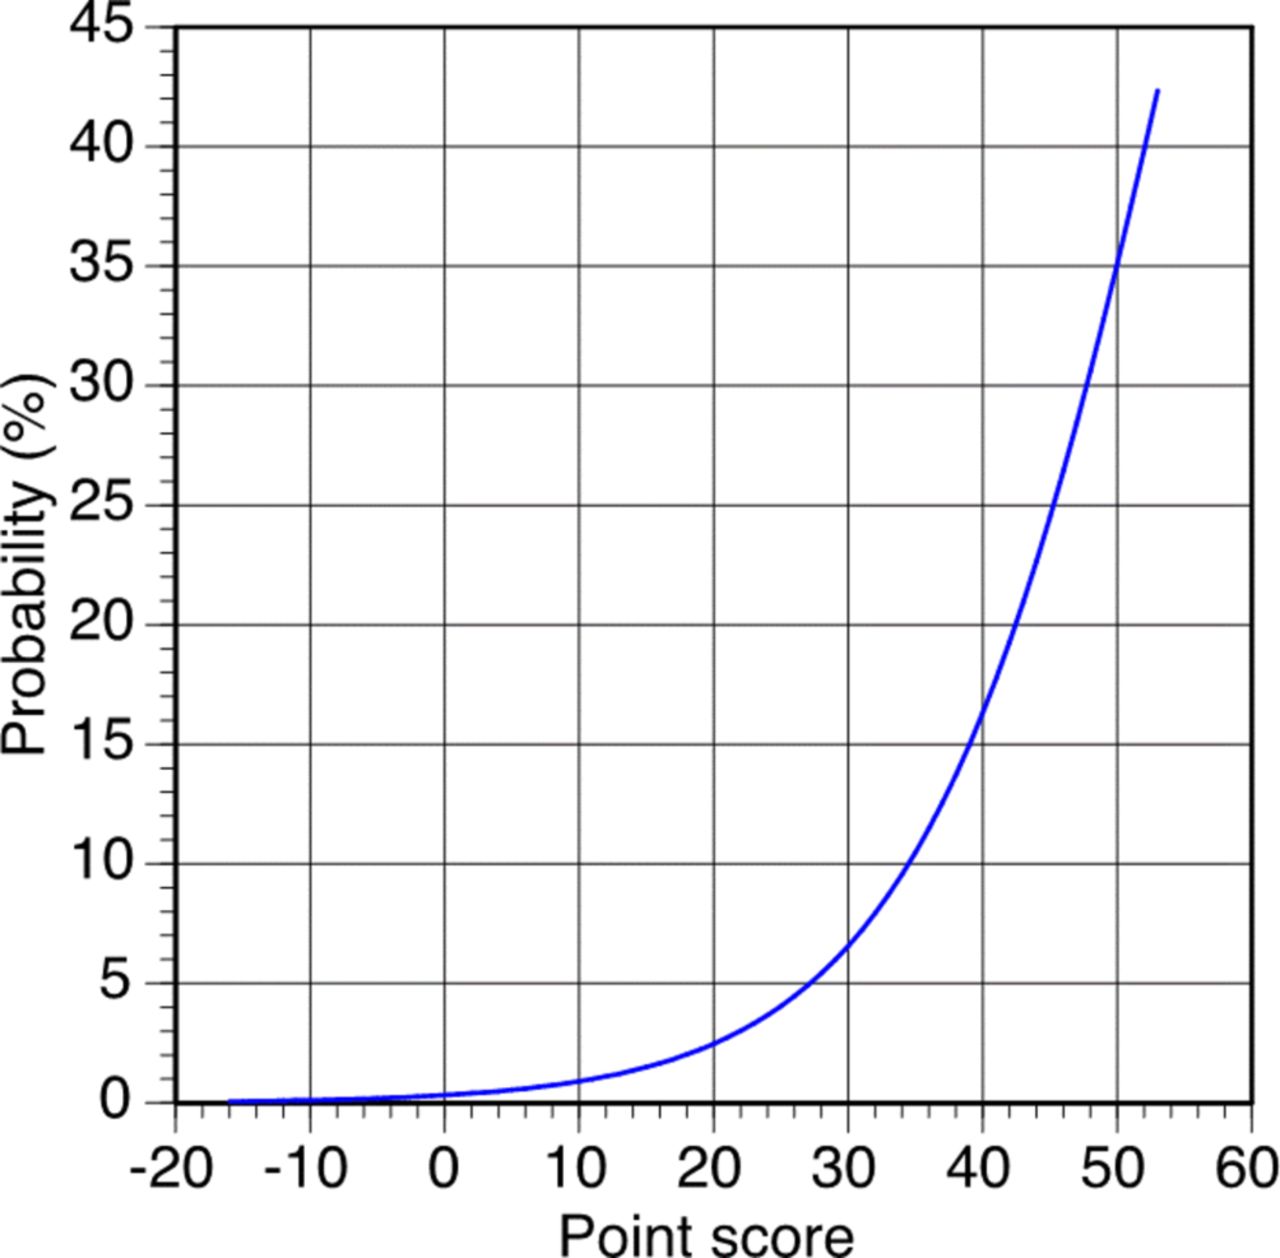
Point scores were created directly from the Cox regression model to improve the utility of the predictive model. Possible risk point scores ranged from −16 to 53 and corresponded to predicted 5-year risk of SH that ranged from 0.06% to 42.4%. Point scores were derived by summing the point values for each risk factor (table 3) and matching the score with the corresponding 5-year risk (figure 1).

Five-year severe hypoglycemia risk based on point score.
Cox regression point scores for 5-year risk of severe hypoglycemia
Case studies in point score usage
Case 1
A 70-year-old (5 points) black (4 points) woman with a college education (0 point) is receiving intensive glycemic management (9 points) with insulin (8 points). She was diagnosed with diabetes approximately 10 years before her baseline visit (1 point). She had a hypoglycemic episode within the week of her visit (4 points). Her waist circumference is 30 inches or 76.2 cm (0 point). She is not taking antihypertensive medication (0 point); her measured SBP is 120 mm Hg (0 point) and DBP is 75 mm Hg (−2 points). She is not using meglitinide (0 point) or biguanide (0 point), but she is taking an HMG-CoA reductase inhibitor (−2 points) and using sulfonylurea (−4 points). Her UACR falls in a favorable range (0 point), but her serum creatinine is above the median for the sample (2 points). Her total score is 25, which translates to a 5-year risk for SH of 4.1%.
Case 2
A 50-year-old (2 points) Hispanic (0 point) man did not complete high school (3 points) and is following standard glycemic management (0 point) without the use of insulin (0 point) or biguanide (0 point); however, he is using meglitinide (3 points) and sulfonylurea (−4 points). He was diagnosed with T2DM 16 years before his baseline visit (2 points). He experienced an episode of hypoglycemia in the week before his visit (4 points). He is currently taking antihypertensive medication (7 points). His measured SBP is 135 mm Hg (2 points) and DBP is 75 mm Hg (−2 points). His kidney values were normal. He has a total point score of 17, which corresponds to a 5-year risk of SH of 1.8%.
Conclusions
The goal of this paper was to establish a novel prediction model for 5-year risk of SH in an individual patient with T2DM. We established a prediction model (c-statistic: 0.782) with Cox regression using 17 variables. Additionally, we translated this model into a usable point score for clinical application. By estimating the long-term SH risk for an individual with T2DM, these findings, after further validation with future studies, may provide additional critical information that could change clinical practice.
Our findings extend the current literature. Previous predictive models focused on short-term (2–12 months) hypoglycemia.20 23–26 Schroeder et al 25 used EHR to develop a hypoglycemia risk model for 6-month risk of hypoglycemia requiring medical intervention in patients with type 1 diabetes and T2DM.Two prediction models were constructed, consisting of either 16 variables (c-statistic of 0.84) or 6 variables (c-statistic of 0.81), which maintained good predictability in the validation cohort. The 6-variable model included age, diabetes type, HbA1c, estimated glomerular filtration rate, history of a hypoglycemic event in the prior year, and insulin use.25 Karter et al focused on patients with T2DM and used the EHR to identify a hypoglycemia risk stratification tool using six variables: number of episodes of hypoglycemia-related utilization, insulin use, sulfonylurea use, prior year emergency room use, kidney disease, and age (c-statistic of 0.83).26 However, these models have several limitations. These studies included patients with type 1 diabetes,23–25 extracted hypoglycemic events from EHR25 26 or relied on participants’ self-monitored blood glucose.20 23 24 In contrast, our study focused on patients with T2DM and relied on the rigor of the ACCORD clinical trial, which had well-defined measures of risk factors and standardized assessment of hypoglycemia.
Our analysis identified risk factors similar to these previous models, including prior episode of hypoglycemia, insulin use, age, and renal function, with several areas of distinction. In comparison with the Schroeder et al work,25 our predictive model focused exclusively on patients with T2DM. Our model was developed using a large clinical trial with established follow-up and adjudicated outcomes. Our predictive model estimates long-term risk (5 years) rather than short-term risk (2–12 months)25 26 with a fair c-statistic (0.782).
Our findings demonstrate that certain baseline clinical features (table 3) enhance the long-term risk for SH. Many of these findings were similar to a previous ACCORD analysis,8 although we did not identify the previously reported association with peripheral neuropathy. In the current study, we additionally identified the baseline use of sulfonylureas, biguanides and HMG-CoA reductase inhibitors associated with lower long-term risk for SH. The discrepancy between the current and previous analyses8 may be due to the sample size (n=10 251 in the previous analysis, n=5135 in the current analysis), although the overall themes remain similar. The lower long-term risk for SH associated with baseline sulfonylurea use was unexpected, although this may actually reflect non-insulin-dependent diabetes, which has more preserved insulin secretion and counter-regulatory response to hypoglycemia than insulin-dependent diabetes.31 The mechanism associating baseline HMG-CoA reductase inhibitors use with lower long-term risk for SH remains unclear and would warrant further investigation.
The current glycemic goal for most patients with T2DM treatment is HbA1c≤7.0% (53 mmol/mol)6 based on the current practice of subjectively assessing patients’ comorbidities including hypoglycemia risk.32 This practice is imprecise. A need for a more nuanced approach to estimating an individual’s risk for SH remains. Avoiding hypoglycemia by selecting medications that minimize hypoglycemia is a possibility. However, the effectiveness of this approach is often limited by cost, side effects, usage limitations, and ability to improve HbA1c.32 Prospectively identifying which patients with T2DM are at the greatest risk for SH will allow personalization of glycemic treatment and goals to optimize outcomes. For an individual patient, calculating risk scores for SH in the setting of intensive versus standard glycemic management may be informative. If the risk score is low, clinicians may consider more intensive glycemic management. Alternatively, if the risk score is high, less intensive glycemic management may be considered. The caveat, of course, is that acceptable levels of high and low risk need to be defined by further research. Our findings may also enrich patient selection for clinical trials. As an example, clinical trials with SH or SH-related outcomes may increase their outcome frequency by enrolling patients with higher SH risk scores. Ultimately, these findings warrant further study in diverse populations of patients with T2DM to address their utility.
The study has several strengths. The primary strength is the use of the ACCORD database, which has rigorously documented risk factors, defined follow-up, and adjudicated SH outcomes. We also incorporated risk factors, determined a priori to be clinically relevant, based on the literature. We acknowledge that several limitations exist which may reduce the study’s applicability. The first limitation is that the ACCORD research participants were selected for their high risk of CV events.27 Therefore, at the baseline visit, the average ACCORD patient was approximately 62 years old, with a median of 10-year duration of diabetes and HbA1c of 8.3%.13 Accordingly, the derived SH risk score must be reassessed before use in an alternate population, particularly young patients with shorter duration of disease. However, our study findings still remain relevant as the prevalence of diabetes is 21.8% (95% CI 20.0 to 23.6) in the US population ≥65 years old, and approximately 11.3% (95% CI 9.2% to 13.4%) of the US population ≥65 years old with diabetes have HbA1c>8.0.33 Another potential limitation is that the intensive glycemic control used in ACCORD may not be currently relevant, as these ACCORD participants achieved a lower HbA1c (6.7%, IQR, 6.2–7.2) after randomization, which was sustained for 6 years.13 This achieved HbA1c is lower than the current ADA recommendations of goal HbA1c≤7.0% for most adults, and ≤8.0% for adults with comorbid conditions.6 The extent to which HbA1c relates to hypoglycemia is still under debate. A previous analysis in ACCORD found that a greater drop in HbA1c between baseline and 4 months was not associated with an increased risk of hypoglycemia.8 Similarly, hypoglycemia has been observed across the range of HbA1c in patients with T2DM.19 21 22 We acknowledge that short-term risk of hypoglycemia and long-term risk of hypoglycemia may represent distinct entities. Nevertheless, our risk prediction model parallels several themes also observed with several short-term prediction models, namely history of hypoglycemia, insulin use, renal function, and age.25 26 Lastly, we acknowledge that the clinical trial setting may not reflect ‘real world’ setting. In ACCORD, 85.7% of the participants had health insurance, diabetes-related costs were covered by the study, follow-up was defined and outcomes were adjudicated. In contrast, data derived from the EHR can be inconsistent, incomplete, and inaccurate, even for the diagnosis of diabetes.34
Several ‘next steps’ will be needed prior to clinical translation of our findings. First, the identified model variables, particularly intensive glycemic control, need to be mapped into the EHR, similar to previous work which classified risk for short-term (12 months) hypoglycemia.26 Second, this model needs to be validated externally to assess the performance of the risk model and point scores across a broader population of patients with diabetes. Lastly, establishing risk score criteria derived from extensive validation in alternative clinical trials and cohorts of patients with diabetes will be necessary in determining whether glycemic management should be altered.
In summary, we have constructed a risk score to predict 5-year risk of SH in patients with T2DM. Clinician awareness of this information may supplement the decision-making process in glycemic management, potentially altering individual care.
References
Footnotes
Contributors RZ, SM, ERS, PJS, LSC designed the study. PJS, RZ, SM performed the data analysis. RZ, SM, ERS, PJS, LSC all critically reviewed the manuscript and provided intellectual content and feedback. All authors reviewed the manuscript before submission. LSC is the guarantor of the study and takes responsibility for the content of the article.
Funding The study is supported by funding from the University of Minnesota Academic Health Center. The ACCORD study was supported by contracts from the National Heart, Lung, and Blood Institute (N01-HC-95178, N01-HC-95179, N01-HC-95180, N01-HC-95181, N01-HC-95182, N01-HC-95183, N01-HC-95184, IAA-Y1-HC-9035, and IAA-Y1-HC- 1010), by other components of the National Institutes of Health—including the National Institute of Diabetes and Digestive and Kidney Diseases, the National Institute on Aging, and the National Eye Institute—by the Centers for Disease Control and Prevention, and by the General Clinical Research Centers. The following companies provided study medications, equipment, or supplies: Abbott Laboratories, Amylin Pharmaceutical, AstraZeneca, Bayer HealthCare, Closer Healthcare, GlaxoSmithKline, King Pharmaceuticals, Merck, Novartis, Novo Nordisk, Omron Healthcare, Sanofi Aventis, and Schering-Plough.
Competing interests None declared.
Patient consent Not required.
Ethics approval IRB.
Provenance and peer review Not commissioned; externally peer reviewed.
Data sharing statement This manuscript was prepared using the ACCORD Research Materials obtained from the NHLBI Biologic Specimen and Data Repository Information Coordinating Center and does not necessarily reflect the opinions or views of the ACCORD or the NHLBI. The data can be obtained directly from the NHLBI Biologic Specimen and Data Repository Information Coordinating Center.