Article Text

Abstract
Objective To identify clinical phenotypes of type 2 diabetes (T2D) among adults presenting with a first diagnosis of diabetes.
Research design and methods A total of 500 consecutive patients were subject to clinical assessment and laboratory investigations. We used data-driven cluster analysis to identify phenotypes of T2D based on clinical variables and Homeostasis Model Assessment (HOMA2) of insulin sensitivity and beta-cell function estimated from paired fasting blood glucose and specific insulin levels.
Results The cluster analysis identified three statistically different clusters: cluster 1 (high insulin resistance and high beta-cell function group), which included patients with low insulin sensitivity and high beta-cell function; cluster 2 (low insulin resistance and low beta-cell function group), which included patients with high insulin sensitivity but very low beta-cell function; and cluster 3 (high insulin resistance and low beta-cell function group), which included patients with low insulin sensitivity and low beta-cell function. Insulin sensitivity, defined as median HOMA2-S, was progressively increasing from cluster 1 (35.4) to cluster 3 (40.9), to cluster 2 (76) (p<0.001). On the contrary, beta-cell function, defined as median HOMA2-β, was progressively declining from cluster 1 (78.3) to cluster 3 (30), to cluster 2 (22.3) (p<0.001). Clinical and biomarker variables associated with insulin resistance like obesity, abdominal adiposity, fatty liver, and high serum triglycerides were mainly seen in clusters 1 and 3. The highest median hemoglobin A1c value was noted in cluster 2 (88 mmol/mol) and the lowest in cluster 1.
Conclusion Cluster analysis of newly diagnosed T2D in adults has identified three phenotypes based on clinical variables central to the development of diabetes and on specific clinical variables of each phenotype.
- type 2 diabetes
- phenotypes
- HOMA2-modeling
- clinical features
- Yemen
This is an open access article distributed in accordance with the Creative Commons Attribution Non Commercial (CC BY-NC 4.0) license, which permits others to distribute, remix, adapt, build upon this work non-commercially, and license their derivative works on different terms, provided the original work is properly cited, appropriate credit is given, any changes made indicated, and the use is non-commercial. See: http://creativecommons.org/licenses/by-nc/4.0/.
Statistics from Altmetric.com
Significance of this study
What is already known about this subject?
Type 2 diabetes (T2D) is a common chronic disease with complex etiology and high heterogeneity.
It is characterized by varying degrees of insulin resistance and insulin deficiency.
What are the new findings?
T2D can develop at two extremes, with patients having either beta-cell failure or insulin resistance.
Using data-driven cluster analysis, we identified three phenotypes of newly diagnosed diabetes in adults, based on estimation of insulin secretion and insulin sensitivity, key clinical characteristics, and biomarker measures.
We also considered early detection of microvascular disease and prediction of diabetes-related cardiovascular complications.
How might these results change the focus of research or clinical practice?
For adult patients with newly diagnosed diabetes, identifying the clinical phenotype from a single fasting blood sample using the Homeostasis Model Assessment-2 computer-based modeling, together with clinical characteristics and biomarker measures, may allow more individualized and precision medicine treatment of diabetes.
Introduction
Type 2 diabetes (T2D) tends to have a complex etiology that cannot be encapsulated by a single feature. It broadly encompasses any form of diabetes that is not type 1 diabetes, Maturity Onset Diabetes of the Young (MODY) or secondary diabetes.1 Although patients with T2D often secrete large amounts of insulin, insulin sensitivity and secretion are imbalanced, and the increased concentration of insulin is not sufficient to meet the increased demands imposed by obesity and insulin resistance.2 The mediating pathways of hyperglycemia that contribute to beta-cell dysfunction include organs associated with insulin resistance like the liver, skeletal muscle and adipose tissue, leading ultimately to a progressive decline of beta-cell function in the face of insulin resistance.3 Deterioration of beta-cell function is reflected by elevated fasting blood glucose and hemoglobin A1c (HbA1c), and reduced insulin secretion.4
Evidence from the Whitehall II cohort study5 indicated that insulin resistance and intermittent hyperglycemia were found about 13 years before the diagnosis of T2D, and unstable decompensation of beta-cell function started about 2–6 years before the diagnosis at a time when more sustained hyperglycemia at pre-diabetes range developed in the face of worsening insulin resistance. At the time of diagnosis of T2D, decompensation becomes stable, making beta-cells unable to compensate for insulin resistance due to reduced beta-cell mass with subsequent rapid and higher blood glucose concentration.6 Therefore, individuals with this type of diabetes usually have relative insulin deficiency due to progressive decline of beta-cell insulin secretion frequently on the background of peripheral insulin resistance.7
The steady-state of basal plasma glucose and insulin concentrations is determined by their interaction in a feedback loop between the liver and the beta-cells, thereby maintaining an effective insulin action in the liver and at the periphery. A computer-solved model has been used to predict the homeostatic concentrations which arise from varying degrees of beta-cell deficiency and insulin resistance. Comparison of a patient’s fasting values with the model’s prediction allows a quantitative assessment of the contributions of insulin resistance and deficient beta-cell function to the fasting hyperglycemia (Homeostasis Model Assessment, HOMA).8 HOMA is the oldest and the most widely used and published method for estimation of insulin sensitivity and assessment of beta-cell function. It offers some advantage over other methods in that it permits comparisons among studies that use the same metric.8–10
The aim of the study was to classify adult patients presented with newly diagnosed T2D into clinical subtypes or phenotypes based on cluster analysis of commonly measured variables; and to look at the associated clinical and metabolic features, microvascular complications and atherosclerotic cardiovascular disease (ASCVD) and risk among these phenotypes at the time of a first diagnosis of diabetes.
Research design and methods
A total of 500 consecutive adult patients with newly diagnosed T2D were recruited into the study. Oral antidiabetic drugs were stopped 2 days before the study to avoid the effect of glucose-lowering drugs on fasting plasma glucose and specific insulin levels. Patients on insulin therapy and with type 1 diabetes and secondary diabetes were all excluded. The remaining patients meeting the criteria of T2D were enrolled into the study. To identify subgroups of T2D, we did data-driven cluster classification of all patients by k-mean cluster analysis based on HOMA insulin sensitivity (HOMA2-%S) and beta-cell function (HOMA2-%β) using the SPSS V.23 statistical package, together with HOMA-insulin resistance (IR) and other six variables, including age at diagnosis, body mass index (BMI), waist circumference (WC), non-alcoholic fatty liver disease (NAFLD), serum triglycerides (TG) and HbA1c, which were measured in a single clinic visit. For comparative purposes, HOMA modeling was also conducted on 165 healthy control subjects with a fasting plasma glucose ≤6.0 mmol/L. All patients were subject to clinical assessment and laboratory investigations. Clinical assessment included detailed history data, anthropometric measures and comprehensive clinical examination. Laboratory investigations included fasting plasma glucose (mmol/L) and specific insulin (µIU/L), HbA1c (% [mmol/mol]) and estimated average glucose (eAG, mmol/L), serum creatinine (µmol/L) and creatinine-based estimated glomerular filtration rate (eGFR, mL/min/1.73 m2) using the Chronic Kidney Disease-Epidemiology Collaboration creatinine (CKD-EPI) equation, urine test and urine albumin to creatinine ratio (ACR, mg/g), liver enzymes, fasting serum total, high-density lipoprotein-cholesterol (HDL) and low-density lipoprotein-cholesterol (LDL) (mmol/L), serum TG (mmol/L), and calculated total to HDL-cholesterol ratio. HOMA2 and quantitative insulin sensitivity check index (QUICKI) were calculated from paired measured fasting plasma glucose and specific insulin concentrations, and were used in the cluster analysis to identify the clinical phenotypes of T2D. We used the latest software (V.2.2.3) of HOMA2 calculator released online by the Diabetes Trial Unit, Oxford, UK. The computer model was used to yield estimates of both beta-cell function (HOMA2-%β) and insulin sensitivity (HOMA2-%S).11 Hepatic insulin resistance (HOMA-IR) was calculated according to Matthews et al’s formula.8 The QUICKI, as another surrogate index that correlates with HOMA in determining insulin sensitivity in humans, was calculated as mentioned elsewhere.12
The baseline variables investigated were age at diagnosis of diabetes, gender, standard of education, duration since diagnosis (days), smoking status, family history (FH) of diabetes, systolic blood pressure (SBP) and diastolic blood pressure (DBP), previous diagnosis of significant medical diseases, pre-diabetes, hypertension, coronary heart disease (CHD) or stroke, and history of gestational diabetes (GDM) in women. Patients had their height (cm) and weight (kg) measured and their BMI (kg/m2) calculated. Metabolic syndrome was diagnosed according to the criteria suggested by the Joint Interim statement.13 WC (cm) was measured mid-way between the lower rib margin and the iliac crest, with waist enlargement being defined as the measure of WC that exceeded a Middle East, Mediterranean sex-specific minimum WC value.13 Lipid accumulation product (LAP) is a product of WC and fasting serum TG.14 WC is a surrogate measure of visceral fat and TG is a surrogate measure of NAFLD.14
Retinal screen was conducted by two of the authors (MAB and SAA-A), with retinal photographs taken when indicated. Cardiac assessment was performed by one of the authors (MMA-K), with ECG done for all patients and echocardiography when indicated. NAFLD reflects visceral fat accumulation15 and predicts increased risk of T2D.16 Its diagnosis was based on abdominal ultrasonography15 using Siemens machine (Sonoline), and its severity was assessed by quartile of LAP.14
Laboratory work-up was performed by means of Abbott Autoanalyzers (Abbott Laboratories, Abbott Park, Illinois, USA). Abbott ARCHITECT c4000 system was used for chemistry and Abbott ARCHITECT i1000SR system for hormones and virology. Serum insulin was measured by Abbott ARCHITECT insulin assay, which is a chemiluminescent microparticle immunoassay for the quantitative determination of human insulin in human serum.
The predicted future 10-year risk of cardiovascular events was calculated for each patient at the time of diagnosis based on existing cardiovascular risk factors using the United Kingdom Prospective Diabetes Study (UKPDS) Risk Engine.17 It is a T2D-specific online risk calculator for CHD and stroke in individuals with newly diagnosed diabetes and not known to have established CHD. Those with established ASCVD were excluded and categorized as extreme cardiovascular risk group.
Patients’ data were tabulated in an Excel spreadsheet and statistical analysis was computed using the SPSS V.23 statistical package. Data were presented in tables and graphs. Frequencies and percentages were used to describe qualitative data and the difference was examined by the χ2 test. The mean, SD and 95% CI of the mean were used to describe the quantitative data and the difference was measured by t-test. The median values with 25%–75% IQR were used to show the central tendency and its upper and lower quartiles as a preferred measure to define high and low values with skewed distribution. The Mann-Whitney U test was used as a non-parametric statistical test comparing the medians of non-normally distributed variables. Univariate analysis was used to show the significant associations among the elements of qualitative data. A stepwise multivariate logistic regression analysis was used to calculate adjusted ORs and the corresponding 95% CIs for outcomes in relation to exposure of interest. All statistical analyses were two-sided, using a prespecified 5% significance level; that is, statistical significance was assigned to a p value <0.05. Data processing was done using SPSS for Windows V.23.
Results
Among the recruited patients, 187 (37.4%) were women and 168 patients (34%) had older adult-onset diabetes (age at diagnosis >50 years). The median time from diagnosis to enrollment in the study was 14 days (IQR 7–42 days) in the entire study population.
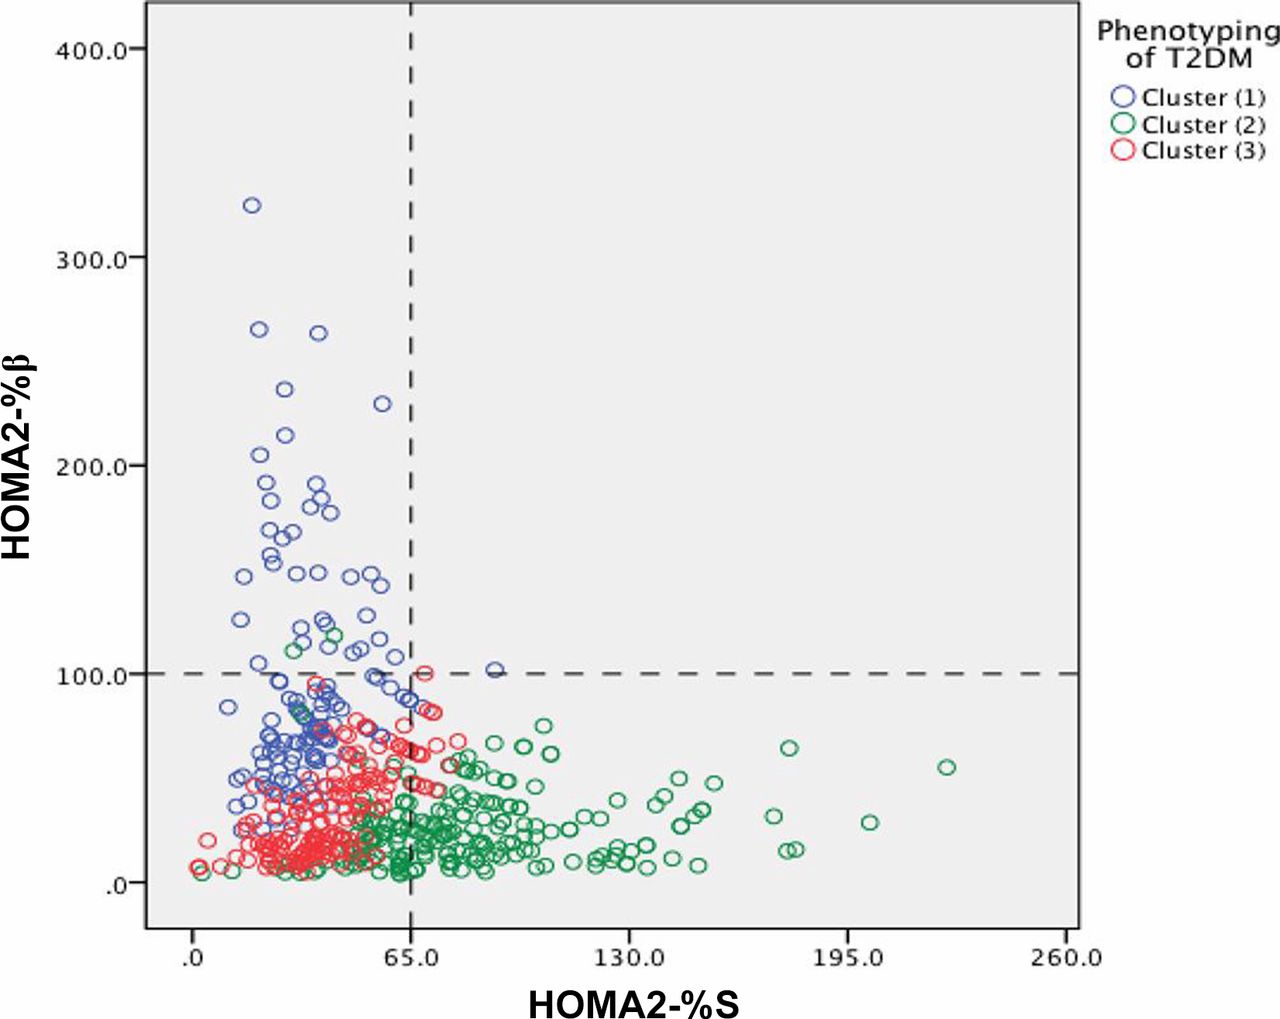
In online supplementary table S1, the baseline general characteristics of patients with T2D are presented by sex. It shows that women had significantly higher mean values of age, BMI, SBP and HDL-cholesterol as compared with their male counterparts. On the contrary, men had significantly higher mean values of eGFR, TG and TG:HDL-cholesterol ratio than in women. The HOMA modeling scatter plot in figure 1A,B shows data points representing the reciprocal relationship between HOMA2-β and HOMA2-S for control subjects and patients with diabetes, respectively. In figure 1A, there was a strong linear relationship between the two variables (r=−0.704, p<0.001), whereas this relationship although significant (r=−0.164, p<100) seems to be less linear. As shown in online supplementary table S2, among the control group, the median (IQR) value of HOMA2-%β was 138.4 (106.4–176.4), for HOMA2-%S was 55.9 (41.8–79.3) and for HOMA-IR was 2.7 (1.9–3.7). For every group of patients with diabetes investigated in this study, the HOMA median values were either significantly higher or lower than the background control subjects according to the phenotype of diabetes, as compared by Kruskal-Wallis test. The colored image HOMA modeling in figure 2 focuses on clustering and has identified three clusters of T2D: cluster 1 (high insulin resistance and high beta-cell function group) is characterized by very low insulin sensitivity and high beta-cell function; cluster 2 (low insulin resistance and low beta-cell function group) is characterized by high insulin sensitivity but severely reduced beta-cell function; and cluster 3 (high insulin resistance and low beta-cell function group) is characterized both by low insulin sensitivity and low beta-cell function. The graphs of HOMA-β, HOMA-S and HOMA-IR shown in online supplementary figure S1 compare the median values of the three variables between the three clusters. The greatest HOMA2-β value was seen in cluster 1 and the greatest HOMA2-S value in cluster 2. Cluster 3 showed both low HOMA-β and HOMA2-S. HOMA-IR was high in clusters 1 and 3 and low in cluster 2.
Supplemental material

(A) Relationship between HOMA2-%β and HOMA2-%S for control subjects (n=165). (B) Relationship between HOMA2-%β and HOMA2-%S for all patients with diabetes (n=500). HOMA2-%β, Homeostasis Model Assessment beta-cell function; HOMA-%S, Homeostasis Model Assessment insulin sensitivity.

HOMA modeling of phenotypes of T2DM. HOMA-β represents HOMA2 beta cell function; HOMA-S represents HOMA2 insulin sensitivity. Cluster 1 (high insulin resistance and high beta-cell function group [blue circles]) at the upper left is characterized by severe insulin resistance (low HOMA2-%S on x-axis) and high beta-cell function (high HOMA2-%β on y-axis). Cluster 2 (low insulin resistance and low beta-cell function group [green circles]) at the lower right is characterized by high insulin sensitivity (HOMA-S on x-axis) but severely reduced beta-cell function (low HOMA2-%β on y-axis). Cluster 3 (high insulin resistance and low beta-cell function group [red circles]) is characterized both by insulin resistance (low HOMA2-%S on x-axis) and reduced beta-cell function (low HOMA2-%β on y-axis). Reference lines represent the median values of HOMA2 beta-cell function (horizontal line) and HOMA2-S insulin sensitivity (vertical line) of the background control group. HOMA, Homeostasis Model Assessment; T2DM, type 2 diabetes mellitus.
The baseline clinical characteristics and biomarker measures of the three clusters are shown in table 1. The first cluster included 126 patients (25.2%) labeled high insulin resistance and high beta-cell function T2D; cluster 2 (218 patients, 43.6%) labeled low insulin resistance and low beta-cell function T2D; and cluster 3 (156 patients, 31.2%) labeled high insulin resistance and low beta-cell function T2D. This cluster classification was based on the fact that insulin secretion defined as median (IQR) HOMA2-% β value was progressively declining from cluster 1 to cluster 3, to cluster 2 (p<0.001). On the contrary, insulin action or insulin sensitivity defined as median (IQR) HOMA2-%S value was progressively increasing from cluster 1 to cluster 3, to cluster 2 (p<0.001). Reciprocally, the mean (SD) (95% CI) HOMA-IR index, as a measure of hepatic insulin resistance, was progressively declining from cluster 1 to cluster 3, to cluster 2 (p<0.001). The mean (SD) (95% CI) QUICKI value, as an additional surrogate measure of insulin sensitivity, was progressively increasing from cluster 1 to cluster 3, to cluster 2 (p<0.001).
Baseline key clinical characteristics and biomarker measures of patients with newly diagnosed type 2 diabetes by clusters
There was no significant difference in mean (SD) age between the three clusters, but there were significant differences in anthropometric and glycemic variables. The mean (SD) or median (IQR) values of BMI, WC and LAP were significantly higher in cluster 1 as compared with clusters 3 and 2 (p<0.001 for each). Glycemic variables defined as HbA1c and eAG were different between clusters. The median (IQR) HbA1c% (mmol/mol) and eAG (mmol/L) concentrations tended to be significantly higher in cluster 2 in comparison with clusters 1 and 3 (p<0.001 for each).
In table 2, potential risk factors likely related to the development of T2D are illustrated. The frequencies of all markers of insulin resistance, including obesity (BMI ≥30 kg/m2), advanced abdominal adiposity (WC ≥102 [male]/≥88 cm [female]), TG ≥2.3 mmol/L, NAFLD, BMI ≥30 + TG ≥2.3, LAP cm.mmol/L >75 percentile (as a marker of severe ectopic fat accumulation), and metabolic syndrome, were significantly higher in clusters 1 and 3 compared with cluster 2 (p<0.001 for all variables, except BMI ≥30 + TG≥2.3 [p=0.012] and TG [p=0.005]). On univariate analysis, both NAFLD and metabolic syndrome were significant risk factors for clusters 1 and 3 as compared with cluster 2. The relative risk from NAFLD was 2.7-fold for clusters 1 and 1.96-fold for cluster 3, and that from metabolic syndrome was 1.6-fold for cluster 1 and 1.4-fold for cluster 3 (data analysis not shown). The associations between NAFLD and insulin resistance and clinical and biomarker variables are given in online supplementary table S3. The frequencies of pre-existing hypertension, smoking, ASCVD (CHD, stroke, revascularization) and non-diabetic hyperglycemia states (impaired fasting glucose, impaired glucose tolerance [IGT], GDM) were not statistically different between the three clusters. Established ASCVD was confirmed in 23 patients (4.6%), especially among those with diabetes first diagnosed at age ≥40 years.
Potential risk factors associated with newly diagnosed type 2 diabetes by clusters
The first-degree FH of diabetes in our cohort has shown that nearly 272 patients (54.4 %) reported the presence of adult-onset diabetes in at least one first-degree family member, with about 466 first-degree relatives affected with diabetes (112 fathers, 122 mothers, 162 brothers, 70 sisters and 17 grandparents). A substantial number of patients (193/500, 38.6%) had one or both parents affected by diabetes. Out of all positive FH patients, the frequency was progressively decreasing from cluster 1 patient (61%) to cluster 3 patients (57%), to cluster 2 patients (48.6%). In total, 226 of 500 (45.2%) of our patients had FH of diabetes in parent(s), sibling(s), or single parent and sibling (FH+), and 46 of 500 (9.2%) had ≥3 sibling(s) and parent(s) affected with diabetes (FH++). An analysis of the familial aggregation of diabetes among first-degree relatives by cluster group of patients is given in online supplementary tale S4. This table indicates that familial burden is strong in cluster 1, mild in cluster 3 and weak in cluster 2. Interestingly, in cluster 1 only, there was a link between strong family history (FH++) and hepatic insulin resistance, with the median (IQR) HOMA-IR index significantly declining from 8.51 (6.2–12.4) in FH++ to 6.4 (4.9–8.5) in FH+, to 5.5 (3.8–8.3) in (FH−) (p=0.048).
Of 425 patients having retinal screen, 5 patients (1.2%) had non-proliferative diabetic retinopathy (NPDR), 3 mild and 2 moderate, distributed as 3 patients in cluster 2 and 1 patient in each of the other two clusters. Overall, these patients were diagnosed with diabetes at an average age of 48 years, and their Diabetic Retinopathy (DR) was associated with poor overall glycemia defined as mean (SD) HbA1c value of 10.8% (3.0) (95 [33] mmol/mol), severe hyperglycemia defined as mean (SD) eAG value of 16.7 (2.6) mmol/l, and elevated BP defined as mean (SD) SBP of 132 (13) mm Hg/DBP 85 (9) mm Hg. Pre-existing IGT was reported by one patient and hypertension on treatment by four patients.
Kidney screen was carried out in all patients. Serum creatinine-based eGFR, as a marker of renal function, was measured in all patients with a finding of grades 1–2 (eGFR >60 mL/min/1.73 m2) in 468 patients (94%) and grade 3a (eGFR 45–59 mL/min/1.73 m2) in 32 patients (6.0%). Urinary infections were excluded or treated if present. Urinary ACR, as a marker of nephropathic risk, was measured in 497 patients (99%) with normoalbuminuria (A1) (ACR <30 mg/g) among 210 patients (42%) and microalbuminuria (A2) (ACR 30–299 mg/g) among 287 patients (58%). Of all patients with microalbuminuria, cluster 2 had the highest frequency (44.3%), followed by cluster 3 (32.7%) and cluster 1 (23%). The mean eGFR values were statistically comparable between normoalbuminuria and microalbuminuria, and correlations between urinary ACR level and clinical variables and biomarker measures were not significant.
Using the UKPDS diabetes-specific risk engine, the overall estimated baseline mean (SD) and median (IQR) 10-year risk of developing CHD for 477 patients without prior ASCVD were 13.6% (10.4) and 10.4% (6.6%–16.8%), respectively. Its median value was significantly increasing from cluster 1 to cluster 2, to cluster 3 (p=0.031). Their overall baseline mean (SD) HbA1c was 9.7% (2.2) (83 [24] mmol/mol), and the median (IQR) value was 9.5% (7.9%–11.3%) (80 [63–100] mmol/mol). Its median value was significantly increasing from cluster 1 to cluster 3, to cluster 2 (p<0.001). There were no significant cluster differences in the mean values of age, SBP, total cholesterol (TC) or LDL-cholesterol. Table 3 shows stepwise multivariate logistic regression analysis of variables independently associated with high (>10%) estimated baseline CHD risk versus low-risk group (≤10%) in patients without prior ASCVD. Of seven variables showing significant association on univariate analysis, six variables retained their significant independent association with high CHD risk on multivariate model. These variables were old age, male gender, high HbA1c, high TC:HDL-cholesterol ratio, current smoking and metabolic syndrome. Prior established ASCVD was confirmed in 23 patients (4.6%) especially among those with a diagnosis of diabetes at age ≥40 years, but no cluster differences in prevalence were noted. Their mean (SD) HbA1c at diabetes diagnosis was 9.2% (2.4) (77 [27] mmol/mol).
Multivariate logistic regression analysis of variables independently associated with baseline 10-year estimated high risk for CHD (>10%) in newly diagnosed T2DM without pre-existing ASCVD, using diabetes-specific UKPDS Risk Engine
Discussion
T2D is a common chronic disease with complex etiology and high heterogeneity.2 18 In our study, we used a data-driven cluster analysis in classifying patients presented with newly diagnosed T2D into three clusters. Cluster 1 (high insulin resistance and high beta-cell function group) was generally associated with the highest HOMA2-β and HOMA-IR scores and the lowest HOMA2-S score and HbA1c value than was found in the other clusters. In accord with other studies, insulin resistance was associated with abdominal adiposity (UKPDS Asians),19 obesity and high TG concentration,20 and NAFLD.16 Cluster 2 (low insulin resistance and low beta-cell function group) had the lowest HOMA2-β score, BMI, WC and LAP, and the highest HOMA2-S score and HbA1c value than in the other clusters. As in UKPDS Afro-Caribbeans,19 high HbA1c was associated with greater impairment of beta-cell function. Cluster 3 (high insulin resistance and low beta-cell function group) was characterized by both low insulin sensitivity (low HOMA2-S, high HOMA-IR) associated with overweight, abdominal adiposity and NAFLD, and high HbA1c associated with reduced beta-cell function (low HOMA2-β).
There is a recent trend in clinical research to identify more refined subtypes of adult-onset diabetes in order to accurately predict clinical outcomes and identify targeted individualized therapy.18 Three HOMA2-based studies from Scandinavia were recently published that identified discrete subtypes of adult diabetes with different pathophysiology. All New Diabetics in Scania (ANDIS) and other four cohorts in Southern Sweden and Western Finland study21 recruited patients with new and long-term diagnosis and identified five diabetes clusters based on genetic and non-genetic variables; the Danish Centre for Strategic Research in Type 2 Diabetes (DD2) study in Denmark22 recruited patients with short disease duration and identified three clusters based on clinical variables; and the Steno Diabetes Center Copenhagen (SDCC) study in Denmark23 recruited patients with short and long disease duration and identified five clusters based on clinical variables. The higher cluster prevalence rates reported were cluster 2 (low insulin resistance and low beat-cell function group) (43.6%) in our study; cluster 5 (mild age-related diabetes) (39.1%) in the ANDIS cohorts21; cluster 2 (classical T2D) (63.1%) in the DD2 cohort22; and cluster 4 (insulin resistant, obese with long-disease duration) (32%) in the SDCC cohort.23
Patients in cluster 1 (high insulin resistance and high beta-cell function group) in our study are younger but showed similar trajectories to those with cluster 3 (severe insulin-resistant diabetes) in the ANDIS cohort21 and hyperinsulinemic T2D in the DD2 cohort,22 and subgroups 2, 4 and 5 in the SDCC cohort.23 All were characterized by high HOMA-IR and HOMA-β scores, and high BMI.
Cluster 3 (high insulin resistance and low beta-cell function group) in our study is similar to classical T2D phenotype in the DD2 cohort22 and subgroup 5 in the SDCC cohort23 in having insulin resistance (high HOMA-IR), reduced beta-cell function (low HOMA2-β) and high BMI. Furthermore, our cluster 3 and subgroup 5 in the SDCC cohort23 were associated with high frequency of metabolic syndrome.
Our findings in cluster 2 were in line with those of cluster 2 (severe insulin-deficient diabetes) in the ANDIS cohort,21 cluster 2 (insulinopenic T2D) in the DD2 cohort,22 and cluster 3 (non-autoimmune beta-cell failure diabetes) in the SDCC cohort.23 All are characterized by high insulin sensitivity (high HOMA2-S) but severely reduced beta-cell function (very low HOMA2-β). In all cohorts, patients were non-obese with smaller WC and poor metabolic control. Autoimmune insulin-deficient diabetes was reported only by ANDIS21 and SDCC23 studies but not by DD2 or our cohorts.
Patients’ glycemia at the time of the study, defined as HbA1c value, was high in our cluster 2, ANDIS clusters 1 and 2, and SDCC clusters 1 and 3, and low in our cluster 1 and other cohort clusters with mild-severe insulin resistance and short-long disease duration.
An FH of diabetes is a strong risk factor for T2D, with a familial risk estimated to be about 2.4-fold versus FH− patients.24 In a recent study, Bennet et al 25 found that 45.7% of the total Iraqis born in Iraq but immigrants in Sweden, vs 27.4% of Iraqis born in Sweden (native Swedes), had mild FH burden of diabetes (FH+). They also found that approximately 8.0% of Iraqis born in Iraq vs 0.7% of those born in Sweden had strong FH burden of diabetes (FH++). In our study, like Iraqi immigrants, 45.5% of patients had FH+ and 9.2% had FH++. These findings may suggest a strong familial burden of T2D in Eastern Mediterranean populations as compared with native Swedish population. In Yemen, 26 we have previously noted that the development of early-onset T2D among the offspring was more likely associated with a consanguineous and/or conjugal parents with diabetes. An increasing level of FH burden was associated with reduced beta-cell function both in immigrant Iraqis in Sweden25 and in Botnia Finish population.24 The modest increase in insulin resistance with increasing FH burden observed in our insulin-resistant patients was also noted in Botnia study.
The gradual development of T2D with estimated 9–12 years’ delay in diagnosis is thought to predict the occurrence of retinopathy in newly diagnosed T2D.27 Of the 425 patients examined at entry to our study, only 5 (1.2%) had mild or moderate NPDR. In the Diabetes Prevention Program trial,27 retinopathy consistent with diabetic retinopathy was detected in 7.9% of persons with pre-diabetes and 12.6% of patients with new-onset diabetes. In the UKPDS,28 of the 3709 patients who had good-quality retinal photographs at entry, 708 (19%) had microaneurysms (MA) in one eye, 176 (5%) had MA in both eyes and 509 (14%) had more severe retinopathy. At entry to the UKPDS trial, patients with higher blood glucose levels were more likely to have retinopathy, possibly reflecting a longer duration of diabetes before diagnosis. The small number of patients with retinopathy at entry to our study might be attributed to lack of retinal photography of all patients and/or the shorter duration of diabetes before diagnosis.
In diabetes, nephropathy and chronic kidney disease (CKD) are independent and coexisting harbingers of end-stage renal failure and increased cardiovascular morbidity and mortality.29 Microalbuminuria alone may not provide optimal identification of patients with T2D at high risk of renal impairment, unless associated with other risk factors like elevated blood pressure.30 There was no evidence of significant CKD at the time of diagnosis of diabetes in our study, since about 94% of our patients had eGFR >60 mL/min/1.73 m2. Although causes other than diabetes were excluded, the increased prevalence of microalbuminuria at initial screen might be attributed to uncontrolled hyperglycemia. Persistent microalbuminuria seems unlikely, since a diagnosis like this requires at least two of three positive urine tests repeated over 3–6 months.
Patients with diabetes are known to be at a greater risk of experiencing cardiovascular complications compared with people without diabetes. Just having the label of diabetes against no diabetes doubles the risk for CHD, stroke and death from vascular events, independently from other conventional cardiovascular risk factors.31 In the present study, the overall baseline mean (SD) risk of developing CHD over 10 years for patients without prior ASCVD was 13.6% (1.4), and their baseline mean (SD) HbA1c% was 9.7% (2.2) (83 [24] mmol/L). The higher frequency of CHD risk was noted in clusters 3 and 2 and the lower in cluster 1. In a previous study,32 using the same UKPDS Risk Engine among 38 670 patients without prior ASCVD, we found a higher risk mean (SD) CHD risk of 20% (15), but comparable mean (SD) HbA1c of 9.6% (1.9). Risk factors independently associated with higher future risk of CHD in this study were old age at diabetes diagnosis, male gender, smoking, poor glycemic control, high total to HDL-cholesterol ratio and metabolic syndrome.
There are some limitations in our study that require comment. First, although insulin-based HOMA2 modeling was sufficient in clinical practice, measuring C peptide has recently been used in supporting the diagnosis of insulin resistance and insulin deficiency.33 Glutamic Acid Decarboxylase (GAD) antibody testing allows prediction of autoimmune diabetes and definition of the latent autoimmune diabetes in adult subgroup of non-insulin-treated patients.34 If both have been used, it might be possible to divide our cluster 2 into two subtypes, autoimmune and non-autoimmune insulin-deficient diabetes. Second, we only took retinal photographs for a small number of patients, and we did not grade a retinopathy severity level as recommended by the Early Treatment of Diabetic Retinopathy Study (ETDRS) study scale used in the UKPDS.28
In conclusion, data-driven cluster analysis of newly diagnosed T2D in adults has identified three phenotypes based on clinical variables and biomarker measures central to the development of diabetes, and on specific clinical and metabolic characteristics of each phenotype. Screening for microvascular and macrovascular complications at time of the first diagnosis of diabetes is essential to identifying patients with or at risk of these complications and to individualizing treatment decision.
Acknowledgments
The authors wish to thank Dr Farouk AS Al-Qadasi for his assistance with statistical analysis.
References
Footnotes
Contributors Conceived and designed the study: AAG. Examined the patients: MMA-K. Cardiovascular assessment: MAB and SAA-A. Eye assessment: AAG and ANA-R. Comprehensive clinical assessment and analyzed the data: AAG. Wrote the first draft: AAG. Contributed to the writing of the manuscript: AAG, MMA-K, MAB, SAA-A and ANA-R. Agreed with manuscript results and conclusions: AAG, MMA-K, MAB, SAA-A and ANA-R. Jointly developed the structure and arguments for the paper: AAG, MMA-K, MAB, SAA-A and ANA-R. Made critical appraisal and approved the final version: AAG. All authors reviewed and approved the final manuscript.
Funding The authors have not declared a specific grant for this research from any funding agency in the public, commercial or not-for-profit sectors.
Competing interests None declared.
Patient consent for publication Obtained.
Provenance and peer review Not commissioned; externally peer reviewed.
Data sharing statement No additional data are available.