Article Text

Abstract
Objective To assess the role of flash glucose monitoring in early and late changes in glycemic markers under real-life conditions.
Research design and methods Deidentified glucose results from 6802 flash glucose monitors were analyzed after dividing into high, medium and low-risk groups based on tertiles of time spent in hypoglycemia (min/day <70 mg/dL) or hyperglycemia (hours/day >240 mg/dL). Groups were further subdivided into tertiles of glucose scanning frequency and glycemic measures analyzed in the first 14 days and over 6 months.
Results Improvement in dysglycemia mainly occurred in the first month of device use. Comparing first and last 14 study days, high-hyperglycemic-risk individuals showed reduced time >240 mg/dL (mean±SEM) from 6.07±0.06 to 5.73±0.09 hours/day (p<0.0001). High-frequency scanners showed 0.82 hours/day reduction in hyperglycemia (p<0.0001) whereas low-frequency scanners failed to demonstrate a benefit. High-hypoglycemic-risk individuals showed reduction in time ≤54 mg/dL from 90±1 to 69±2 min/day (p<0.0001) comparing first and last 14 study days. This reduction was evident in both low and high-frequency scanners but with reduced hyperglycemic exposure in the latter group.
Conclusions Under real-world conditions, flash monitoring is associated with rapid and sustained reduction in dysglycemia with high-frequency scanners demonstrating more significant reduction in hyperglycemia.
- flash glucose monitoring
- continuous glucose monitoring
- longitudinal
- diabetes
- glycemia
This is an open access article distributed in accordance with the Creative Commons Attribution Non Commercial (CC BY-NC 4.0) license, which permits others to distribute, remix, adapt, build upon this work non-commercially, and license their derivative works on different terms, provided the original work is properly cited, appropriate credit is given, any changes made indicated, and the use is non-commercial. See: http://creativecommons.org/licenses/by-nc/4.0
Statistics from Altmetric.com
Significance of this study
What is already known about this subject?
The effect of flash glucose monitoring has been evaluated in randomized controlled trials, but it is unclear if these findings are applicable to real-world settings.
What are the new findings?
This analysis demonstrates improved glycemic measures within the first month of use that is subsequently sustained.
How might these results change the focus of research or clinical practice?
These results support the findings of clinical trials of the benefits of flash glucose monitoring, and elucidate the factors associated with those benefits in real-world use.
Introduction
Self-monitoring of blood glucose (SMBG) using capillary glucose testing remains one of the most widely used methods for repeated glucose measurements in patients with diabetes. Previous work has shown that increasing number of SMBG tests is associated with lower glycated hemoglobin (HbA1c), indicating that frequent testing is necessary to improve glycemic control.1 However, SMBG only provides sporadic data and can be inconvenient to patients. Continuous glucose monitoring (CGM) has the advantage of offering a more comprehensive glycemic assessment and a number of randomized controlled studies have shown that it further improves glycemic control.2–5 However, there are a number of factors that limit widespread use of CGM, including cost and the need for regular calibration. The recently released FreeStyle Libre flash glucose monitoring system (Abbott Diabetes Care, Alameda, CA) addressed some of the drawbacks of traditional CGM by eliminating the need for calibration and simplifying device wear while making it more affordable.
Flash glucose monitoring has been previously evaluated in people with type 1 and type 2 diabetes6–9 in the IMPACT and REPLACE clinical trials, respectively. In patients with type 1 diabetes and good diabetes control (HbA1c<7.5%), a clinically meaningful reduction in time spent in hypoglycemia was observed with the use of flash glucose monitoring without deterioration in overall glycemia assessed as HbA1c. This improvement in hypoglycemia primarily occurred during the first 14 days of system use, which was then sustained for 6 months. In patients with type 2 diabetes and inadequate glycemic control (HbA1c 7.5%–12%), time spent in hypoglycemia was also reduced by flash glucose monitoring, an effect that was sustained and associated with the additional reduction in HbA1c in patients younger than 65 years of age. However, given these studies were undertaken under trial conditions and included a relatively small number of patients, it is unclear whether these findings are applicable to real-world settings.
A recent analysis involving over 50 000 users of the FreeStyle Libre system under real-world conditions10 has demonstrated an inverse correlation between glucose scanning frequency and time spent in either hypoglycemia or hyperglycemia. While these data indicate that frequent glucose scanning is associated with improved glycemic markers, it remains to be determined whether higher risk glycemic groups benefit from this glucose monitoring strategy and whether any improvement in glycemia is sustained.
In this report, we analyzed the early and medium-term effects of flash glucose monitoring on glycemic outcomes in individuals with high exposure to hyperglycemia or hypoglycemia, thus representing high-risk subjects. This longitudinal study, conducted under real-life settings, had three main objectives: (1) to determine longitudinal trends and patterns of glycemic measures over a period of 6 months; (2) to elucidate trends and patterns of glycemic measures during early use of the system, over a period of 14 days; and (3) to understand the role of user engagement with the device in determining glycemic outcomes.
Research design and methods
Sensors and readers
The commercial availability of the system began in September 2014 in seven European countries (Germany, UK, France, Italy, Spain, Sweden and Netherlands), and subsequently expanded to other countries. The report software was available for free download, which included an end-user agreement stating that anonymized and deidentified system data would be collected by a database at each internet-connected use of the software.10
For the 6-month analysis portion of this report, a subset of sensors and readers was included in the analysis. Sensors were included only if they were operational for 5 days or longer. Readers were included in the analysis only if they were used with at least 12 sensors; however, sensors used with any reader beyond the first 12 were not analyzed.
Blood glucose testing details
Blood glucose testing frequency during each sensor wear was calculated by counting the number of tests divided by duration of sensor use. To understand how blood glucose testing frequency changed over a 6-month period, test frequency was averaged in 14-day periods across readers who had at least one blood glucose test (n=2655).
Sensor scanning details
Scanning frequency for each sensor was calculated by counting the number of scans divided by duration of sensor use. To understand how scanning frequency changed over a 6-month period, it was averaged in 14-day periods across readers who had at least 12 sensors. Furthermore, to understand user engagement, scan frequency variation during the first 14 days was separately analyzed.
Glycemic measures
Glycemic measures were studied to observe longitudinal trends and patterns over a period of 6 months. In order to understand how individuals at high risk of hyperglycemia or hypoglycemia responded when using the system, the starting population was divided into tertiles based on time spent in significant hyperglycemia (>240 mg/dL) and time spent in hypoglycemia (<70 mg/dL) during the first 14 days of sensor use. This yielded a total of six groups representing high, medium and low risks for hyperglycemia or hypoglycemia. The two high-risk groups for hyperglycemia and hypoglycemia were further subdivided into tertiles of lower, medium and higher scanning frequencies. Tertiles were chosen as a method of risk stratification in the absence of consensus clinical guidelines for time spent in hypoglycemia and absence of baseline laboratory HbA1c data.
Furthermore, to determine how glycemic patterns change when system use was first initiated, a separate analysis was conducted for the first 14 days of sensor wear in the subgroups. In order to account for the impact of rapid changes during the initial days of use, days 1 through 56 were combined with 14-day averages from day 63 to 161 and exponential curve fitting was performed.
Two hyperglycemic and two hypoglycemic measures were subsequently analyzed: time spent above 240 and 180 mg/dL and time spent below 70 and at or below 54 mg/dL.11
Statistical analysis
The database was analyzed by structured query language routines, and further summarized by KNIME (www.knime.org), MATLAB and R statistical package (www.r-project.org). Glycemic measures for each reader were calculated for every 14-day period and averaged across readers to obtain trends by day. Statistical comparisons between the first and last 14-day periods were performed by pairwise t-tests and p<0.05 was considered statistically significant. When the population was stratified based on glycemic measures, longitudinal measures were corrected for regression to mean effects. Since regression to mean effects are dependent on the measurement errors in each individual,12 measurement errors were determined by calculating the SD of residuals from a regression trend during the first six sensors for each individual. Simulations were then performed by randomly adding this error to data from each reader and repeating stratification and glycemic measure calculation. The average result after 200 simulations was then used as the corrected value.
Results
User base
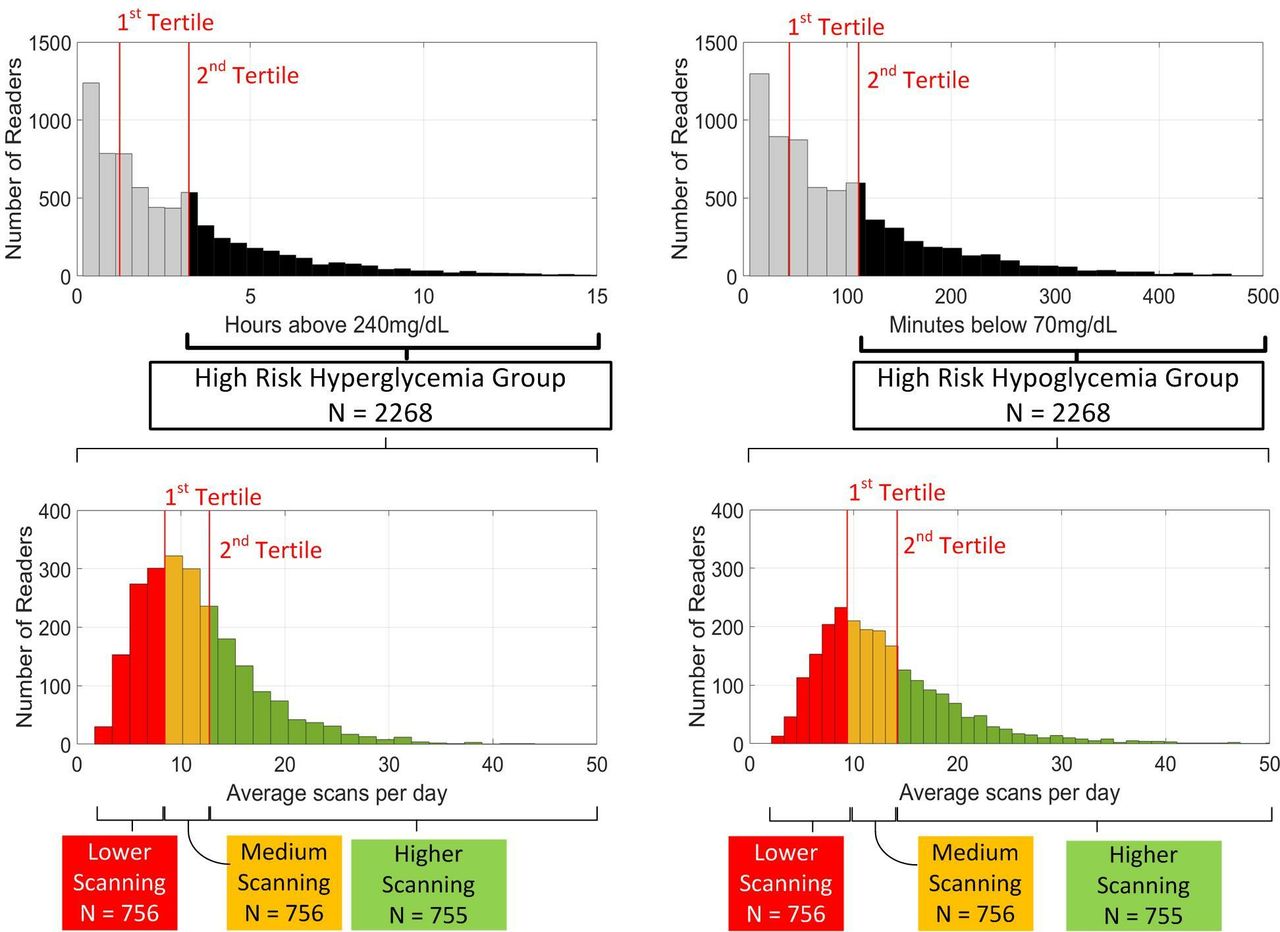
After applying the exclusion criteria, a total of 6802 readers and 66 670 sensors remained for subsequent data analysis (median gap between sensors=3.1 hours). Readers were divided into tertiles based on time spent in hyperglycemia and time spent in hypoglycemia with each group being further subdivided into tertiles based on scanning frequency as shown in figure 1.

Stratification of the data into high-risk groups for hypoglycemia and hyperglycemia. Top panels show the distribution of initial time spent in hyperglycemia (left) and hypoglycemia (right). Individuals whose initial glycemic measures were to the right of the second tertile were designated to be in the high-risk group. The high-risk groups were further stratified based on average scanning frequency over 6 months as shown in the bottom panels.
To assess how the risk stratification technique aligns with data from randomized clinical trials, baseline hypoglycemia (determined for the first 14 days of sensor use) in the high-risk group was compared with that in the baseline period of the intervention group of IMPACT6 and was found to be similar. We relied on time spent in hyperglycemia as a measure of exposure to high glucose levels, which corresponded to using estimated HbA1c>7.5% in terms of baseline mean estimated HbA1c and baseline mean HA240, supporting the validity of this approach in targeting subjects with inadequate glycemic control.
Summary statistics for the various subgroups during the first 14 days are summarized in
table 1 for hyperglycemia and table 2 for hypoglycemia.
Summary statistics for the first 14 days of sensor wear after stratification based on risk of hyperglycemia and scanning frequency. All values shown for glycemic measures and scanning frequency are average values
Summary statistics for the first 14 days of sensor wear after stratification based on risk of hypoglycemia and scanning frequency. All values shown for glycemic measures and scanning frequency are average values
Only high-risk groups were analyzed for effect on glycemic outcomes. Only 472 out of 4536 (10.4%) of the individuals were at high risk of both hypoglycemia and hyperglycemia. Due to the limited size of this subgroup in the study population, further investigation is needed with a larger data set to understand the association of flash glucose monitoring and glycemic metrics in individuals at higher risk of both hyperglycemia and hypoglycemia. Two-thirds of all individuals were in either the high-risk group for hyperglycemia or hypoglycemia.
Frequency and pattern of scanning and blood glucose testing
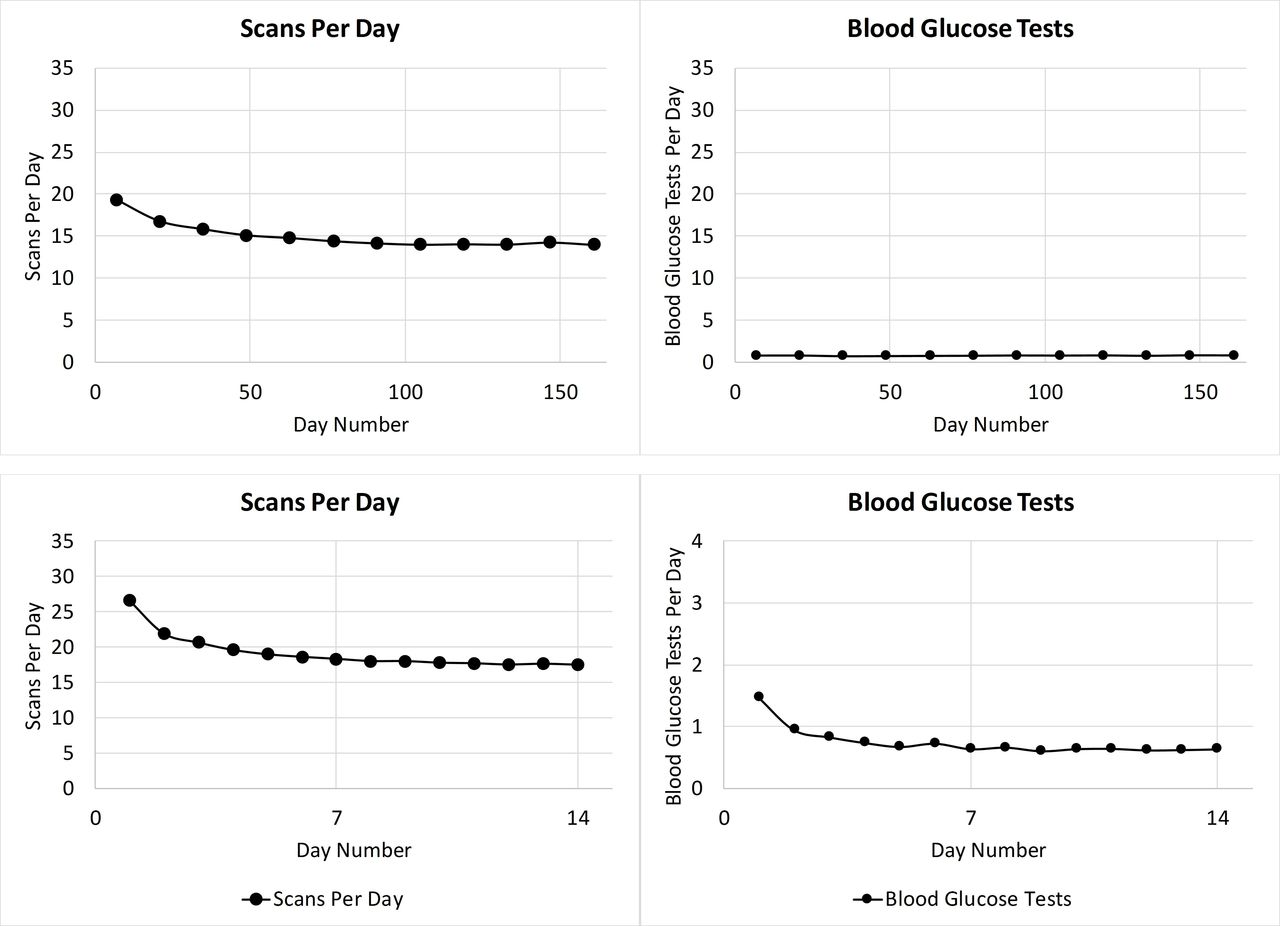
A gradual reduction in scanning frequency was observed from over 18 scans/day during the first sensor use to about 15 scans/day at the 2-month mark (figure 2, top panel). This level of scanning was then maintained for the remainder of the analysis period demonstrating that users remained engaged with the system. Blood glucose testing stayed stable at 0.75/day throughout the analysis period. To understand how scanning frequency and blood glucose testing changes during the first 14 days, a day-to-day analysis of scanning frequency and blood glucose testing was performed. The plots in figure 2 (bottom panel) illustrate a high scan rate of 27 scans/day on day 1 of sensor use followed by a rapid initial decrease. Blood glucose testing after initiating use of flash glucose monitoring stabilized to less than one test/day at the end of the 14-day period.

Scan frequency and blood glucose (BG) test frequency over 6 months (top panel) and first 14 days (bottom panel).
Glycemic markers during 6 months of use
For high-risk individuals, glycemic measures were analyzed to investigate changes during the first 6 months of sensor wear. The results are summarized in table 3.
Glycemic measures over 6 months for the high risk of hyperglycemia and hypoglycemia groups. All values shown for glycemic measures are average values (with SE)
High-risk hyperglycemia group
Comparing the first and last 14 days of sensor wear, individuals in high-risk tertile for hyperglycemia showed reduced time above 240 mg/dL (mean±SE) from 6.07±0.06 to 5.73±0.09 hours/day (p<0.0001; figure 3).

Glycemic measures for the high risk of hyperglycemia group. Plot markers display 14-day averages over 6 months. Error bars show 2×SE.
The reduction in time spent in hyperglycemia was associated with minimal change in time at or below 54 mg/dL (29±1 to 31±1 min/day, p=0.023). Results when the high-risk group was subdivided based on overall scan rate are presented in figure 4. Comparing the first and last 14-day periods, individuals in the high-risk group showed reduced time above 240 mg/dL (mean±SE) from 5.71±0.10 to 4.90±0.14 hours/day in higher scanners (p<0.0001) with a limited effect in medium-frequency scanners (from 5.84±0.09 to 5.47±0.13 hours; p=0.02), whereas no effect was detected in low-frequency scanners. The reduction in time spent in hyperglycemia in high and medium-frequency scanners was associated with a modest increase in time spent below 70 mg/dL (55±2 min to 62±3 min, p=0.003 and 72±2 min to 77±3 min, p=0.028 for higher and medium-frequency scanners, respectively). No significant change was observed in time spent at or below 54 mg/dL in higher frequency scanners while a small change was observed in the medium scanning frequency group (from 28±1 min to 32±2 min, p=0.035).

Glycemic measures for the various scanning frequency subgroups in the high risk of hyperglycemia group. Plot markers display averages of 14 days over 6 months. Red diamonds are used for low scanners, orange squares for medium scanners and green circles for high scanners. Error bars show 2×SE.
High-risk hypoglycemia group
Comparing the first and last 14-day periods, individuals in high risk for hypoglycemia group showed reduced time below 70 mg/dL (mean±SE) from 200±2 to 154±3 min/day (p<0.0001; figure 5) and time at or below 54 mg/dL (mean±SE) from 90±1 to 69±2 min/day (p<0.0001; figure 5). The reduction in hypoglycemia was associated with increased time spent in hyperglycemia above 240 mg/dL from 2.07 to 2.83 hours/day (p<0.0001), while time above 180 mg/dL increased from 5.67 to 6.94 hours/day (p<0.0001).

Glycemic measures for the high risk of hypoglycemia group. Plot markers display 14-day averages over 6 months. Error bars show 2×SE.
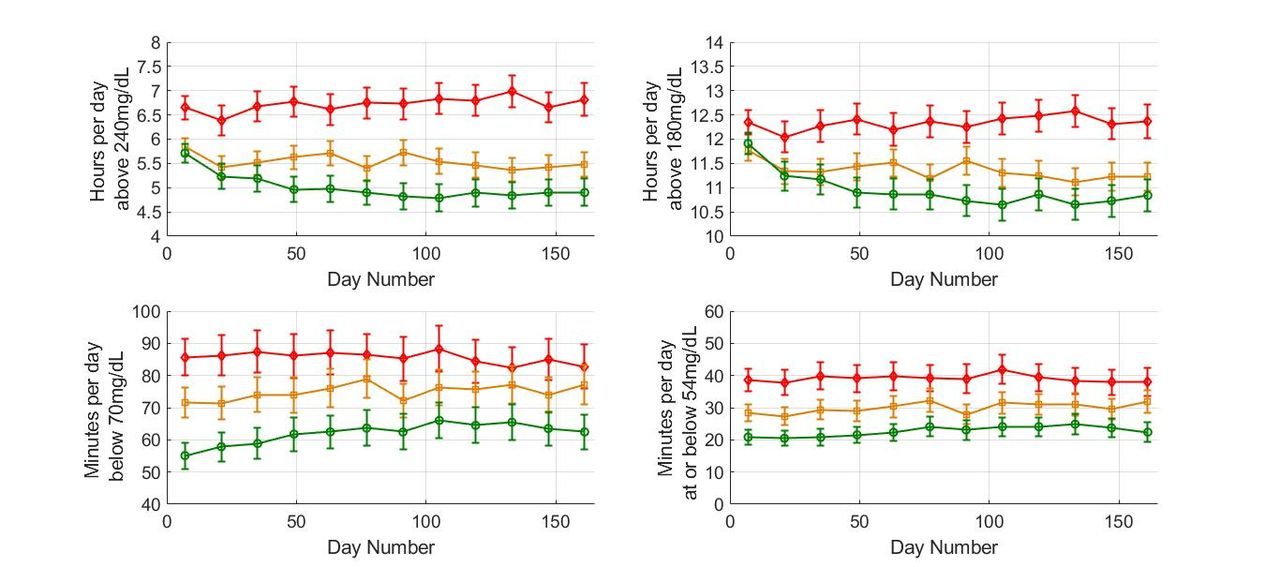
High, medium and low-frequency scanners all showed reduced time below 70 mg/dL (figure 6) with no difference detected comparing high-frequency and low-frequency scanners (reduction from 200±3 to 161±5 min and 204±3 to 154±4 min/day, respectively; p<0.0001 for both). Similar data were obtained for time spent at or below 54 mg/dL (figure 6). However, a crucial difference was detected in time spent in hyperglycemia comparing high and low-frequency scanners where low-frequency scanners showed a relatively large increase in time spent above 240 mg/dL (2.82–3.94 hours/day; p<0.0001) while high-frequency scanners showed a much more modest increase (1.33–1.67 hours/day; p<0.0001).

Glycemic measures for the various scanning frequency subgroups in the high risk of hypoglycemia group. Plot markers display 14-day averages over 6 months. Red diamonds are used for low scanners, orange squares for medium scanners and green circles for high scanners. Error bars show 2×SE.
Glycemic markers during the initial 14 days of FreeStyle Libre use
In a clinical study, typically a few days of blinded glucose sensor data are measured when glucose readings are recorded but not displayed to the subject. These few days of data would represent the baseline with which to compare subsequent ‘unblinded’ glucose readings.6 However, in this analysis blinded baseline data were not available. To get a better sense of changes in glycemic markers with flash glucose monitoring, data were fit to an exponential distribution using daily and 14-day average glycemic measures in high scanners with high risk of hyperglycemia and separately for high scanners with high risk of hypoglycemia.
High-risk hyperglycemia group
In this group, high scanners displayed a total reduction in time above 240 mg/dL from 6.0 to 4.79 hours/day with 0.71 hour/day reduction (59%) occurring in the first 14 days of sensor use. For hours above 180 mg/dL, total reduction was from 12.3 to 10.7 hours/day with 0.97 hour/day reduction (61%) occurring in the first 14 days of sensor use. The total improvement associated with flash glucose monitoring for this subgroup occurred within 2 months of sensor use and was sustained over the 6-month study period (figure 7).
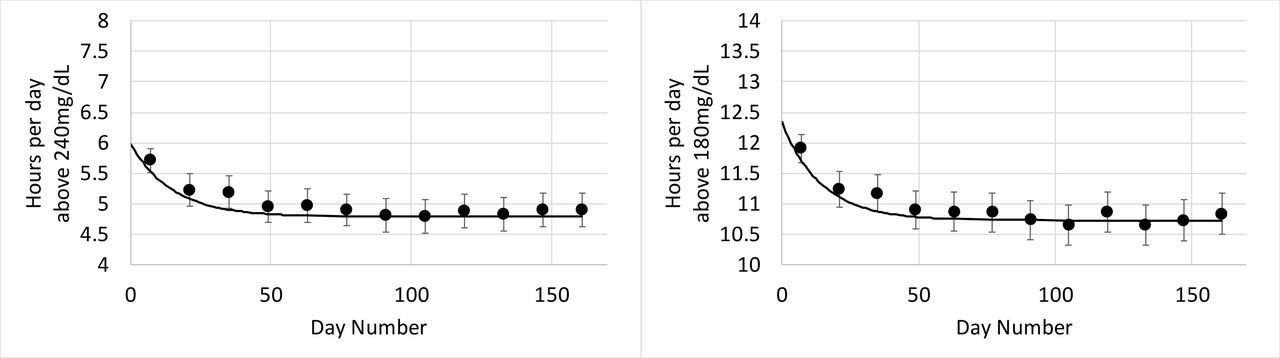
Hours per day above 240 mg/dL (left) and 180 mg/dL (right) versus days of sensor use in high scanners in the high risk for hyperglycemia group. Error bars show 2×SE. The plot markers (·) show 14-day averages over the analysis period. The solid black line describes the exponential fit that was performed to estimate glucose patterns during the first 14 days of use.
High-risk hypoglycemia group
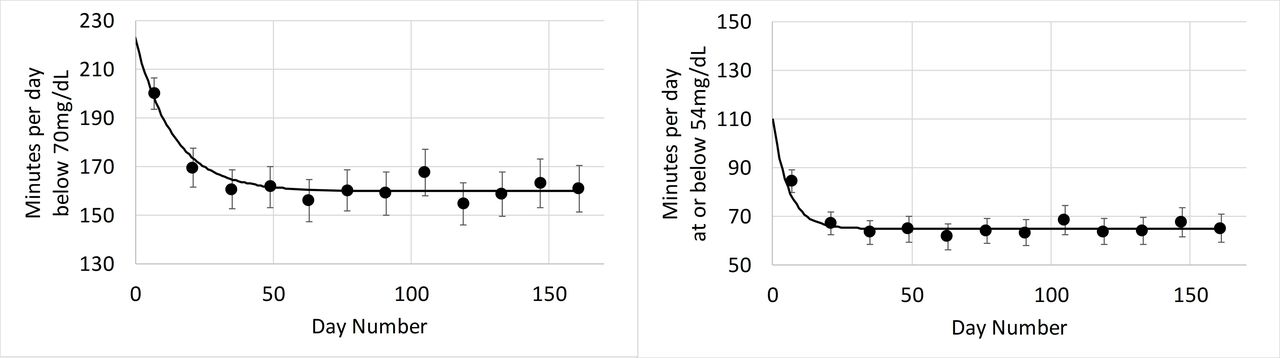
In high scanners the reduction in time spent below 70 mg/dL was from 223 to 160 min/day with a reduction of 40 min (63%) occurring in the first 14 days of sensor use. Similarly, total reduction of time spent at or below 54 mg/dL was from 110 to 65 min/day, with a reduction of 41 min (91%) occurring in the first 14 days of sensor use. The improvement in hypoglycemia in high scanners occurred quickly in less than 1 month and was then sustained over the study period (figure 8).
Minutes below 70 mg/dL (left) and at or below 54 mg/dL (right) versus days of sensor use in high scanners in the high risk for hypoglycemia group. Error bars show 2×SE. The plot markers (·) show 14-day averages over the analysis period. The solid black line describes the exponential fit that was performed to estimate glucose patterns during the first 14 days of use.
Conclusions
The current longitudinal study was designed to observe the impact of the FreeStyle Libre system on glycemic markers outside trial settings, thus further informing clinical practice. This study in patients with significant derangements in glucose levels shows a number of novel and clinically important observations: (1) flash glucose monitoring in real-life settings is associated with reduction in both hyperglycemia and hypoglycemia in higher risk individuals, an effect that is sustained over 6 months of device use; (2) glucose scanning frequency shows an inverse correlation with time spent in hyperglycemia and clinically significant hypoglycemia in higher risk patients; (3) reduction in hyperglycemia is associated with minimal increase in clinically significant hypoglycemia whereas hypoglycemia reduction results in increased time spent in hyperglycemia, an effect that is minimized in frequent glucose scanners; (4) reduction in time spent in hyperglycemia is more pronounced in high-frequency scanners and the improvement continues for 2 months before stabilizing; and (5) reduction in time spent in clinically significant hypoglycemia is immediate and mainly occurs in the first 14 days of sensor use.
In this study, individuals at high initial risk of hyperglycemia and hypoglycemia showed a reduction in the respective measures and maintained it over the course of approximately 6 months. Scanning frequency remained high even after several months of device use with limited capillary glucose testing, indicating that individuals show confidence in and continue to rely on the system. However, it is possible that individuals used alternate blood glucose testing meters rather than the one provided by the FreeStyle Libre system, and thus the frequency of blood glucose testing would be under-represented.
Previous work has shown that frequent capillary glucose testing or flash glucose monitoring is associated with improved glycemic parameters,1 supporting a role for frequent glucose checks to optimize glycemia. These positive effects of glucose checks appear to be maintained in individuals at high risk of dysglycemia. In those with high risk of hypoglycemia who are frequent scanners, 39 min/day reduction was observed in hypoglycemia between the first and last 14 days of sensor use. Moreover, when compared with the first day of system use, the reduction in time <70 mg/dL exceeded 1 hour/day. Similarly, in frequent scanners in the high-risk hyperglycemic group, comparing the first and last 14 days, there was a reduction of 0.81 hour/day of glucose >240 mg/dL. Compared with the first day of system use, the reduction in time was even more pronounced at 1.21 hours/day. Within this risk group, an enhanced benefit was seen in high-frequency scanners. In both hyperglycemia and hypoglycemia risk groups, the majority of the improvement occurred in the first 14 days of system use, although continued reduction in hyperglycemia was evident up to 2 months following device use with sustained benefit at 6 months.
Importantly, the reduction in hyperglycemia occurred with limited increase in clinically significant hypoglycemia, which can predispose to adverse clinical outcomes.13–18 The increase in time spent in clinically relevant hypoglycemia was statistically significant. Conversely, the reduction in hypoglycemia resulted in a significant increase in time spent in hyperglycemia, although this increase was limited in high-frequency scanners. It can be inferred from these results that individuals address the glycemic issue that is most relevant to them even at the cost of worsening other glycemic metrics. It was also observed that the reduction in time spent in hyperglycemia was particularly pronounced in high-frequency scanners. Collectively, these data indicate that high-frequency scanning is effective at reducing hyperglycemic exposure.
Interestingly, the reduction in clinically significant hypoglycemia was immediate and occurred within a few days of system use, suggesting that this was done by the patient without input from the healthcare professional. Therefore, the device represents a cost-effective measure to reducing hypoglycemia, particularly in high-risk groups of patients. Moreover, these data further support the use of continuous glucose data to reduce hypoglycemia in diabetes.2–4 19 20
In contrast, the reduction in hyperglycemia appeared more gradual, suggesting that this is a more complicated process and requires additional input by the patient, healthcare professional or both parties. Moreover, the more impressive reduction in hyperglycemia in high-frequency scanners indicates that regular glucose data are needed in order to effectively tackle hyperglycemia,1 which can be particularly difficult in individuals relying on sporadic SMBG for their diabetes management. We have observed that once the improvements in glycemic markers have taken place, these were sustained over a period of 6 months, indicating that continued system use is able to maintain the changes in glycemic parameters.
Strengths of the work include conducting the analysis under real-life settings, the large number of readers investigated and the comprehensive assessment of hyperglycemia and hypoglycemia. However, there are a number of drawbacks that should be acknowledged. First, given the analysis was conducted on deidentified data, we have no details on these patients and therefore age, gender, type of diabetes or hypoglycemic therapies are unknown. Second, this was an observational study in patients using the flash glucose monitor that may have selected a particular group of motivated individuals, which in turn may question generalizability of the results. Third, demonstrating a sustained effect over 6 months is encouraging but longer term follow-up will help to understand the clinical use of the device in the long run. Finally, it is unclear whether these glycemic benefits translate into improved clinical outcomes and long-term longitudinal outcome studies are warranted to address this point.
In conclusion, our data show that flash glucose monitoring, under real-life conditions, significantly improves glucose control in subjects at high risk of dysglycemia. The improvement in clinically significant hypoglycemia with system use is immediate whereas hyperglycemia takes longer to improve with both improvements being sustained over a period of 6 months. High-frequency scanners further benefit by minimizing hyperglycemic exposure in these high-risk groups of patients.
References
Footnotes
Presented at Portions of these data were presented at the 11th International Conference on Advanced Technologies and Treatments for Diabetes, Vienna, Austria, 14–17 February 2018.
Contributors SJ, TD, YX, GH, and RAA designed the study. SJ and YX performed the data analysis. SJ, TD, YX, GH, and RAA all critically reviewed the manuscript and provided intellectual content and feedback. All authors reviewed the manuscript before submission. SJ is the guarantor of the study and takes responsibility for the content of the article.
Funding This work was funded by Abbott Diabetes Care.
Competing interests SJ, TD, YX, and GH are employees of Abbott Diabetes Care. RAA received honoraria and research support from Abbott Diabetes Care but none in relation to the development of this work.
Patient consent Not required.
Provenance and peer review Not commissioned; externally peer reviewed.
Data sharing statement Supporting data sets analyzed for the current study are available from the corresponding author on reasonable request.