Article Text

Abstract
Background For childhood onset type 1 diabetes (T1D), the pathogenesis of atherosclerosis is greatly accelerated and results in early cardiovascular disease (CVD) and increased mortality. However, cardioprotective interventions in this age group are not routinely undertaken.
Aims To document prevalence of cardiovascular risk factors from diagnosis of childhood T1D and their relationship with disease duration and ethnicity.
Methods Routinely collected clinical records for 565 children with T1D were retrospectively analyzed. Data were collected from diagnosis and at routine check-ups at pediatric diabetes clinics across Barts Health National Health Service Trust. Age at diagnosis was 8.5 years (0.9–19.4). Mean follow-up 4.3 years (0–10.8). 48% were boys and 60% were non-white. Linear longitudinal mixed effects models were used to evaluate relationships between risk factors and diabetes duration.
Results CVD risk factors were present at first screening; 33.8% of children were overweight or obese, 20.5% were hypertensive (elevated diastolic blood pressure (BP)) and total cholesterol, low-density lipoprotein-cholesterol and high-density lipoprotein-cholesterol were abnormal in 63.5%, 34.2% and 22.0%, respectively. Significant associations between diabetes duration and annual increases of body mass index (0.6 kg/m2), BP (0.1 SD score) and lipids (0.02–0.06 mmol/L) were noted. Annual increases were significantly higher in black children for BP and Bangladeshi children for lipids. Bangladeshi children also had greatest baseline levels.
Conclusions CVD risk factors are present in up to 60% of children at diagnosis of T1D and increase in prevalence during the early years of the disease. Commencing screening in younger children and prioritizing appropriate advice and attention to ethnic variation when calculating risk should be considered.
- Pediatric Type 1 Diabetes
- Cardiovascular Disease Risk
- Screening
- Ethnic Differences
This is an open access article distributed in accordance with the Creative Commons Attribution Non Commercial (CC BY-NC 4.0) license, which permits others to distribute, remix, adapt, build upon this work non-commercially, and license their derivative works on different terms, provided the original work is properly cited, appropriate credit is given, any changes made indicated, and the use is non-commercial. See: http://creativecommons.org/licenses/by-nc/4.0/.
Statistics from Altmetric.com
Significance of this study
What is already known about this subject?
Accelerated atherosclerosis in children diagnosed with type 1 diabetes results in earlier morbidity and mortality from cardiovascular disease (CVD).
What are the new findings?
Prevalence of modifiable CVD risk factors are high at diagnosis in all age groups. Rising levels of risk factors are associated with increasing diabetes duration but with significant ethnic variation.
How might these results change the focus of research or clinical practice?
A review of current UK screening recommendations to include younger children may enable earlier identification and management of CVD risk factors. Clinicians may consider more aggressive monitoring and management of risk factors in high-risk ethnic groups.
Introduction
Life expectancy for children and young people (CYP) with type 1 diabetes (T1D) is reduced by up to 13 years compared with the general population, with cardiovascular disease (CVD) the leading cause of death in adulthood.1–3 The landmark Adolescent Type 1 Diabetes Cardio-Renal Intervention Trial (AdDIT) showed that aortic intima-media thickness, which predicts CVD morbidity and mortality, is increased.4 Endothelial dysfunction, a commonly used surrogate marker for evolving atherosclerosis, has been noted in CYP with T1D from 5 years postdiagnosis.5 6 Furthermore, the 2017 England and Wales National Paediatric Diabetes Audit, one of the largest datasets of its kind, has found high prevalence of CVD risk factors in CYP with T1D.7 Excess deaths in T1D attributed to CVD begin to emerge in young adults under 25 years.8 This indicates that the pathogenesis of CVD in T1D is accelerated. However, no studies have documented the prevalence of CVD risk factors from diagnosis of T1D. This would be important as it may help inform the timing of cardioprotective intervention, which currently is at low rates in this age group.9
Adult incidence of CVD varies between different ethnicities, with minority groups having higher reported rates of both risk factors and events even after adjusting for disparities in healthcare, suggesting inherent factors and different response to treatment may be important.10–14 South Asian groups living in the UK are at particular risk, with the highest CVD mortality rates that also occurs at a younger age and lower levels of dyslipidemia and obesity,15–17 leading some to conclude this group has an increased atherogenic burden than other ethnicities.18 The American SEARCH for Diabetes in Youth group found rising lipid parameters with increasing disease duration, but there was no comment on ethnic variation, and as yet the relationship with other risk factors in CYP remains unexplored.19
We investigated the prevalence of CVD risk factors at diagnosis of T1D and their relationship with disease duration in a multiethnic group of CYP attending specialist pediatric diabetes care clinics.
Methods
Participants
We studied all CYP diagnosed with T1D attending routine health check-ups at three East London pediatric diabetes clinics across Barts Health National Health Service (NHS) Trust between 2005 and 2015. Patients received care in line with national recommendations,20 with clinical measures and sociodemographic data collected at diagnosis and during subsequent routine follow-up visits. CYP attended from diagnosis until transition to adult services (generally between 16 years and 18 years). The majority lived within surrounding local authorities, where there are high levels of ethnic diversity and socioeconomic deprivation.21 22 Assignment to T1D was made on clinical basis as antibodies were not documented for all children. Data analysis was retrospective and restricted to children diagnosed during the study period (2005–2010) where data for age, gender, ethnicity and glycated hemoglobin (HbA1c) was available, n=565 (figure 1). As the date of diagnosis was not the same for all children, the maximal length of follow up for each individual varied depending on when they were diagnosed during the study period. Further details for this cohort and the care delivered by the diabetes team have previously been described.23
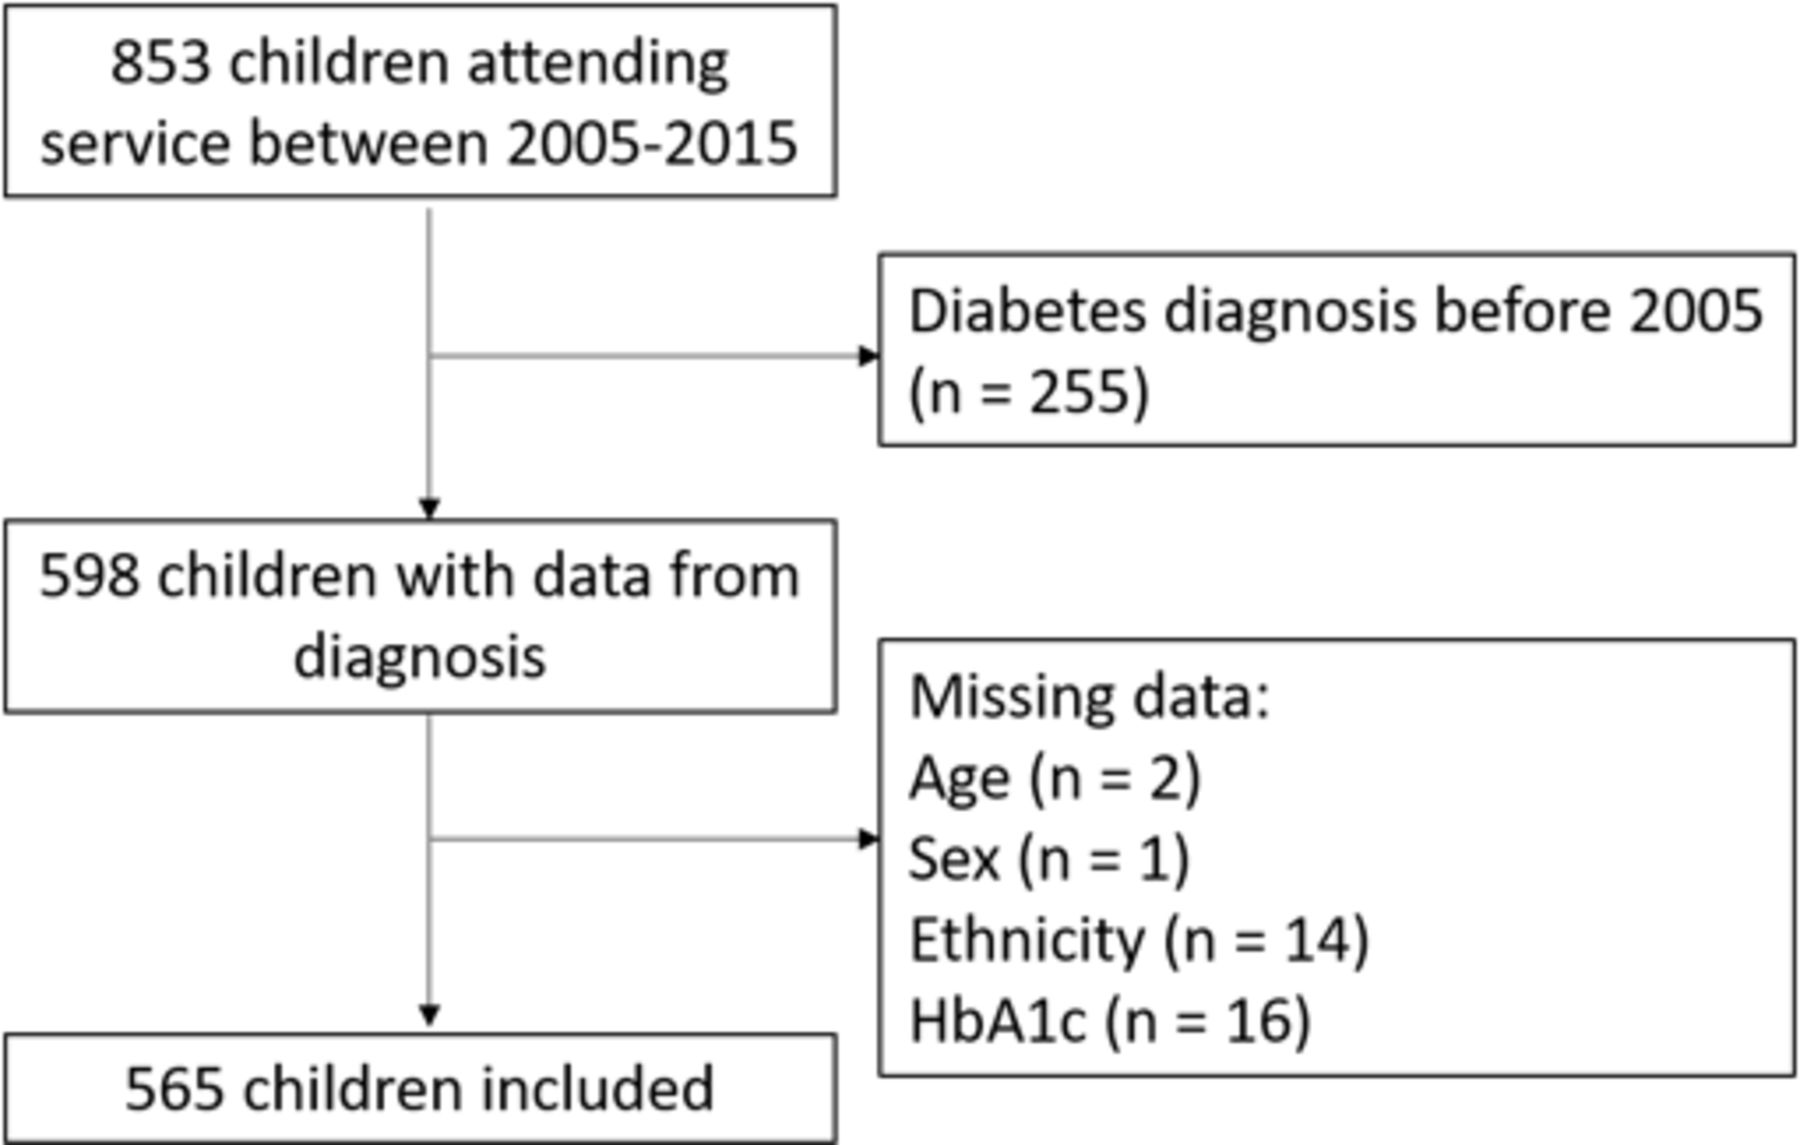
Flow chart of children in the database with exclusion criteria. HbA1c, glycated hemoglobin.
Main outcomes
Body mass index (BMI)
Anthropometry was measured in accordance with national guidance.24 25 BMI was calculated using the formula  . The first 3 months after diagnosis, where there is normalization to premorbid weight, was excluded.26 The distribution of BMI varies with age and sex27; therefore, it is usual to express this as a standard deviation score (SDS) and compare against a growth reference. The most commonly used in the UK is the British 1990 Growth Reference charts (UK90), which define overweight as between the 85th and 95th percentile (SDS +1.036 to +1.645) and obese ≥95th percentile (≥SDS +1.645).28 29
Blood pressure (BP)
BP was measured thrice with an appropriate size cuff sitting after a period of rest, using the Dinamap ‘Compact T’ Monitor (Critikon Ltd). The lowest value for systolic blood pressure (SBP) and diastolic blood pressure (DBP) were recorded. BP increases with both age and height; therefore, SDS based on these parameters were calculated.30 Established definitions were taken from the European Society for Hypertension guidelines; ‘High-normal’ BP was between the 90th and 95th percentile (SDS +1.280 to +1.645 and ‘hypertension’ >95th percentile (>SDS +1.645).31
Lipid profiles
Lipid profiles were generally non-fasted and measured on the Roche Cobas 8000 modular analyser. Profiles consisted of total cholesterol (TC), low-density lipoprotein (LDL), high-density lipoprotein (HDL) and triglycerides. Recommended levels of TC, LDL, HDL and triglycerides were <4.0, <2.6, >1.1 and <4.5 mmol/L, respectively.32 33
Covariates
Age at diagnosis was calculated in years by subtracting date of diagnosis from date of birth. Diabetes duration was calculated in years by subtracting the clinic visit date from the diagnosis date. HbA1c was measured using the point of care Siemens/Bayer DCA 2000+ analyser. Good and poor glycemic control was defined as <58 and >80 mmol/mol respectively, as per national guidelines for the study period.34 Ethnicity was defined by self-report and grouped to reflect the local ethnic mix into six broad groups: white, mixed-ethnicity, African-Somali, black-other, Bangladeshi and Asian-other (predominantly South Asian).
Data analysis
Baseline characteristics across the population were examined. Prevalence of abnormal measure and associations between the outcomes of interest and hypothesized covariates; age at diagnosis, gender, ethnicity, clinic and HbA1c were investigated using simple regression models at diagnosis and the population mean follow-up (4 years). Categorical variables were compared using χ2 tests.
Longitudinal modeling analysis
The raw data for each outcome was reviewed, and the relationship with diabetes duration was found to be linear. Associations between outcomes of interest and diabetes duration were assessed using linear mixed effects modeling (growth curve analysis). All measurements for each of the outcomes over the full 10-year study period were included. Triglycerides were non-normally distributed and were log transformed before analysis. Model 1 was the unadjusted growth model using diabetes duration as the temporal metric. Subsequent models were adjusted for additional hypothesized covariates, namely: (model 2) age at diagnosis, gender, ethnicity and diabetes clinic, (model 3) additionally HbA1c, (model 4) additionally height when analysing non-SDS BP measures only. Socioeconomic score was considered, but previous studies of this cohort identified little heterogeneity in levels of deprivation within this group.23 We also tested for potential interactions between ethnicity and diabetes duration in all models but found no significant effect; we therefore report models without interactions. Triglycerides were back transformed and expressed as percentage change. Subgroup analysis on children over 12 years was undertaken for BP and lipids, as screening practices differed between diabetes clinics for these variables in relation to national guidance.20 We plotted growth curves for all outcomes at the group level (ie, ethnicity) to visualize model fit.
Stata V.14 was used for all data analysis.
Ethics
All participants were anonymized making them unidentifiable. The study is registered with the Research and Development Office, GOS Institute of Child Health, UCL (University College London) (Project number 14PP08). All appropriate permissions were obtained from the relevant pediatric diabetes clinics, Barts NHS Trust.
Results
Study population
Demographic data and a summary of the clinical outcomes by covariates are displayed in table 1.
Characteristics of the study population (n=565) diagnosed with type 1 diabetes between 1 January 2005 and 31 December 2015
Mean age at diagnosis was 8.5 years (range 0.6–19.4). Mean or median age at first documented screening for BMI, BP and lipids was 9.3, 9.9 and 11.1 years, respectively, although there was significant variation in documented practice between diabetes clinics (8.8–13.3 years, p<0.01). Average length of follow-up was 4.3 years (<1–10.8) with typically four contacts per year (1–14/year). 44% were diagnosed during the last 4 years of the study period. Additionally 31% of children were aged 16 years or older at the time of their last contact and therefore will have transitioned to adult services, reducing the length time in which they were in included within this cohort. 48% were male and 60% were non-white, with high proportions of Bangladeshi (8.1%) and Somali (8.0%) children, allowing these groups to be analysed separately. Mean HbA1c was 93.6 mmol/mol at diagnosis and 73.9 mmol/mol at 4 years, resulting in 28.8% classed as poor control at follow-up. HbA1c varied by ethnicity with all minority groups averaging higher levels compared with the white group, and significant differences noted at 4-year follow-up in the mixed ethnicity, black and Bangladeshi groups (p<0.01).
Body mass index
94.7% of children had documented anthropometry measurements, taken on average three times per year (range 1–9/year). Mean BMI at diagnosis was 18.9 kg/m2 (+0.6 SDS) and 20.0 kg/m2 (+0.5 SDS) at 4-year follow-up. Prevalence of unhealthy weight (BMI >85th percentile) was 33.8% and 34.8% at diagnosis and follow-up. Black children had the highest mean BMI at diagnosis (21.2 kg/m2/+1.5 SDS) and 4-year follow-up (21.8 kg/m2/+1.1 SDS) (p<0.01).
Blood pressure
78% of children had BP documented during the study period averaging thrice yearly (range 1–8/year). There was low prevalence of systolic hypertension, but abnormal DBP was 20.5% at diagnosis, rising to 31.7% at 4-year follow-up. No significant ethnic variation was noted.
Lipids
These were measured annually (range 1–3/year). Documentation of screening commenced later than other variables resulting in 65% whom had lipids recorded over the study period. Prevalence of abnormalities in TC and LDL were high at diagnosis and 4-year follow-up; 71% of TC levels were above recommendations, and 6% of LDL measures reached treatment threshold. There was no significant difference in frequency of dyslipidemia between younger children and those aged over 12 years. Rising TC and LDL correlated with poorer glycemic control (p<0.05). Bangladeshi children had the highest TC and LDL at 4-year follow-up, reaching statistical significance for TC only (5.1 mmol/L in Bangladeshi vs 4.2 mmol/L in white CYP for TC, p<0.05; table 1).
The frequency of abnormal measures for each outcome was compared before and after 12 years of age. Rates of target DBP fell from 79% to 61% in older CYP (p<0.001), but no difference in prevalence was found for the other variables.
Longitudinal modeling analysis
In the fully adjusted models (model 3; age at diagnosis, gender, ethnicity, diabetes clinic and HbA1c Model 4; additionally adjusted for height for non-SDS BP), there was a positive relationship between all investigated outcomes and increasing disease duration, other than triglycerides (table 2). Model 1 (unadjusted) and model 2 (adjusted for HbA1c) marginally attenuated the coefficients for some variables (online supplementary tables 1–3). The mean number of recordings per child included in each model were BMI 11 (range: 1–36), BP 8 (range: 1–33) and lipids: 3 (range: 2–11).
Supplemental material
Mixed-effects models for change in cardiovascular disease risk factors during 10 years of follow-up from diagnosis of type 1 diabetes in children attending pediatric diabetes clinics in East London
For each year of diabetes BMI increased 0.6 kg/m2 (95% CI 0.6 to 0.7), and BMI SDS rose annually by 0.005 (−0.023 to +0.045; table 2) approximately equal to one percentile on a growth chart, although this was not statistically significant. The annual increase of BP SDS was +0.10 (95% CI +0.08 to +0.12; table 2) for systolic and +0.09 (95% CI +0.0 to +0.11; table 2) for diastolic. These BP SD scores are calculated by age and height and therefore take into account the increase in BP to be expected with increasing age. A small but statistically significant rise in all of the lipid parameters other than triglycerides was also found: 0.06 (95% CI 0.05 to 0.1), 0.02 (95% CI 0.01 to 0.04), 0.03 (95% CI 0.02 to 0.04) mmol/L/year for TC, LDL and HDL, respectively (table 2). Rising HbA1c had a positive effect on all coefficients other than BP and triglycerides.
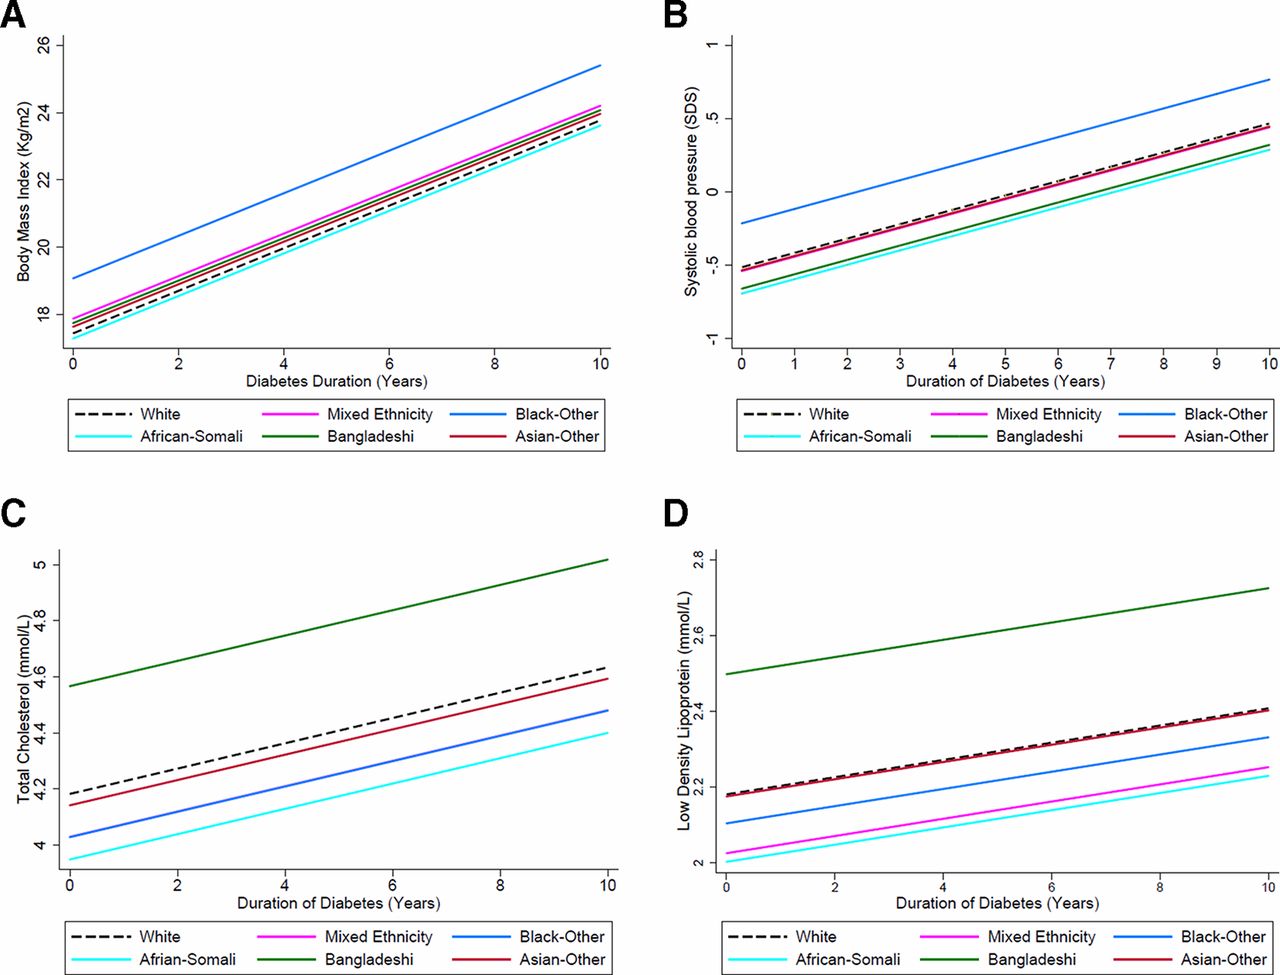
Significant ethnic differences were noted between outcomes and disease duration. In particular black CYP compared with white had the greatest annual increase in BMI 1.6 kg/m2 (95% CI 0.7 to 2.5) or +0.6 SDS (95% CI +0.3,+0.9), and SBP +0.3 SDS (95% CI +0.09 to +0.5) (figure 2A,B). The increase in lipids seen in the Bangladeshi compared with white CYP was also larger for both TC and LDL 0.38 mmol/L (95% CI 0.10 to 0.60) and 0.30 mmol/L/year (95% CI 0.07 to 0.52), respectively (figure 2C,D).
(A) Trajectories for change in body mass index from diagnosis by ethnicity in CYP with type 1 diabetes for fully adjusted model, demonstrating change in body mass index by ethnicity with increasing diabetes duration. (B) Growth curve for fully adjusted model, demonstrating change in systolic blood pressure SD scores by ethnicity with increasing diabetes duration. (C) Growth curve for fully adjusted model, demonstrating change in total cholesterol by ethnicity with increasing diabetes duration. (D) Growth curve for fully adjusted model, demonstrating change in low density lipoprotein by ethnicity with increasing diabetes duration. CYP, children and young people.
Results of the subgroup analysis in CYP aged 12 years or older were based on a smaller sample of patients (n=230–296) and included fewer data points per child: BP 6 (1–25) and lipids 2 (1–8) (online supplementary table 4). The estimates for all outcomes were similar as for the whole cohort (table 2) but only reached statistical significance for BP. However, the ethnic differences in lipid parameters were more pronounced, with annual increments in Bangladeshi children of 0.55 mmol/L (95% CI 0.25 to 0.85) and 0.42 mmol/L (95% CI 0.15 to 0.68) for TC and LDL, respectively.
Discussion
This study was able to evaluate the prevalence of recognized CVD risk factors from diagnosis in CYP with T1D, as well as the relationship of these with both ethnicity and disease duration of up to 10 years. Prevalence of obesity and dyslipidemia was above national reported levels and were high at both diagnosis and follow-up.35 Such abnormalities contribute to the development of atherosclerosis by increasing cardiac remodeling and endothelial dysfunction36 37 and strongly predicts risk factors continuing into adulthood.38–40 There was no difference in prevalence of most risk factors between older or younger CYP. Screening is not advocated in children under 12 years in the UK, and NICE gives no specific management recommendations20 yet abnormalities are likely to contribute to the development of atherosclerosis below this age.38
Black and Bangladeshi CYP had the highest BMI, consistent with national obesity reports.29 Bangladeshi CYP also had the highest lipids despite not being the heaviest at follow-up. Lipid abnormalities are common in South Asian adults, particularly in Bangladeshi groups where this is independent of obesity.12 The risk of CVD in South Asians with type 2 diabetes is also increased at lower lipid levels, making any increase in lipids in this group more concerning.16
Relationship with disease duration
Almost all variables rose with cumulative disease duration, with BMI and BP having the most significant rise across the entire population. Levels of hypertension and obesity are higher in CYP with T1D compared with healthy peers.4 41 Black children were noted to have the highest increment for SBP, in keeping with an American cohort where African-American CYP with T1D were more likely to have hypertension at 3-year follow-up.42
There were smaller increases noted in lipids for the population as a whole in keeping with a recent large American cohort. The cumulative effect of this with ongoing diabetes is a concern.19 Furthermore, rising levels of vascular resistance in CYP with increasing diabetes duration is particularly linked to LDL levels.43 The increase in TC and LDL was most significant in the Bangladeshi group, particularly older CYP. South Asian adults have a higher atherogenic burden at any given level of LDL, making this a particular concern.16
Strengths and limitations
This study was undertaken in the largest NHS Trust in the UK and was able to include data from a large group of children attending the pediatric diabetes service over a 10-year period. Although the National Paediatric Diabetes Audit report includes the incidence of CVD risk factors annually,35 the data collection in our study allowed for the inclusion of multiple longitudinal measurements meaning prevalence from diagnosis and small incremental changes in risk factors could be identified. Individuals with a varying number of data points were able to be included, as longitudinal growth curve analysis is ideal for use in an open cohort such as this. Similar examinations of CVD risk factors in American cohorts have been reported, but to our knowledge no such UK groups has yet been described.19 42 Our cohort included a large proportion of non-white subjects that enabled us to study ethnic differences in CVD risk factors with adequate power. An earlier study exploring ethnic differences in CVD risk factors in America used broader ethnic groups that are less relevant to the UK population.42 Additionally, we were able to break down wider ethnic categories to examine the Bangladeshi and Somali groups, which have not been studied separately before. By analysing these independently, we identified the unfavourable lipid changes within the Bangladeshi group that would otherwise have been lost.
When analysing outcomes at 4-year follow-up, data were available for 46% of CYP. This was primarily due to the open nature of our cohort meaning the maximum length of routine follow-up varied between individuals, although other reasons for CYP leaving the service cannot be excluded. The ethnic composition of the cohort remained fairly stable throughout follow-up. Measures were included for all age groups. The majority of BP and lipid measurements in children below the age at which NICE states screening must be commenced were recorded by one diabetes unit, where this was routine practice. However, this may not offer a full representation in this age group.20 There was no significant difference noted in levels of dyslipidemia between older and younger CYP. Diabetes antibodies were not universally tested; therefore, it is possible that some of our cohort may be misdiagnosed as T1D. We also acknowledge that our cohort is not nationally representative and so care should be taken when interpreting these results in the context of other diabetes centres. Subgroup analysis of children over 12 years lacked power in variables that were measured annually despite the large cohort. No corrections for multiple significance testing were made as in the context of multiple different hypotheses regarding different CVD risk factors and their trajectories over time these are rarely appropriate.44
This study has not been able to explore all recognized modifiable CVD risk factors.17 45 Albuminuria is an independent predictor of adult CVD morbidity, and rising albumin–creatinine ratios remaining within the normal range increase arterial stiffening in adolescents with T1D.46 47 However, due to lack of reliability of this variable in the database, it was not possible to include this in our analysis. No comparison group was available for our cohort to confirm causality. However, a recent Scandinavian cohort of healthy CYP found concentrations of TC and LDL were highest in younger children compared with adolescents, suggesting the annual increments of these variables noted within our group is not reflective of age related variation.48 No information was available regarding any intervention received for abnormalities in any CVD risk factors identified, although previous studies suggest they likely remained untreated.9
Implications for the future
Our observations indicate a more focused approach to CVD prevention is required, including for those aged under 12 years. This would include prioritizing advice for a healthier approach to nutrition and exercise in addition to discussions about glycemic control. The ADA (American Diabetes Association) position statement clearly advises on undertaking detailed dietary modification and increased exercise, particularly in the presence of abnormal CVD risk factors.45 It also recommends earlier and more frequent monitoring than the UK and consideration that for certain risk factors rising levels that remain within the normal range are associated with increased future risk. High prevalence of CVD risk factors in CYP at diagnosis of T1D and further increases with cumulative diabetes duration leads one to question whether earlier intervention with medical therapies could reduce CVD events. Although use of statins in CYP is safe, they are not approved for children aged under 10 years, and the AdDIT team did not identify any reduction in the progression of atherosclerosis over 2–4 years of administration.49 50 Perhaps the benefits for the whole population are too small to be seen over this time period, but in those in whom the rise in lipids and CVD risk is higher, such as Bangladeshi CYP, earlier intervention than the current recommendations may have a measurable effect. Clustering of CVD risk factors is common with T1D and increases the likelihood of these tracking into adulthood, compounding the risk of developing atherosclerosis.38 39 45 Future studies focusing on whether clustering of risk factors also varies between ethnic groups may further inform individual risk predictions and thresholds for intervention between ethnicities.
Conclusions
There was high prevalence of abnormal modifiable CVD risk factors from diagnosis in this population of CYP with T1D, including children younger than current UK screening recommendations, questioning whether this age guidance should be reviewed. Increasing diabetes duration and poor glycemic control were associated with rising levels of most risk factors, particularly in Bangladeshi and black ethnic groups. Further clinical trials are needed to determine whether aggressive treatment of risk factor, such as increased monitoring or earlier pharmacological management in ethnic minority groups particularly at high risk of developing CVD is warranted. Any intervention leading to the improvement in these risk factors during early childhood has the potential for the highest impact on reducing future CVD events.
Acknowledgments
We would like to acknowledge the diabetes teams of Barts Health National Health Service Trust and especially Dr Claire Hughes (Royal London Hospital), Dr Abdul Moodambail (Newham University Hospital) and Dr Paramita Cifelli (Whipps Cross Hospital) for approving the study and facilitating access to data.
References
Footnotes
Presented at This work has been presented at the following meetings: Royal College of Paediatrics and Child Health Conference, March 2018; 1st World Congress on Migration, Ethnicity, Race and Health. May 2018 ; ISPAD 44th Annual Conference, October 2018 (poster presentation).
Contributors SJ and RA conceived the research question. SJ and AK researched the data. SJ wrote the manuscript with contributions from RA and AK and EFG and TS.
Funding ARK is funded by the Children’s Policy Research Unit at GOS Institute of Child Health.
Competing interests None declared.
Patient consent for publication Not required.
Provenance and peer review Not commissioned; externally peer reviewed.
Data availability statement All data relevant to the study are included in the article or uploaded as supplementary information.