Article Text

Abstract
Objective To determine whether diabetes prevalence and incidence has remained flat or changed direction during the past 5 years.
Research design and methods We calculated annual prevalence and incidence of diagnosed diabetes (type 1 and type 2 combined) for civilian, non-institutionalized adults aged 18–79 years using annual, nationally representative cross-sectional survey data from the National Health Interview Survey from 1980 to 2017. Trends in rates by age group, sex, race/ethnicity, and education were calculated using annual percentage change (APC).
Results Overall, the prevalence of age-adjusted, diagnosed diabetes did not change significantly from 1980 to 1990, but increased significantly (APC 4.4%) from 1990 to 2009 to a peak of 8.2 per 100 adults (95% CI 7.8 to 8.6), and then plateaued through 2017. The incidence of age-adjusted, diagnosed diabetes did not change significantly from 1980 to 1990, but increased significantly (APC 4.8%) from 1990 to 2007 to 7.8 per 1000 adults (95% CI 6.7 to 9.0), and then decreased significantly (APC −3.1%) to 6.0 (95% CI 4.9 to 7.3) in 2017. The decrease in incidence appears to be driven by non-Hispanic whites with an APC of −5.1% (p=0.002) after 2008.
Conclusions After an almost 20-year increase in the national prevalence and incidence of diagnosed diabetes, an 8-year period of stable prevalence and a decrease in incidence has occurred. Causes of the plateauing and decrease are unclear but the overall burden of diabetes remains high and deserves continued monitoring and intervention.
- adult diabetes
- incidence
- public health/surveillance
This is an open access article distributed in accordance with the Creative Commons Attribution Non Commercial (CC BY-NC 4.0) license, which permits others to distribute, remix, adapt, build upon this work non-commercially, and license their derivative works on different terms, provided the original work is properly cited, appropriate credit is given, any changes made indicated, and the use is non-commercial. See: http://creativecommons.org/licenses/by-nc/4.0/.
Statistics from Altmetric.com
Significance of this study
What is already known about this subject?
Following an almost two-decade steady increase in national prevalence and incidence of diagnosed diabetes, there was an overall plateau from 2008 to 2012.
What are the new findings?
The prevalence of diagnosed diabetes in the USA has remained stable during the past 8 years while the incidence has declined.
How might these results change the focus of research or clinical practice?
Causes of the plateauing of prevalence and decrease in incidence are unclear and although the trends are encouraging, the overall burden of diabetes remains high and warrants continued intervention and monitoring.
Introduction
The doubling of the prevalence and incidence of diagnosed diabetes in the USA during the 1990s and most of the 2000s is one of the country’s most concerning public health threats because of the large segments of the population affected and the diverse morbidity that results.1 2 This increasing diabetes burden is thought to have resulted from increases in obesity prevalence, qualitative and quantitative changes to diet, changing levels of non-leisure physical activity, and to some extent, changing awareness, diagnosis, and diagnostic criteria.3 4 However, the first sign of a plateau in the national prevalence and incidence of diabetes was reported based on national surveillance data from 1980 to 2012, where no continued increase in either prevalence or incidence was detected from 2008 to 2012.1 Observations of a flattening in prevalence and incidence were corroborated by the Behavioral Risk Factor Surveillance System (BRFSS) county and state-level estimates,2 and by prevalence of total diabetes (diagnosed and undiagnosed combined) and obesity in the National Health and Nutrition Examination Survey.4 However, two important ambiguities in the findings remained. First, incidence rates from 2010 to 2012 were numerically lower than the prior 3 years, but there was no statistically significant decline in trends. Second, there were potentially important demographic disparities, as prevalence continued to increase among young adults, those with a lower education, and non-Hispanic black and Hispanic populations. In the current report, we assemble 5 additional years of data to determine whether rates of diabetes prevalence and incidence have changed.
Methods
Data source and measurements
We used 1980–2017 cross-sectional survey data from the National Health Interview Survey (NHIS) to evaluate trends in prevalence and incidence of diagnosed diabetes among the non-institutionalized, US civilian population aged 18–79 years. NHIS is a nationally representative, in-person household survey that relies on self-reported behaviors and medical conditions.5 Prior to 1997, respondents were asked whether anyone in the family had diabetes during the past 12 months. Starting in 1997, respondents were asked, other than during pregnancy, whether a healthcare professional had told them that they had diabetes. NHIS does not distinguish between types of diabetes.
Prevalence each year was calculated by dividing the number of adult respondents who reported having diagnosed diabetes by the total adult sample. Prior to 1997, incident cases were considered those respondents who affirmed having diabetes during the past 12 months. Starting in 1997, for respondents who reported having diabetes, incident cases were identified by subtracting the respondent age at the interview from age of diabetes diagnosis. All respondents with a value of 0 and half with a value of 1 (to account for having a birthday during the first year of diabetes diagnosis) were considered incident cases. We calculated the incidence each year by dividing the number of incident cases by the adult sample, after excluding respondents with diabetes for more than a year.
Statistical analysis
We reported the characteristics of survey respondents over time by age group, sex, race/ethnicity, and education level (<high school, high school, >high school). Estimates were weighted to reflect the adult, non-institutionalized US population and we used the 2000 US Census for age adjustment using age groups 18–44, 45–64, and 65–79 years. We used SAS-Callable SUDAAN (RTI International) to account for the complex sampling design and Joinpoint Trend Analysis Software V.4.5.0.1 to analyze trends in prevalence and incidence, overall (1980–2017) and by age group, sex, race/ethnicity, and education level (1990–2017). We also analyzed incidence trends by race/ethnicity, stratified by two levels of education (≤high school, >high school). Joinpoint Trend Analysis identifies statistically significant changes in linear trends (direction or magnitude) and calculates the annual percentage change (APC) for each identified time segment. We set a maximum limit of three joinpoints and considered values statistically significant if they had a two-sided p value <0.05. Race/ethnicity analyses were restricted to the years 1999–2017 because of small sample sizes in some groups before 1999.
Results
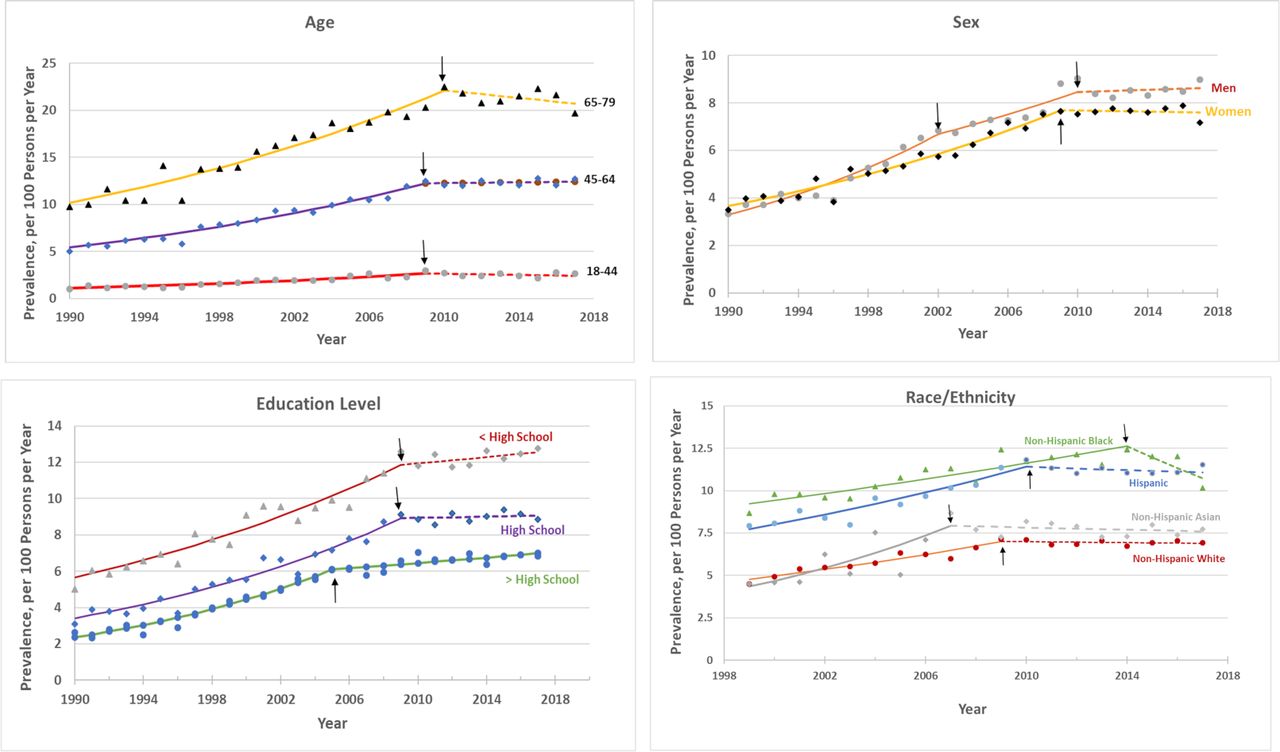
Table 1 displays an older age, more racially diverse, and more educated non-institutionalized, civilian, US population over time. Overall, the prevalence per 100 adults of age-adjusted, diagnosed diabetes did not change significantly from 1980 (3.5 (95% CI 3.3 to 3.8)) to 1990 (3.4 (95% CI 3.1 to 3.8)) (p=0.50), but then increased significantly 4.4% per year from 1990 to 2009 to a peak of 8.2 per 100 adults (95% CI 7.8 to 8.6) (p<0.001) (figure 1). Subsequently, the overall age-adjusted prevalence plateaued (APC −0.3% (p=0.53)) and was 8.0 per 100 adults (95% CI 7.6 to 8.4) in 2017, representing 21 072 000 adults. The trends in diagnosed diabetes prevalence among demographic subpopulations including age groups, sex, education, and race/ethnicity were similar to the overall age-adjusted prevalence with plateaus in the 2009–2010 through 2017 period (figure 2). Adults with more than a high school education were an exception to this trend as prevalence continued to increase slowly from 2005 to 2017 (APC 1.1% (p=0.005)) while adults with a high school education or less than high school education experienced a plateau. However, the overall prevalence of diabetes in adults with less than a high school education remained approximately double that of those with more than a high school education (figure 2).

Trends in age-adjusted diagnosed diabetes prevalence and incidence among adults aged 18–79 years, 1980–2017. Data are from the Centers for Disease Control and Prevention’s (CDC) National Health Interview Survey. Dots are observed annual values; the lines are modeled using Joinpoint Trend Analysis Software. The dotted lines indicate no significant trend; solid lines indicate a significant annual percentage change. Arrows indicate joinpoints (changes in trend). The 2000 US Census was used for age adjustment using age groups 18–44, 45–64, and 65–79 years.

Prevalence of diagnosed diabetes among adults aged 18–79 years by demographic variables, 1990–2017. Data are from the Centers for Disease Control and Prevention’s (CDC) National Health Interview Survey. Dots are observed values; the lines are modeled using Joinpoint Trend Analysis Software. The dotted lines indicate no significant trend; solid lines indicate a significant annual percentage change. Arrows indicate joinpoints (changes in trend). The 2000 US Census was used for age adjustment using age groups 18–44, 45–64, and 65–79 years.
Characteristics of US adults aged 18–79 years*
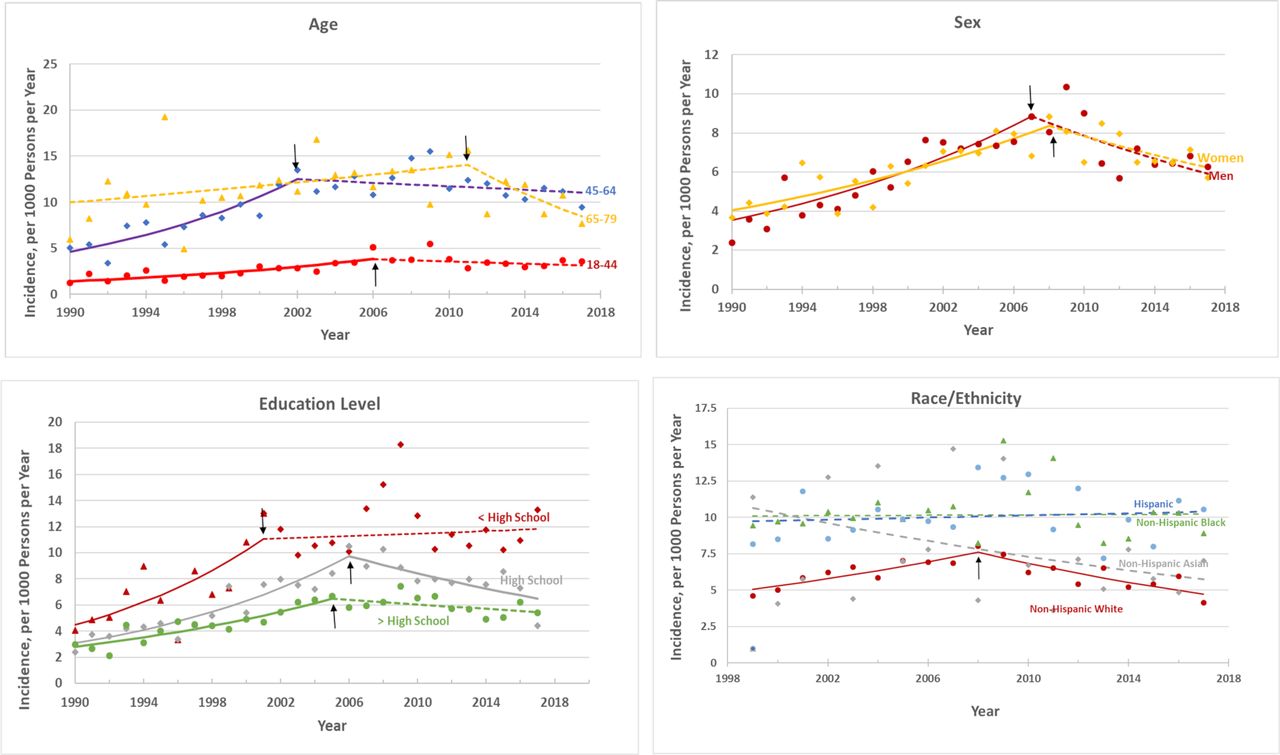
Overall, the incidence per 1000 adults of age-adjusted, diagnosed diabetes did not change from 1980 (3.6 (95% CI 2.8 to 4.6)) to 1990 (3.1 (95% CI 2.3 to 4.1)) (p=0.97), but then increased significantly from 1990 to 2007 to 7.8 per 1000 adults (95% CI 6.7 to 9.0) at an APC of 4.8% (p<0.001). Subsequently, the overall age-adjusted incidence decreased (APC −3.1% (p<0.001)) to 6.0 per 1000 adults (95% CI 4.9 to 7.3) in 2017 (figure 1). This corresponded to a decrease from approximately 1 726 000 cases per year in 2008 to 1 335 000 cases per year in 2017 (data not shown). Inspection of trends in population subgroups suggests that the decrease in incidence was driven primarily by non-Hispanic white adults whose incidence peaked in 2008 and then declined at an APC of −5.1% (p=0.002) through 2017 (figure 3). The trend for Asian adults was numerically similar but not statistically significant (APC −3.4% (p=0.06)). Similarly, inspection of age-stratified incidence trends suggests the decreasing incidence in the overall population was most influenced by the population aged 65–79 years, from 2011 to 2017, although their rate of decline was not statistically significant (APC −8.1% (p=0.09)). The stratified analysis of race/ethnicity by education level showed a downward trend in incidence during the past 10–12 years for non-Hispanic white adults for both education levels (online supplementary figure). The downward but non-significant trend for Asians was driven by the more than high school educated population. Although overall incidence did not change significantly from 1999 to 2017 for Hispanic adults, incidence increased among adult Hispanics with more than a high school education (APC 4.2% (p=0.02)).

Incidence of diagnosed diabetes among adults aged 18–79 years by demographic variables, 1990–2017. Data are from the Centers for Disease Control and Prevention’s (CDC) National Health Interview Survey. Dots are observed values; the lines are modeled using Joinpoint Trend Analysis Software. The dotted lines indicate no significant trend; solid lines indicate a significant annual percentage change. Arrows indicate joinpoints (changes in trend). The 2000 US Census was used for age adjustment using age groups 18–44, 45–64, and 65–79 years.
Discussion
Following an almost two-decade steady increase in national prevalence and incidence of diagnosed diabetes, we report an 8-year period of stable prevalence and a decrease in incidence. The decrease in incidence of diagnosed cases brings the rate to the same levels as the year 2000, representing a 35% decrease since the peak year of 2009. Subgroup analyses indicate that all age, sex, and race/ethnic groups have similarly flat trends in prevalence. The overall decrease in incidence appears to be dominated by the non-Hispanic white population. These analyses build on a prior report through 2012 data showing a plateau in prevalence and incidence but no significant decrease.1
The NHIS is the nation’s largest nationally representative health survey to assess diabetes incidence and provides a compelling indication that there may be success in the efforts to stem the US diabetes epidemic. These findings are also generally consistent with estimates from the BRFSS, where many states have also observed flat prevalence and decreasing incidence.2 The specific causes of the large decrease cannot be determined from these analyses. Efforts continue to reduce type 2 diabetes through the National Diabetes Prevention Program lifestyle change intervention, which includes targeted screening, as well as population approaches to improve healthy food availability, diabetes awareness and education, and walkability of communities.6 Trends in several risk factors for type 2 diabetes, including intake of added sugar, sugared beverages, total calories, and physical inactivity, peaked in the mid-2000s and either plateaued or decreased thereafter,7 8 consistent with the slowing in diabetes incidence. However, although these diet and activity-level changes are encouraging, their association with diabetes incidence trends is only ecological and no causal inference can be made at present. Furthermore, obesity and severe obesity trends have generally increased over the past 10 years and pre-diabetes remains unchanged and high, affecting 84 million US adults, or 34% of the US adult population.3 9
Given the reliance on diagnosed cases for diabetes prevalence and incidence in our analyses and the persistence of type 2 diabetes risk factors, the potential impact of changes in screening, testing, and diagnostic thresholds are also important considerations. A change in the American Diabetes Association (ADA)-based definition of diabetes in 1997 lowered the fasting glucose level and may have contributed to part of the increase in the late 1990s. Similarly, the 2010 ADA-based recommendation to use HbA1c in the diagnosis of diabetes could decrease incidence because it is a less sensitive indicator than the fasting glucose threshold, or alternatively, could increase incidence if its practicality leads to increased awareness and detection. Unfortunately, practices of screening, detection, and diagnosis of diagnosed diabetes are variable and not monitored well by national surveillance systems.
The disassociation of prevalence and incidence trajectories observed here is consistent with the large reductions in cardiovascular and all-cause mortality recently reported among adults with diagnosed diabetes.10 Extended lifespans of persons after they are diagnosed with diabetes likely contribute to the lack of reduction in prevalence. Saturation of diagnosed diabetes is also an important consideration.11 An increased emphasis on screening may have decreased the susceptible population, driving down incidence. However, according to the Centers for Disease Control and Prevention’s 2017 National Diabetes Statistic Report, in 2015, twenty-four percent of persons with diabetes were undiagnosed.9 Although this proportion may be inflated due to error in self-report,12 it still suggests that saturation has not been reached.
In addition to the reliance on self-reported diagnosed diabetes, our report is limited by an inability to reliably distinguish type 1 from type 2 diabetes. Also, limited statistical power prevented reliable estimates of trends among young adults and minority racial/ethnic groups to determine whether increasing incidence of both type 1 and type 2 diabetes observed in the SEARCH for Diabetes in Youth study is also affecting young adults.13 We did find a significantly increasing trend in incidence among Hispanic adults during the study period. Similarly, our estimates may obscure differential trends in geography and social class. Incidence has been flat in both the less than high school and more than high school educated populations for over a decade, but the less than high school educated population still has roughly double the incidence of diabetes. Although our plotted trends are consistent with the scenario in which non-Hispanic whites are driving the reduction in incidence, other race/ethnic populations could be affected by differences in detection.
In summary, using these national data, we report the longest period of a sustained plateau in prevalence since the 1980s and longest period of declining incidence ever. Although an encouraging sign of success, due to the persistence of major risk factors such as obesity and pre-diabetes, we caution that trends are likely affected by changing awareness, detection, and diagnostic practices. Even in the event of true reductions in incidence, the high prevalence and declining mortality signifies a continued high overall burden of diabetes. For these reasons, we urge a continued emphasis on multilevel, multidisciplinary prevention to reduce both type 2 diabetes and diabetes complications, along with improved surveillance of trends in screening and detection.
Footnotes
Contributors SRB and EG developed the study concept, interpreted the data, and drafted the manuscript. IH conducted the analysis. ALA participated in study design, interpretation of data, and critically revised the manuscript. All authors have read and approved the paper.
Funding The authors have not declared a specific grant for this research from any funding agency in the public, commercial or not-for-profit sectors.
Disclaimer The findings and conclusions in this report are those of the authors and do not necessarily represent the official position of the Centers for Disease Control and Prevention.
Competing interests None declared.
Patient consent for publication Not required.
Ethics approval Publicly available data were used for analysis; no institutional review board was required.
Provenance and peer review Not commissioned; externally peer reviewed.
Data sharing statement Data are available in a public, open access repository.