Article Text

Abstract
Objectives To identify real-world, age-related trends in the use of insulin glargine 100 U/mL (Gla-100) as part of basal-supported oral therapy (BOT).
Research design and methods The prospective, observational Titration and Optimization registry enrolled patients with poorly controlled type 2 diabetes mellitus initiated on Gla-100 BOT. The primary outcome was the proportion of patients with capillary fasting blood glucose (FBG) ≤110 mg/dL on ≥2 occasions and/or who met their individual HbA1c target within 12 months.
Results 2462 patients were analyzed (<65 years: n=1122; 65–74 years: n=771; ≥75 years: n=569). Diabetes duration (6.8, 8.9, and 11.2 years, p<0.0001) and proportion of women (40.7%, 47.9%, and 55.7%, p<0.0001) increased with age. Baseline HbA1c was highest in <65-year-olds (8.6% vs 8.4% and 8.5%, p<0.0001). Gla-100 up-titration until 12 months was highest in <65-year-olds (+11.6 U/day), compared with 65–74 (+10.2 U/day) and ≥75 years (+8.8; p<0.0001) but similar by units per kilogram, as was the decrease in FBG (<65: −64.1 mg/dL; 65–74: −56.1 mg/dL; ≥75: −53.4 mg/dL) and HbA1c (<65: −1.47%; 65–74: −1.31%; ≥75: −1.22%, p<0.0001). At 12 months, 65.9% of participants met the primary endpoint, with no significant difference between age groups. The proportion achieving their individual HbA1c target was lower for <65-year-olds (46.0% vs 54.3% and 54.7%; p<0.02). Symptomatic hypoglycemia incidence was more common in the ≥75-year-old group (3.4% vs 1.4% and 1.4%; p=0.0126).
Conclusions BOT with Gla-100 results in similar improvements of glycemic values with low risk of hypoglycemia across age groups. Given the link between HbA1c and long-term cardiovascular risk, ensuring appropriately stringent target-setting, intensification of basal insulin and making sure hypoglycemia is avoided is of paramount importance.
Trial registration number Database: https://awbdb.bfarm.de; Identifier: 1641; Date of registration: September 23, 2013
- basal-supported oral therapy
- glargine
- age
- HbA1c target
- hypoglycaemia
This is an open access article distributed in accordance with the Creative Commons Attribution Non Commercial (CC BY-NC 4.0) license, which permits others to distribute, remix, adapt, build upon this work non-commercially, and license their derivative works on different terms, provided the original work is properly cited, appropriate credit is given, any changes made indicated, and the use is non-commercial. See: http://creativecommons.org/licenses/by-nc/4.0/.
Statistics from Altmetric.com
Significance of this study
What is already known about this subject?
Guidelines emphasize the influence of age on appropriate HbA1c target-setting and insulin regimes in type 2 diabetes mellitus.
What are the new findings?
In this study, glycemic improvements after the initiation of insulin glargine 100 U/mL as part of basal-supported oral therapy were apparent in all age groups, and rates of symptomatic hypoglycemia were low.
Nevertheless, suboptimal rates of glycemic target attainment were apparent for all groups, especially HbA1c target achievement was observed in less than 50% of participants in the <65-year-old group, indicating a particular need to improve glycemic control in this younger population.
How might these results change the focus of research or clinical practice?
These results foster research into the hurdles to overcome when aiming to find an optimal balance between glucose control and a low risk of hypoglycemia in elderly patients.
Introduction
The global prevalence of type 2 diabetes mellitus (T2DM) is on the rise, with an additional 210 million individuals expected to have the disease in 2035 compared with 2013.1 This is largely due to the aging of populations, with advanced age a known independent risk factor for both developing the disease and experiencing associated complications.2–4
Guidelines pertaining specifically to older patients with diabetes emphasize the influence of age on the appropriacy of treatment regimens and the added importance of recognizing individual patient characteristics in this population.1 5 6 Indeed, elderly patients tend to be more comorbid and have more atherosclerotic vasculature, poorer kidney function, and shorter life expectancy.7 If the latter is shorter than 20 years, the cardiovascular advantages of stringent glycemic control may not have sufficient time to manifest,1 and intensive treatment to reach low HbA1c targets may consequently be more harmful than beneficial.8 Furthermore, patient mental state, functionality, and quality of support systems may dictate the feasibility of meeting such targets in elderly patients, especially where insulin administration is indicated. Therefore, guidelines suggest that individual glycemic targets may be relaxed as age increases (HbA1c 7.5%–8.0%; 58–64 mmol/mol), with prevention of hypoglycemia and quality of life particularly important aspects.5 6 Conversely, younger patients with long life expectancies and lower rate of comorbidities may be assigned a more stringent target (HbA1c 6.0%–6.5%; 42–48 mmol/mol), given the potential protective effect of intensive glycemic control against long-term microvascular complications and cardiovascular events.9 10
While the use of newer oral and non-insulin injectable antidiabetic drugs is on the rise, the Titration and Optimization (TOP) registry gathered data on patients with T2DM unsatisfactorily controlled on one or more oral antidiabetic drugs (OADs) who were being initiated on insulin glargine 100 U/mL (Gla-100). This addition of once-daily long-lasting basal insulin to existing OAD treatment is known as basal-supported oral therapy (BOT),11–13 and has been associated with greater target attainment and a lower risk of hypoglycemia compared with the addition of less-long-acting insulins (such as neutral protamine Hagedorn (NPH) and premixed insulin).14 In a previous TOP analysis, BOT with Gla-100 was shown to effectively improve glycemic control, with approximately two-thirds of patients reaching their individual HbA1c targets and/or a capillary fasting blood glucose (FBG) level of ≤110 mg/dL.15 In addition, a very low rate of hypoglycemia was observed. However, the effect of age on patient characteristics, titration behavior, and the associated degree of glycemic control has not been explored in this population. Such an analysis would shed further light on the impact of age in real-world T2DM treatment decisions and outcomes. In the present subanalysis of the TOP registry, we aim to evaluate the influence of age on Gla-100 treatment during the first 12 months after BOT initiation in patients with T2DM and to assess the corresponding effect on glycemic control, including hypoglycemia.
Materials and methods
Study design
The present study is a post hoc subanalysis of the prospective, observational TOP registry, which was carried out between October 2013 and October 2015 in Germany. The registry enrolled people with T2DM poorly controlled on OADs or on basal insulin/OAD combination therapy who initiated or were switched to Gla-100 at the discretion of the treating physician in a hospital setting and followed over a period of 12 months. The methods and main results of the registry have been previously published.15 A brief description is provided below.
Patient selection
People were included in the present analysis if they fulfilled the following criteria: age >18 years; a diagnosis of T2DM; baseline HbA1c 7.5%–10% despite taking OAD medication (±insulin); physician decision to initiate insulin Gla-100 independently from the registry and also had precise age information available. People already receiving basal insulin plus mealtime insulin (basal-bolus therapy) were excluded. For the present analysis, participants were stratified into three age groups according to their age at inclusion: <65-year-olds; 65–74-year-olds; ≥75-year-olds.
Documentation
On the day of Gla-100 initiation (baseline), patient demographics, glycemic values (HbA1c and FBG), prior insulin treatment and OAD medications were documented. A personal HbA1c target was assigned by the treating physician based on their clinical judgment, independently from the registry. Throughout the 12-month follow-up period, FBG and HbA1c levels, hypoglycemia events, and any titration of a patient’s Gla-100 were documented. At the final follow-up, changes to OAD medication since baseline were recorded.
Endpoints
Participants who achieved an FBG of ≤110 mg/dL on a minimum of two occasions and/or met their preassigned personal HbA1c target at least once during follow-up were considered to have met the primary efficacy endpoint. The proportions of people meeting these criteria in each age group were compared.
Secondary endpoints included changes to daily Gla-100 dosage over 12 months, absolute changes in HbA1c and FBG levels at 6 and 12 months, and requirement for a change of insulin therapy (ie, switching to an alternative basal insulin or insulin type) during the study. Rates of hypoglycemia (symptomatic; symptomatic and confirmed (blood glucose measurement of ≤70 mg/dL); nocturnal symptomatic or confirmed; severe symptomatic or confirmed (blood glucose measurement of ≤56 mg/dL); severe nocturnal symptomatic or confirmed) were also predefined secondary endpoints.
Statistics
For the present analysis, endpoint assessment was based on the full analysis set (those complying with all study inclusion/exclusion criteria with Gla-100 initiation <4 weeks before enrollment and availability of 12-month follow-up data). Patients were divided into groups according to age at study start. Data are presented using descriptive statistics, with categorical variables expressed as frequencies and continuous variables as means plus SD. A one-way analysis of variance, χ2 test or Fisher’s exact test (for rare events) were used to identify any statistically significant differences between the three age groups. A paired t-test was used to compare within-group differences in Gla-100 dose, FBG, and HbA1c at different time points. For the primary endpoint and its components, significant differences were further explored through two-group comparisons using a χ2 test. A p value of <0.05 was considered significant. All analyses were performed using SAS V.9.4.
Results
Of the 2470 eligible participants, 8 were excluded from this subanalysis owing to a lack of available age data. Most of the participants were found in the <65 years group (n=1122), followed by 65–74 years (n=771) and ≥75 years groups (n=569) (figure 1).
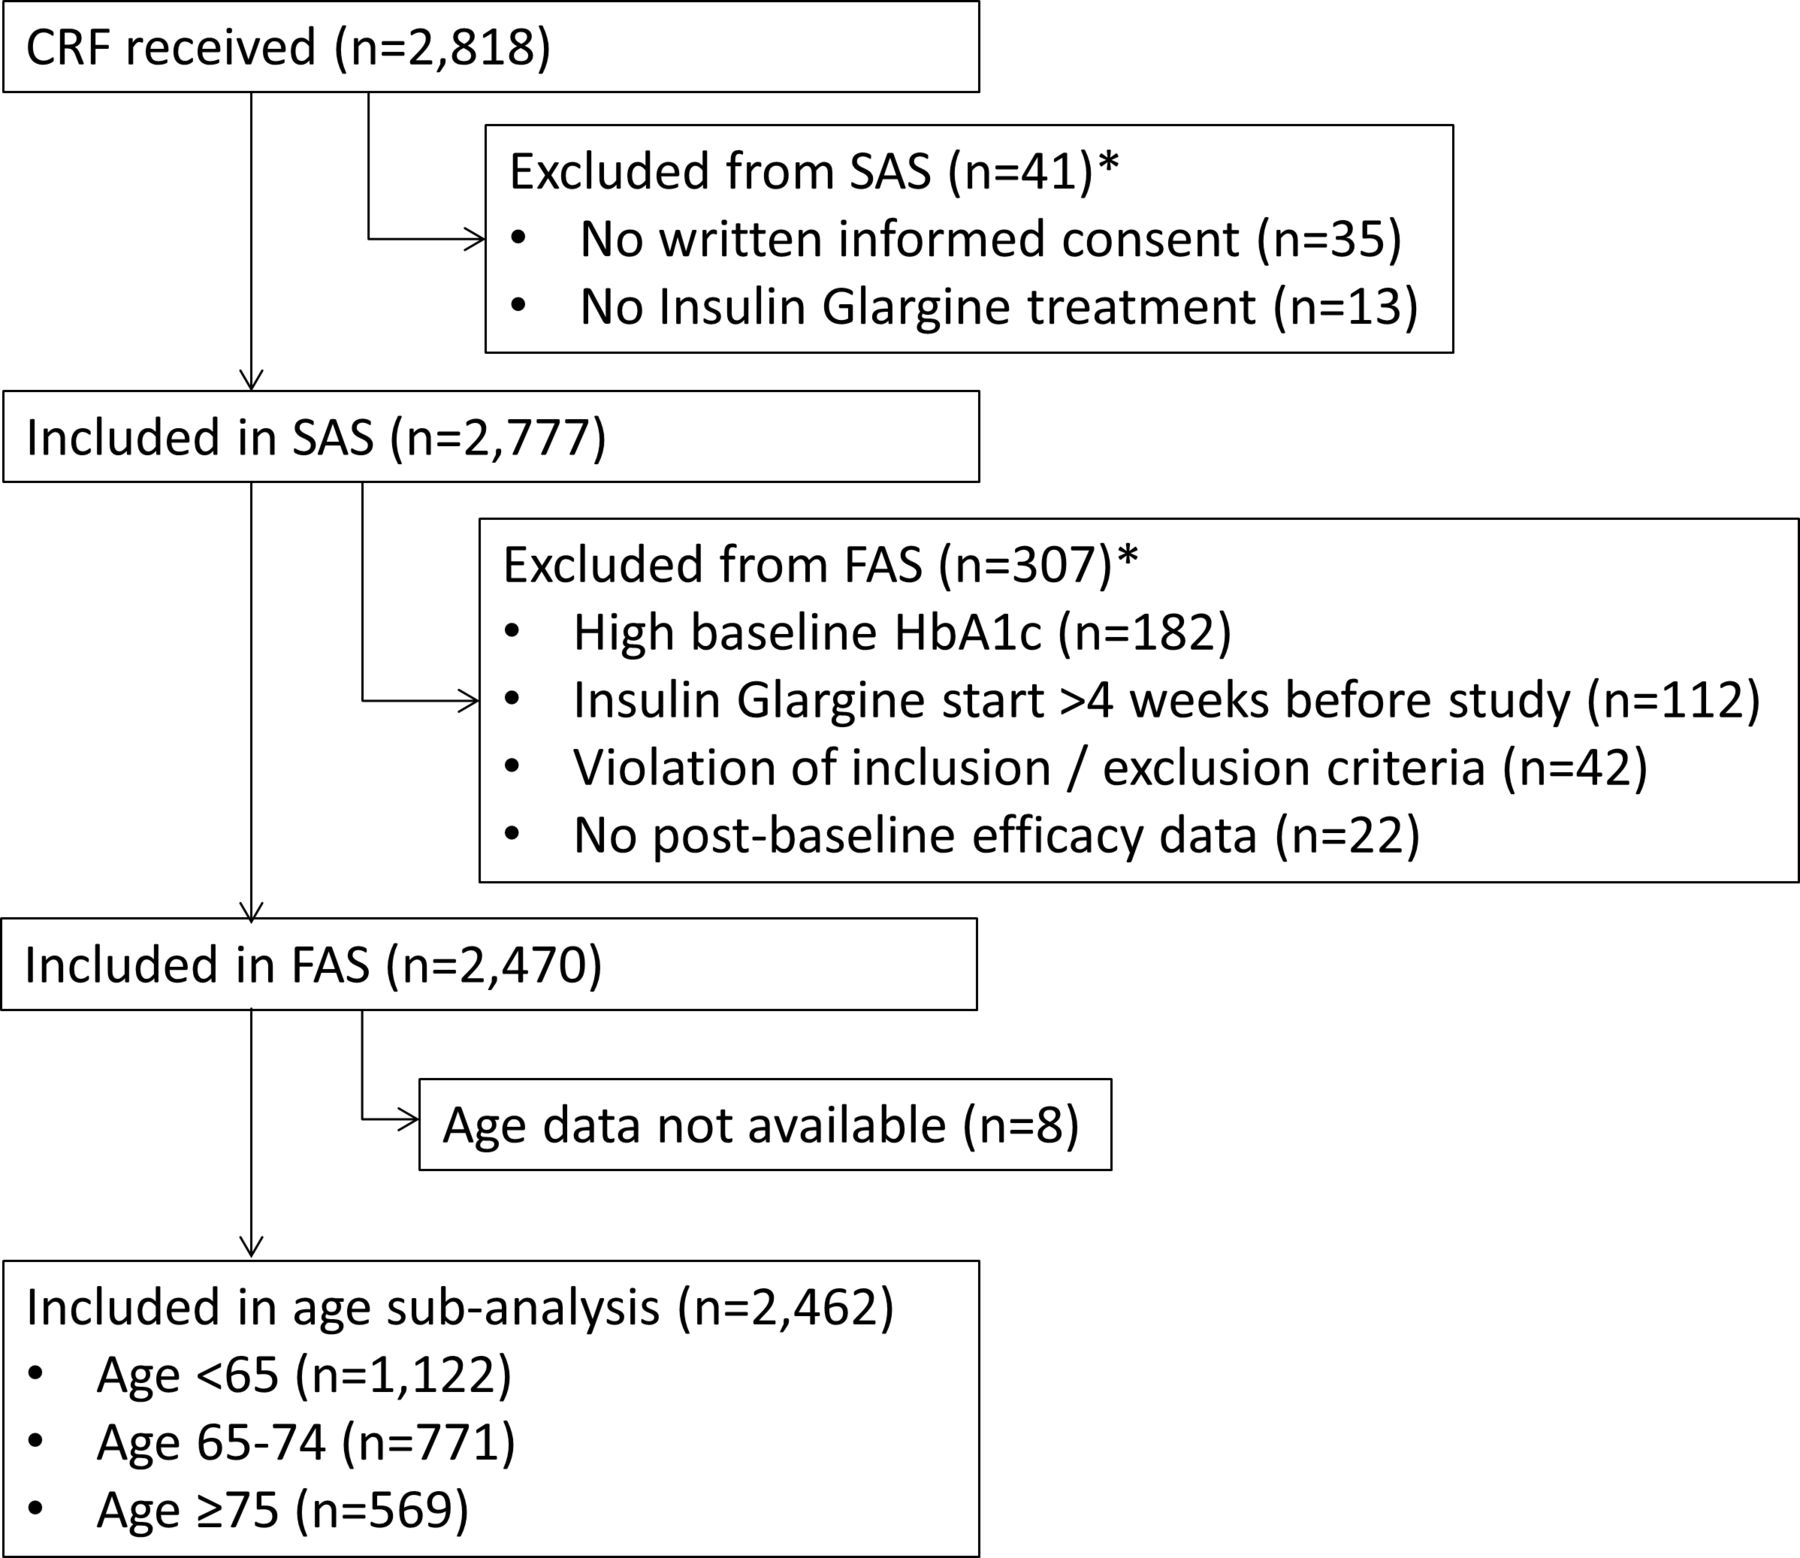
Patient flow for inclusion. *More than one reason could apply. CRF, case report form; FAS, full analysis set; SAS, safety analysis set.
Baseline characteristics
The mean age was 55.5±7.7 years in the <65 years group, 69.7±3.0 years in the 65–74 years group, and 79.3±3.9 years in the ≥75 years group (p<0.0001) (table 1). The proportion of women increased with increasing age group (40.7%, 47.9%, and 55.7%, respectively; p<0.0001), as did the diabetes duration (6.8±5.4, 8.9±6.1, and 11.2±7.2 years, respectively; p<0.0001). The inverse was observed for body mass index (32.0±5.6, 31.0±5.2, and 29.7±5.0 kg/m2, respectively; p<0.0001).
Patient characteristics and diabetes therapy at baseline and 12 months
Those aged <65 years had the highest glycemic values (186.5±41.2 mg/dL and 8.6%±0.8% (70±9 mmol/mol), respectively), followed by those aged ≥75 years (181.1±40.5 mg/dL and 8.5%±0.8% (69±9 mmol/mol)) and those aged 65–74 years (180.1±39.0 mg/dL and 8.4%±0.8% (68±9 mmol/mol)) (table 1). The mean physician-assigned HbA1c target was statistically lowest for <65-year-olds (6.8%±0.5% (51±5 mmol/mol)), followed by 65–74-year-olds (6.9%±0.4% (52±4 mmol/mol)) and ≥75-year-olds (7.1%±0.5% (54±5 mmol/mol); p<0.0001). However, in clinical terms, both baseline glycemic values and targets were fairly similar.
Antidiabetic medication at baseline
At baseline, the most common OAD was metformin, with the frequency of patients taking this medication falling across age groups (63.2%, 59.7%, and 53.3%, respectively; p=0.0004) (table 1). This trend was also seen for glucagon-like peptide-1 receptor agonists (GLP-1 RA; 2.1%, 0.8%, and 0.4%; p=0.0028). The inverse trend was true for DPP-4 inhibitors (DPP-4i) without metformin (23.7%, 28.3%, and 31.8%; p=0.0012) and sulfonylureas (13.2%, 18.7%, and 22.7%; p<0.0001). All other OADs were taken at low and comparable frequencies (<10%).
Prior to the decision to initiate Gla-100 therapy, the proportion of patients already on a basal insulin was low (8.7% overall) and did not differ between age groups (p=0.77; table 1). The most common basal insulin was NPH (5.2% overall) followed by insulin detemir (2.0% overall), with only 0.6% of all patients already taking insulin glargine. Prior use of rapid-acting insulin analogues only and premixed insulins were rare (<1% in each case) as per exclusion criterion.
Antidiabetic therapy over the 12-month follow-up
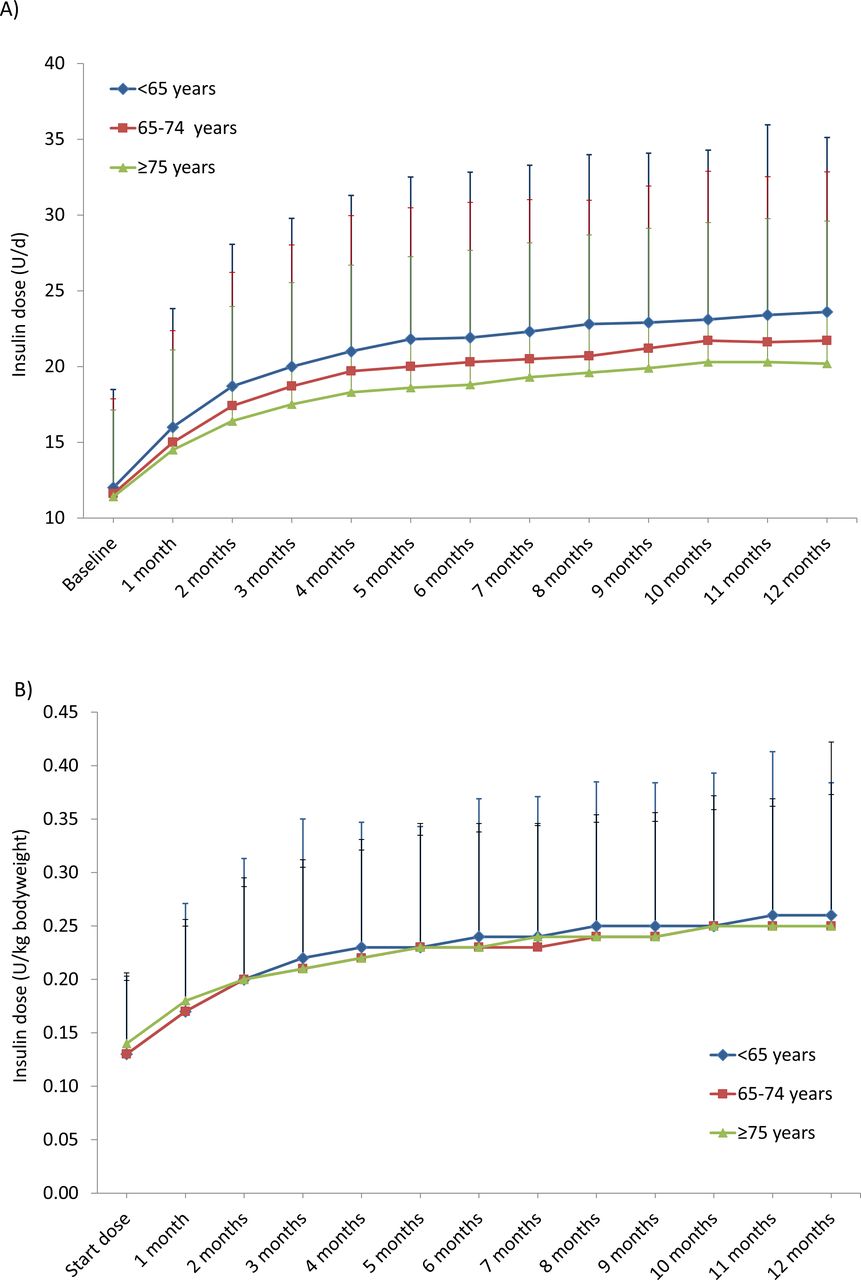
In all age groups, the insulin dose increased substantially between Gla-100 initiation and 12-month follow-up (figure 2). When the dose was considered in units per day (U/d) (figure 2A), the mean increase was most pronounced in the <65 group (from 12.0±6.5 to 23.6±11.5 U/d; Δ=+11.6±0.4 U/d), followed by the 65–74 group (from 11.6±6.3 to 21.7±11.1 U/d; Δ=+10.2±10.0 U/d) and the ≥75 group (from 11.4±5.7 to 20.2±9.4 U/d; Δ=+8.8±8.7 U/d; p<0.0001). However, when considered in units per kilogram of body weight (figure 2B), the 12-month dose was comparable between groups (0.26±0.12, 0.25±0.12, and 0.25±0.17 U/kg, respectively, across age groups; p=0.30) and the Gla-100 dose increments from baseline to 12 months were no longer significantly different (0.13±0.11, 0.12±0.11, and 0.11 ± 0.17 U/kg, respectively; p=0.054). In all groups, the most rapid dose increase was seen within the first 4 months after baseline, with leveling out of the curve over time.

Insulin dose in U/d (A) and U/kg body weight (B) over 12 months. Final doses were significantly different between groups when considered in U/d (p<0.0001), but not U/kg body weight (p=0.297).
Though the aforementioned trends in OADs across age groups at baseline were preserved at 12 months, the proportion of patients taking metformin had fallen in all groups (>65: −10.1%; 65–74: −9.4%; ≥75: −9.2%), the same being true for DPP-4i, sulfonylureas, and glinides (table 1). Changes in other OADs were minimal. At 12 months, the majority of patients were continuing Gla-100 treatment (85.8% overall), with no significant differences between groups (p=0.1204) (table 1). Very few patients had switched to an alternative basal insulin (0.4% overall) or changed the type of insulin therapy (2.6% overall). The change was not documented for the remainder.
Glycemic control over the 12-month follow-up
While the FBG and HbA1c levels dropped between baseline and 12 months in all age groups, the magnitudes of the reductions were greater in the <65 group (Δ=−64.1±44.2 mg/dL and −1.47±1.00% (−16±11 mmol/mol)) followed by the 65–74 group (Δ=−56.1±42.8 mg/dL and −1.31±0.86% (−14±9 mmol/mol)) and the ≥75 group (Δ=−53.4±44.8 mg/dL and −1.22±1.00% (−13±11 mmol/mol); p<0.0001 for both glycemia measures) (figure 3A and B). FBG levels decreased considerably in the first month (<65: Δ=−36.4±38.9 mg/dL; 65–74: Δ −35.8±36.2 mg/dL; ≥75: Δ −35.5±39.3 mg/dL; p=0.904), however, did not markedly change anymore between 6 and 12 months in all age groups. Similar findings were observed for HbA1c (figure 3B).
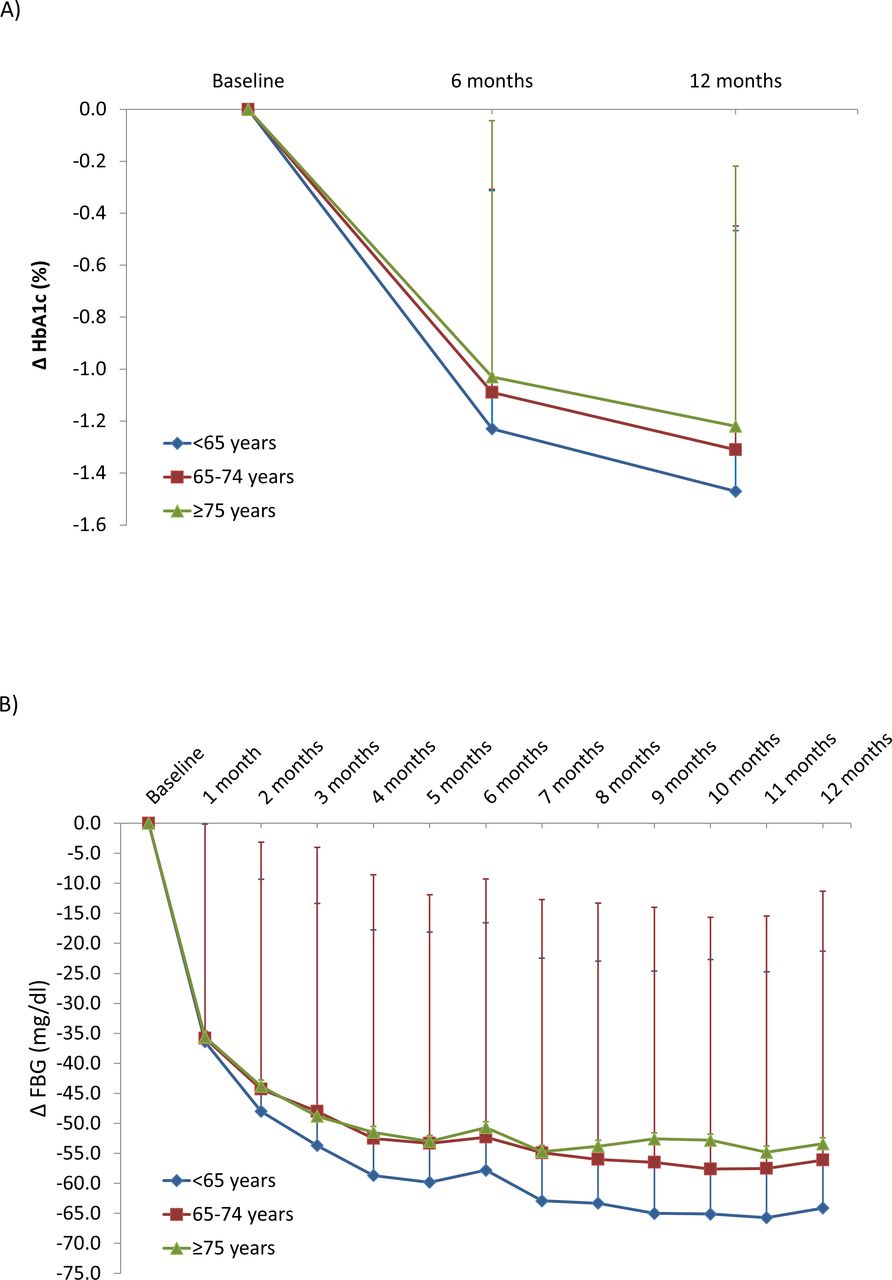
Change in HbA1c (A) and capillary fasting blood glucose (FBG) (B) levels over 12 months. At 6 and 12 months, the within-group change in both HbA1c and FBG vs baseline was significant for all groups (p<0.0001 in all cases).
Achievement of the primary endpoint at 12 months
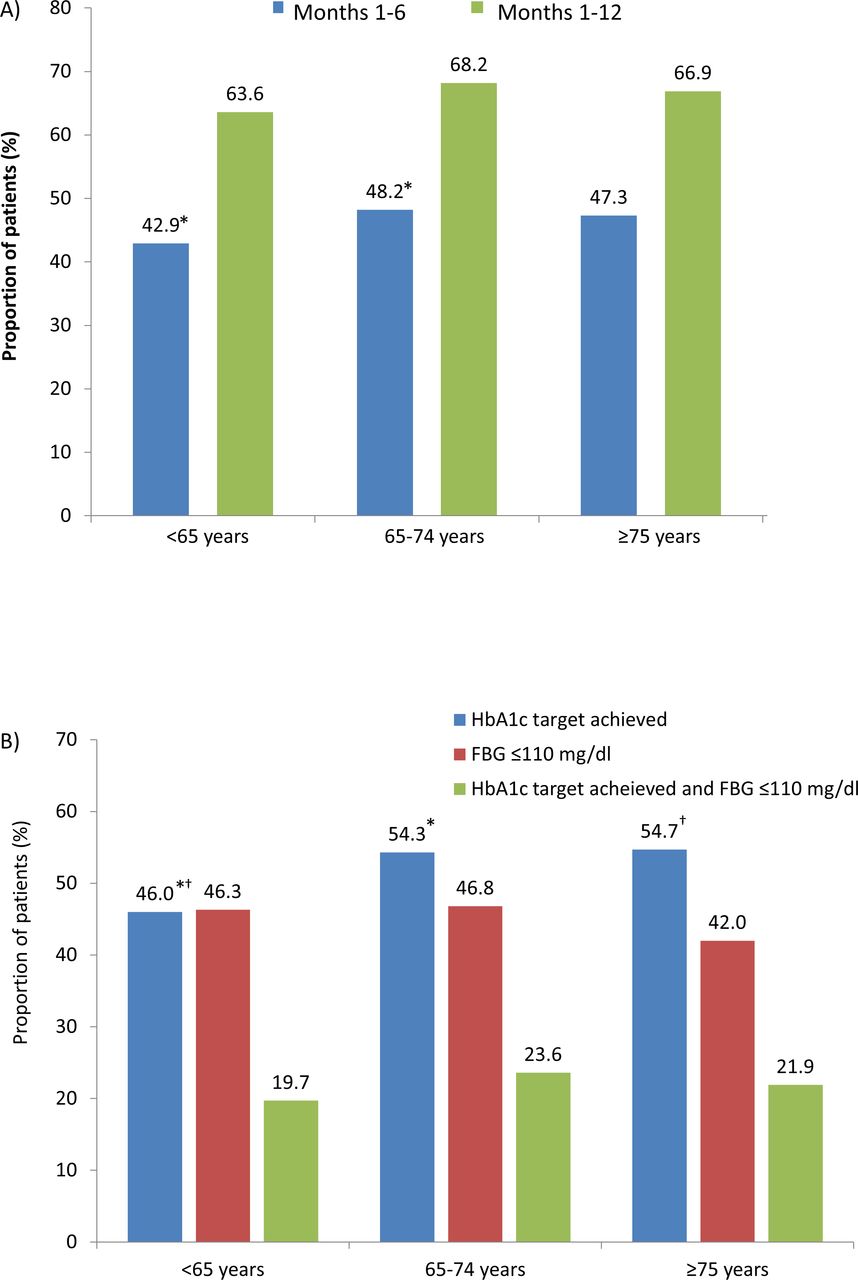
The proportion of patients who met the primary endpoint (achievement of an individual HbA1c target and/or FBG ≤110 mg/dL on two occasions) was significantly lower in the <65 age group compared with the 65–75 age group at 6 months (42.9% vs 48.2%; p=0.023) (figure 4A). However, no significant differences were evident between groups at 12 months, with 65.9% of all patients achieving their individual HbA1c target and/or an FBG of ≤110 mg/dL.

(A) Primary endpoint achievement at 6 and 12 months. Primary endpoint is defined as achievement of individual HbA1c target and/or fasting blood glucose (FBG) ≤110 mg/dL on two occasions. Values are percentages of all patients with available data. The only significant difference was between <65 and 65–74-year-olds at 6 months (*p=0.023). (B) Components of the primary endpoint at 12 months. HbA1c target achievement was significantly different between <65 and 65–74-year-olds (*p≤0.02) and <65 and ≥75-year-olds (†p≤0.02). No other comparisons were significant.
Regarding the separate components of the primary endpoint (figure 4B), the proportion of patients who achieved their individual HbA1c target at 12 months was significantly lower in the <65 age group (46.0%) compared with those in the 65–74 group (54.3%; p<0.02) and ≥75 group (54.7%; p<0.02). Endpoint rates were substantially lower when a combination of both endpoint components (achievement of an individual HbA1c target and FBG ≤110 mg/dL on two occasions) was investigated with rates of 19.7%, 23.6%, and 21.9% in the three age groups (from youngest to oldest age group), respectively. No significant differences in the proportions of patients who attained FBG ≤110 mg/dL or met both HbA1c and FBG endpoint criteria at 12 months were seen between groups.
Hypoglycemia during the 12 months of follow-up
The proportion of patients who experienced one or more symptomatic hypoglycemia events during the 12-month study was higher in the ≥75 years group (3.4%) compared with the <65 and 65–74 groups (both 1.4%; p=0.0126) (online supplementary table 1). No significant differences in any of the other predefined types of hypoglycemia were found between groups.
Supplemental material
Discussion
In patients with T2DM being initiated on BOT therapy with Gla-100, advancing age is associated with slightly more lenient HbA1c target-setting, less aggressive insulin titration, and a lesser absolute reduction in glycemic values. However, in this study, glycemic improvements were apparent in all age groups, and although rates of symptomatic hypoglycemia were slightly higher in ≥75-year-olds, they were still low. These findings support the safe and efficacious use of Gla-100 in elderly patients. Nevertheless, suboptimal rates of glycemic target attainment were apparent for all groups, indicating that there is scope for more intensive antidiabetic treatment while considering the risk of hypoglycemia, regardless of age. HbA1c target achievement was observed in less than 50% of participants in the <65-year-old group, indicating a particular need to improve glycemic control in this younger population.
Effect of age on patient characteristics and target-setting
The number of patients enrolled decreased across age groups, with almost half the number of ≥75-year-olds starting insulin therapy compared with <65-year-olds. This may be reflective of a general unwillingness to initiate insulin therapy in elderly patients due to an age-related increase in the risk of hypoglycemia and the perceived complexity of dosing regimens.16 17 In terms of Gla-100, this may be misplaced, given that its activity is nearly peak-free and long-lasting (approximately 24 hours),18 reducing the likelihood of hypoglycemia and minimizing the burden of complex injection regimes.
The proportion of women rose across ascending age groups. This is logical, given that life expectancy in Germany is longer for women than for men (currently 83.6 vs 78.7 years).19 This may, in part, explain the decrease in body weight across age groups, given that women are generally lighter than men. In addition, advancing age is associated with muscle wastage and a decrease in bone density,20 which are also key contributors. Weight is of note as it is sometimes considered when establishing basal insulin doses in clinical practice.21 Indeed, when insulin doses in the present study were calculated in units per kilogram of body weight, the magnitude of up-titration and final dose at 12 months were both comparable between age groups. Whether or not this was intentional cannot be answered with the present data and merits further investigation.
A longer diabetes duration was seen in older patients.22 This has been identified as an independent risk factor for hypoglycemia.23 Accordingly, guidelines state that stringent HbA1c targets (6.0%–6.5%) should only be considered for patients with a shorter diabetes duration and long life expectancy, while older patients with longer diabetes durations nearing the end of their lives may have a more relaxed target and higher risks of comorbidities such as impaired renal function and potential side effects to aggressive therapies.1 While targets must also take into account factors such as comorbidities, microvascular complications, and functional status, it follows that the youngest age group in the present study had the most stringent targets. This is despite them having higher HbA1c and FBG values at baseline, demanding a greater improvement in glycemic control. However, although statistically different, the mean group targets were reasonably similar in magnitude from a clinical perspective (6.8%–7.1%). Considered in the context of guideline recommendations,1 this is surprising. It is possible that physicians were more lenient with the younger age group because of their high glycemic values at baseline and the wish to set a realistic target. Indeed, setting unrealistically low glycemic targets has been suggested to be counterproductive for long-term motivation in patients with type 1 diabetes,6 and this is likely to extrapolate to patients with T2DM.
Age and antidiabetic medication
All patients were taking at least one OAD at baseline, though the type was distributed differently across age groups. While a higher proportion of younger patients were taking metformin, sulfonylureas and DPP-4 without metformin were more common with advancing age. This may partly be explained by the higher frequency of contraindications to metformin (eg, renal impairment, hypoxia, or dehydration7) found in older patients and the additional concern over its gastrointestinal side effects in frail patients with poor appetite.24 Use of any type of insulin was uncommon at baseline (<11% in each group), despite all group mean HbA1c values being above 8%. This suggests an inappropriate delay in starting insulin therapy, given that several studies have outlined the greater improvement in glycemic control to be gained from its early initiation.25 26
During follow-up, there was a drop in the use of antidiabetic drugs as can be seen in table 1: metformin, glinides, and sulfonylurea were all used less often after 12 months, potentially as a result of treatment adjustment based on either the fear of hypoglycemia (eg, sulfonylurea) or merely to reduced the number of drugs used (metformin, glinides). This needs to be kept in mind when interpreting the level of target achievement and hypoglycemic side effects.
Effect of age on dosing and glycemic control
At 6 and 12 months, the magnitudes of absolute FBG and HbA1c reductions were greater in younger patients. These changes were concurrent with the more aggressive Gla-100 titration seen in younger age groups. Indeed, the magnitude of titration was evidently age dependent, with younger patients being treated more aggressively. However, overall, treatment intensification was slow and mainly occurred in the first few months, with only small increments seen after 4 months. Indeed, the 12-month dose in the <65 group was just 21.7 U/day, representing a mean up-titration of only +10.2 units over 12 months. According to the Fritsche and Davies algorithms for Gla-100 titration in patients with T2DM, an FBG of >110 mg/dL demands a minimum of a 2 U/d up-titration every 3–5 days.27 28 This would correspond to an increase of anything up to 72 U/d (extremely unlikely and for illustrative purposes only) if a patient still had a FBG >110 mg/dL at 6 months. Considering that less than 50% of patients had achieved the primary endpoint in each group at 6 months, it appears that such algorithms are not being adhered to, and that physicians are taking a more cautious approach. Such caution is likely due to the aforementioned concerns over hypoglycemia, also explaining the reduction in the proportions of patients taking concomitant OADs at 12 months. While this may be appropriate in more frail patients of advanced age, it is unlikely to be justifiable in younger patients. As such, a fear of hypoglycemia is hard to discriminate from an actual increase in the risk of hypoglycemia in an individual patient. A further explanation for the leveling off of doses may be physician satisfaction with less-than-optimal glycemic values, supported by a survey which found over 35% of general practitioners, internists, and endocrinologists to consider any FBG below 130 mg/dL as good glycemic control.29 While the appropriacy of titrations must be established on an individual basis taking into account multiple patient factors, our findings suggest that there is scope for greater treatment intensification across age groups. This is especially true for younger patients with longer life expectancies, given the association between elevated HbA1c and microvascular complications, and a reported 42% reduction in cardiovascular events over the long term with intensive glycemic control.9 10
Increased rates of hypoglycemia are commonly seen in elderly patients as a result of polypharmacy, comorbidities, decreases in renal function, and reduced perception of hypoglycemic warning signs.30 31 They are also more concerning, given that they are a known risk factor for falls in this population.32 Concurrently, the proportion of patients who experienced ≥1 symptomatic hypoglycemia event during the 12-month study was highest in the ≥75 group, with no difference between <65 and 65–74-year-olds. However, this rate was low, at 3.5%. Indeed, when all of the hypoglycemia types were combined, only 5.3% of the ≥75-year-old group had any kind of event. This is much lower than the 17.2% and 5.3% of older patients (≥65; mean 71.9 years) who experienced daytime and nocturnal hypoglycemia, respectively, in the PREDICTIVE study with insulin detemir.22 However, it should be noted that non-symptomatic events are included in PREDICTIVE values, and direct comparisons stratified by age groups are needed before any conclusive benefit can be established. It is also important to consider that the rate of hypoglycemia may have been underestimated in our older groups, given the reduced perception and reporting typical of geriatric patients. Nevertheless, the low incidence of hypoglycemia also in people with T2DM ≥75 years may encourage physicians to use Gla-100 more frequently in the elderly population.33
The majority of patients were continuing Gla-100 therapy at 12 months with no significant difference between groups, suggesting a high rate of tolerance and persistence. This is encouraging, as there is evidence for an association between interruption/discontinuation of basal insulin within the year after initiation and higher rates and costs of hospitalization.34
Limitations
Due to the observational nature of the study, imbalances in group sizes and non–age-related factors were present at baseline. These may have had considerable impact when comparing outcomes, particularly in terms of hypoglycemia. Furthermore, there is no control group which would have interesting to explore the clinical benefits of Gla-100. However, our data offer valuable insight into the real-world situation in Gla-100 initiation and ongoing treatment in populations of different age. The large samples used in the present study are advantageous in terms of statistical power, though occasionally resulted in statistically significant differences with relatively low clinical relevance. Due to the study design, reporting of symptomatic hypoglycemia is likely to have been subject to recall bias and must be interpreted with care.
Conclusions
Overall, the addition of Gla-100 to oral antidiabetic therapy resulted in a significant and clinically relevant improvement in glycemic control with low rates of hypoglycemia across all age groups, including those aged ≥75 years. Almost half of patients failed to meet their HbA1c targets which was particularly apparent in those aged <65 years, who failed to meet their (relatively lenient) targets in more than 50% of cases. Given the link between HbA1c and long-term cardiovascular risk, ensuring appropriately stringent target-setting, intensification of basal insulin, and making sure hypoglycemia is avoided is of paramount importance, particularly in younger patients.
References
Footnotes
Contributors Made substantial contributions to conception and design: AF, HA, MP, SP, AB, KP, JS. Made substantial contributions to acquisition of data, or analysis and interpretation of data: AF, HA, MP, SP, AB, KP, PB, JS. Involved in drafting the manuscript: AF, PB. Involved in revising the manuscript critically for important intellectual content: HA, MP, SP, AB, KP, JS. Gave final approval of the version to be published, takes public responsibility and can be held accountable for all aspects of the work: AF, HA, MP, SP, AB, KP, PB, JS.
Funding The study was sponsored by Sanofi-Aventis Deutschland GmbH.
Competing interests AF: Member of Scientific Advisory Boards of Sanofi, Novo Nordisk, Lilly, and Boehringer. HA: Honorary for consultancy: Sanofi, MSD, Lilli, Boehringer Ingelheim and Pfizer. MP: Member of Scientific Advisory Boards of Boehringer Ingelheim, Eli Lilly, Novo Nordisk and Sanofi. Honorary for talks: Eli Lilly, Novartis, Novo Nordisk and Sanofi. SP: Member of Scientific Advisory Boards of Sanofi. Honorary for talks: Eli Lilly, Novartis, Novo Nordisk, MSD and Sanofi. AB is an employee of Sanofi. KP is an employee of Sanofi. PB: Honorary for consultancy: Sanofi-Aventis, MSD, AstraZeneca, Bristol Myers Squibb (BMS), Boehringer Ingelheim, Novartis and Pfizer. JS received honoraria for talks and/or consultancy and/or research funding from Abbott, Astra Zeneca, Bayer, Berlin Chemie, Boehringer Ingelheim, Bristol Myers Squibb (BMS), GI-Dynamics, GlaxoSmithKline (GSK), Intarcia, Ipsen, Janssen, LifeScan, Lilly, Merck Sharp Dohme (MSD), MedScape, Mundipharma, Novartis, Novo Nordisk, Omniamed, Pfizer, Roche, Sanofi Aventis, Servier, Takeda and Ypsomed.
Patient consent for publication Obtained.
Ethics approval The registry protocol was approved by the relevant local ethics committee, and was carried out in accordance with the Declaration of Helsinki and its amendments.
Provenance and peer review Not commissioned; externally peer reviewed.
Data availability statement All data relevant to the study are included in the article or uploaded as online supplementary information.