Article Text

Abstract
Objective To investigate whether the health implications of having type 2 diabetes (T2D) were different in South Asian compared with white European participants.
Research design and methods Prospective data from UK Biobank were used, and 457 935 participants of white European and 7102 of South Asian background were included. Cox proportional regression was performed to investigate the association between T2D and health outcome by ethnicity.
Results Over a mean of 7.0 years (IQR 6.3–7.6) of follow-up, 12 974 participants had died, and 30 347 and 27 159 developed cardiovascular disease (CVD) and cancer, respectively. South Asians had a higher risk for CVD mortality (HR: 1.42, 95% CI 1.07 to 1.89) and incidence (HR: 1.78, 95% CI 1.63 to 1.94), but a decreased risk for cancer mortality (HR: 0.59, 95% CI 0.41 to 0.85) and incidence (HR: 0.80, 95% CI 0.70 to 0.92) compared with white Europeans. Compared with individuals without T2D, both white Europeans and South Asians with T2D had a higher risk for all-cause mortality (1.59 (1.48 to 1.71) vs 2.83 (1.76 to 4.53)), CVD mortality (2.04 (1.82 to 2.28) vs 4.40 (2.37 to 8.16)) and CVD incidence (1.37 (1.31 to 1.44) vs 1.60 (1.31 to 1.95)), respectively. However, the magnitude of the risk was higher for South Asians than white Europeans.
Conclusions Although T2D was associated with a higher risk for all-cause mortality and CVD incidence and mortality, in both white Europeans and South Asians, the risk experienced by South Asians with T2D was higher than their white European counterparts.
- type 2 diabetes
- mortality
- ethnic differences
This is an open access article distributed in accordance with the Creative Commons Attribution Non Commercial (CC BY-NC 4.0) license, which permits others to distribute, remix, adapt, build upon this work non-commercially, and license their derivative works on different terms, provided the original work is properly cited, appropriate credit is given, any changes made indicated, and the use is non-commercial. See: http://creativecommons.org/licenses/by-nc/4.0/.
Statistics from Altmetric.com
Significance of this study
What is already known about this subject?
Type 2 diabetes (T2D) is a risk factor for all-cause mortality and cardiovascular disease (CVD) mortality and incidence.
South Asians are at high risk for T2D compared with white Europeans living in the same country.
What are the new findings?
South Asians had a higher risk for CVD incidence and mortality compared with white Europeans.
The risk associated with having T2D was greater in South Asians compared with white Europeans for all-cause and CVD mortality and incidence.
The excess CVD risk in South Asians, compared with white Europeans, was not fully explained by their higher T2D prevalence.
How might these results change the focus of research or clinical practice?
A reduction in the prevalence of T2D has the largest potential impact among South Asians, and we therefore suggest that preventive measures that can prevent or delay the onset of T2D may have the largest impact within the South Asian population.
Further investigation is needed to underpin other risk factors that could play a key role in increasing CVD risk in South Asians.
Introduction
Type 2 diabetes (T2D) more than doubles the risk of cardiovascular disease (CVD) and all-cause mortality.1 2 South Asians typically develop T2D 5–10 years earlier than white Europeans, transition through the ‘pre-diabetes’ phase more rapidly, and once they develop diabetes disease progression is faster and microvascular complications develop more rapidly.3–5 Moreover, South Asians are at a twofold to sixfold increased risk of T2D compared with white Europeans.6 7 It might, therefore, be expected that T2D contributes to all-cause mortality and CVD to a larger extent in South Asians than in white Europeans. If so, the potential impact of T2D prevention among South Asians may be larger than among white Europeans.
It is already known that South Asians, as well as being at increased risk of T2D, are at increased risk for CVD.8 But there is limited evidence as to whether the increased CVD risk among South Asians is due to the higher T2D prevalence and how all-cause mortality risk is influenced. There are few studies to date that have investigated mortality risk in South Asians and white Europeans with and without T2D.9–11 The results from these studies have been conflicting. A recent study showed that years of life lost due to T2D is higher among white Europeans than South Asians9; this was substantiated by another study by Shah et al10 that showed all-cause mortality risk to be lower in South Asians than in white Europeans. In contrast to this, a study by Tillin et al11 showed that all-cause mortality risk is higher in South Asians compared with white Europeans with T2D, but the risk is similar between South Asians and white Europeans without T2D. These conflicting results may be due to differences in study design. The study by Shah et al10 did not adjust for important variables including smoking and adiposity measures. Furthermore, mortality risk may have changed over time due to improvements in healthcare; the study by Tillin et al11 was published recently, but the follow-up period started 20 years ago. The higher CVD mortality risk in South Asians may be balanced by a lower risk for cancer, as cancer and CVD together form the leading causes of death in high-income countries,12 13 resulting in no difference in all-cause mortality risk.
The aim of the current study was to compare the health risks associated with having T2D in South Asians and white Europeans. This was investigated for all-cause mortality, CVD and cancer mortality and incidence, both in terms of the increased risk associated with having T2D and the proportion of events attributable to T2D.
Methods
Population
Between April 2007 and December 2010, the UK Biobank invited people aged 40–69 years old from the general population to participate in the study. From the initial invitations there was a 5.5% response rate,14 with 502 655 participants finally agreeing to participate. Participants attended one of 22 assessment centers across England, Wales and Scotland15 16 where they completed a touchscreen questionnaire, had physical measurements taken and provided biological samples, as described in detail later.15 16 Participants of white European (n=472 825) and South Asian (n=8024) ethnicity were considered. Participants who indicated to have been diagnosed with diabetes under the age of 30 were excluded to reduce the likelihood of including those with type 1 diabetes (1563 participants (1462 whites and 101 South Asians) were excluded on this basis), as shown previously.17 Participants were only included in the total sample if the data that were provided were complete. Therefore, after the exclusion of participants who did not meet the specified criteria, 457 935 white Europeans and 7102 South Asians were considered in our analysis.
Procedures
Date of death was obtained from death certificates held by the National Health Service (NHS) Information Centre (England and Wales) and the NHS Central Register Scotland (Scotland). Date and cause of hospital admissions were identified via record linkage to Health Episode Statistics (England and Wales) and to the Scottish Morbidity Records (SMR01) (Scotland). Detailed information regarding the linkage procedure can be found at http://www.ic.nhs.uk/services/medical-research-information-service. At the time of analysis, mortality data were available up to 31 January 2016. Mortality analysis was therefore censored at these dates, or date of death if this occurred earlier. Hospital admission data were available until 31 March 2015, resulting in disease-specific analyses being censored at this date, or the date of hospital admission or death if this occurred earlier. CVD was defined as a hospital admission or death with International Classification of Diseases (ICD) 10th Revision code I05–I89.9 (myocardial infarction, heart failure, stroke, atrial fibrillation, cerebrovascular diseases and circulatory diseases). Cancer was defined as an ICD code of C0.0–C9.9, D3.7–9 or D4.0–8.
Measurements
Participants classified themselves into one of 16 ethnic groups consistent with the UK Office for National Statistics Census categories. This study was restricted to participants who classified themselves in one of the following groups: white European (British, Irish and other white European) or South Asian (Indian, Pakistani and Bangladeshi). Age was calculated from dates of birth and baseline assessment. Area-based socioeconomic status was derived from postcode of residence using the Townsend score, which is derived from census data on housing, employment, social class and car availability.18 Other sociodemographic information such as professional qualifications (college or university, A (advanced) or O (ordinary) levels, General Certificate of Secondary Eduction (GCSE); or equivalent levels) and income (<£18 000, £18 000–29 999, £30 000–51 999, £52 000–100 000 and >£100 000) was self-reported at baseline.
Dietary information was collected via a self-reported dietary questionnaire (Oxford WebQ).19 20 Participants were asked how many portions of specified foods they generally ate. Subjective sleep duration was obtained by asking ‘About how many hours sleep do you get in every 24 hours?’ from which the following ordinal categories were derived: short sleeper <7 hours/day, normal sleeper 7–9 hours/day or long sleeper >9 hours/day. Physical activity was measured via the International Physical Activity Questionnaire (IPAQ) short form,21 with participants reporting the frequency and duration of walking and moderate and vigorous activity undertaken in a typical week.21 Data were analyzed in accordance with the IPAQ scoring protocol,22 and total physical activity was computed as the sum of walking and moderate and vigorous activity, measured as metabolic equivalent-hours per week. Participants were excluded from the analyses if they recorded implausible values, defined as the sum of their total physical activity, sleeping time and total screen time exceeding 24 hours.23
Height, body weight and waist circumference were measured by trained nurses during the baseline assessment. Body mass index (BMI) was calculated as (weight/heigh2). Body fat percentage was measured using standardized bioimpedance protocols. Waist circumference was measured using standardized protocol. Further details of these measurements can be found in the UK Biobank online protocol (http://www.ukbiobank.ac.uk) and elsewhere.24
T2D was based on self-reported physician-diagnosed diabetes. Medical history (physician diagnosis of cancer, CVD, diabetes and hypertension) and medication history relating to diabetes, dyslipidemia and hypertension were collected from the self-completed baseline assessment questionnaire.
Statistical analyses
Participants’ baseline characteristics by T2D status and ethnicity were presented as mean and SD for continuous variables and percentages and numbers of observations for categorical variables.
To investigate the association between T2D and health outcomes of interest (all-cause mortality and CVD and cancer incidence and mortality), Cox proportional hazard models with years of follow-up as the time-scale were performed and results presented as HR and their 95% CI. The proportional hazards assumption was checked by tests using the Schoenfeld residuals. Participants who self-reported having CVD (n=16 430 Europeans; n=367 South Asians) at baseline were excluded from the analyses when the outcome of interest was CVD. Similarly, when cancer was the outcome of interest, participants with a diagnosis of cancer (n=37 377 Europeans; n=249 South Asians) at baseline were excluded.
To investigate whether the hazard for health outcomes differs between white Europeans and South Asians, Cox regression analyses with white Europeans as the reference group were performed. To investigate whether the association between T2D and health outcomes differed by ethnicity, analyses were first carried out in each ethnic group separately, using individuals without T2D as the reference group. Following this it was tested whether the effect of T2D on health outcomes differed by ethnicity, by the addition of a multiplicative interaction term between T2D and ethnicity to the model.
Incremental adjustment for confounders were used; the models included age, sex, deprivation index, income and professional qualifications (model 0), and additionally smoking, red meat intake, processed meat intake, oily fish intake, fruit and vegetable intake, the frequency of alcohol intake, sedentary time, total physical activity, sleep duration and BMI (model 1). This was in accordance with a conceptual model developed with software from DAGgitty. The directed acyclic graph (DAG) is shown at dagitty.net/mvkWb2B and includes considered covariates (online supplementary figure 1).
Supplemental material
Additionally, sensitivity analyses, where BMI was replaced by waist circumference and body fat percentage, as well as a mutually adjusted model to account for a potential fat distribution confounding effect, were conducted. Another sensitivity analysis was performed to assess if mortality risk between ethnic groups was similar when participants with T2D at baseline were excluded from all analyses.
Population attributable fractions (PAF) were calculated to estimate the proportions of mortality and morbidity outcomes attributed to T2D among white Europeans and South Asians. The potential impact fractions stratified by ethnicity were also determined for a 10%, 25%, 50% and 100% reduction in T2D prevalence. All analyses were performed using STATA V.15 statistical software and p values <0.05 were considered statistically significant.
Results
Baseline characteristics
At baseline, 4.4% (n=20 068) of the included white Europeans and 16.4% (n=1166) of the included South Asians had T2D (table 1). South Asian participants, both with and without T2D, were somewhat younger than white European participants. Although South Asians lived more often in deprived areas than white Europeans, a higher percentage of South Asians had a college or university degree compared with white Europeans. A higher percentage of white Europeans reported current or former smoking. Red and processed meat intake, as well as oily fish and alcohol intake, was higher in white Europeans than in South Asians. Fruit and vegetable intake, on the other hand, was higher among South Asians. Waist circumference was higher in South Asian participants without T2D, compared with white European participants without T2D. However, waist circumference was higher in white European than South Asian participants when T2D was present.
Baseline characteristics
Mortality, CVD and cancer risk by ethnicity
During a mean follow-up of 7.0 years (IQR 6.3–7.6), a total of 12 974 deaths occurred, 30 346 participants developed CVD and 27 159 developed cancer (online supplementary table S1). South Asians and white Europeans had similar rates of all-cause mortality (figure 1 and online supplementary table S1). However, in the minimally adjusted model (model 0), the hazards for CVD mortality and incidence were higher in South Asians than in white Europeans (HR 1.73 (95% CI 1.31 to 2.29), p<0.0001 and HR 1.93 (95% CI 1.78 to 2.11), p<0.0001, respectively). The hazards for cancer mortality and incidence were lower in South Asians than in white Europeans (HR 0.56 (95% CI 0.39 to 0.80), p=0.002 and HR 0.77 (95% CI 0.67 to 0.89), p<0.0001), respectively. Adjustment for T2D (model 2) attenuated the increased risk of CVD mortality among South Asians compared with white Europeans, and was fully attenuated in the sensitivity analyses which excluded participants with T2D (model 3). Adjustment or exclusion of participants with T2D did not change the observed higher risk for CVD or lower risk for cancer incidence among South Asians compared with white Europeans. However, the lower risk for cancer mortality observed in South Asians was attenuated when participants with T2D were excluded (figure 1 and online supplementary table S1). The adjustment for different adiposity markers (BMI, waist circumference, body fat) did not change the direction and magnitude of the associations, as presented in online supplementary table S3.
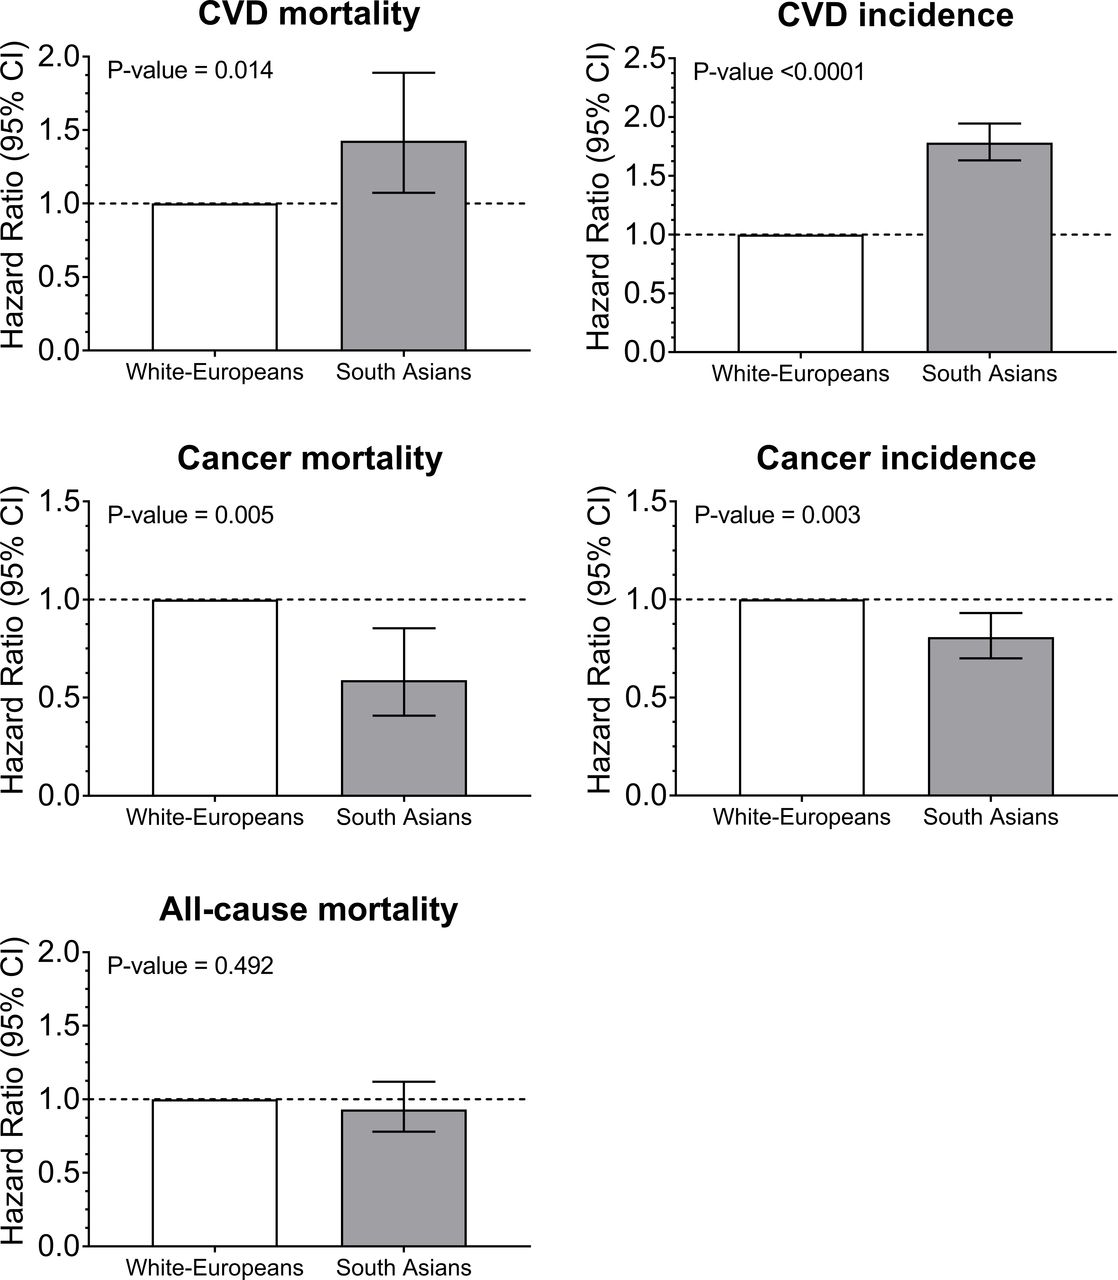
Cox proportional hazard for all-cause mortality, CVD and cancer incidence and mortality by ethnicity. Participants of a white European background were used as the reference categories. Participants were included if they were free of CVD at baseline for CVD outcomes and free of cancer at baseline for cancer outcomes. The analyses were adjusted for age, sex, deprivation index, income, professional qualifications, smoking, red meat intake, processed meat intake, oily fish intake, fruit and vegetable intake, the frequency of alcohol intake, sedentary time, total physical activity, sleep duration and body mass index. CVD, cardiovascular disease.
Mortality, CVD and cancer risk by T2D and ethnicity
The risk of all-cause mortality, CVD mortality, CVD incidence and cancer mortality was, in both white Europeans and South Asians, higher in those with T2D compared with those without T2D (figure 2 and online supplementary table S2). Although there were no significant interactions between T2D and ethnicity for health outcomes (p>0.05), the associations were somewhat stronger among South Asians with T2D, compared with white Europeans with T2D, for all-cause mortality and CVD mortality and incidence. Compared with participants without T2D, the hazard for CVD mortality was 1.99 (95% CI 1.79 to 2.21) in white Europeans with T2D, whereas South Asians with T2D had a hazard of 4.26 (95% CI 2.32 to 7.80). Similar results were observed for all-cause mortality (HR: 1.62 (95% CI 1.53 to 1.72) vs 2.46 (95% CI 1.67 to 3.63)) and CVD incidence (HR: 1.36 (95% CI 1.31 to 1.43) vs 1.62 (95% CI 1.33 to 1.97)) in people with T2D of white European and South Asian ethnicities, respectively (figure 2 and online supplementary table S2). Further adjustment for waist circumference or body fat percentage did not change the direction and magnitude of the associations, as presented in online supplementary table S4.

Cox proportional hazard for all-cause mortality, CVD and cancer incidence and mortality by diabetes and ethnicity. * Participants without type 2 diabetes were used as the reference categories. Participants diagnosed with diabetes before the age of 30 years were removed from the analysis. Participants were included if they were free of CVD at baseline for CVD outcomes and free of cancer at baseline for cancer outcomes. The analyses were adjusted for age, sex, deprivation index, income, professional qualifications, smoking, red meat intake, processed meat intake, oily fish intake, fruit and vegetable intake, the frequency of alcohol intake, sedentary time, total physical activity, sleep duration and body mass index. The p value indicates differences within type 2 diabetes status. No significant interactions were found between type 2 diabetes and ethnicity for any of the health outcomes. CVD, cardiovascular disease.
Potential impact of T2D prevention
Modeling the impact of a reduction in T2D prevalence showed that T2D contributed to all-cause mortality, CVD mortality and CVD incidence in both South Asians and white Europeans (table 2). However, due to its high prevalence among South Asians, T2D contributed to a greater extent to all-cause mortality, CVD mortality and CVD incidence in South Asians compared with white Europeans. For example, a reduction in T2D prevalence of 50% resulted in an estimated 1.97% (95% CI 1.43% to 2.45%) and 22.29% (95% CI 6.33% to 35.57%) reduction in the CVD mortality in white Europeans and South Asians, respectively.
Proportion of events attributable to diabetes in South Asians and white Europeans
Discussion
The results of this study confirm the increased risk of all-cause mortality and CVD mortality and incidence in participants with T2D. Although the findings of this study did not show a significant interaction of T2D and ethnicity with health outcomes, the risks associated with having T2D were greater in South Asians compared with white Europeans for all-cause and CVD mortality and incidence. T2D appears to be a stronger risk factor for all-cause mortality, CVD and cancer mortality and incidence among South Asians (Relative Risk (RR) 1.63–4.30) than white Europeans (RR 1.27–1.89). This was further compounded by the higher T2D prevalence in South Asians, rendering the potential impact of T2D reduction being greater in South Asians compared with white Europeans.
Both white European and South Asian participants had a relatively similar risk of all-cause mortality. This is thought to be because the higher risk of mortality due to CVD among South Asians is counterbalanced by the lower cancer risk. Previous studies have not reached a consensus on this matter. Shah et al10 suggested that the mortality risk in people with T2D was lower among South Asians when compared with white Europeans. However, the Shah et al10 study included participants who had recently been diagnosed with T2D. This was in contrast to the current study, where we included participants who had already been diagnosed with T2D at baseline. Therefore, participants within the current study had a longer duration of T2D. Additionally, the study by Shah et al10 did not adjust for smoking or adiposity levels,25 with smoking rates generally much lower (as is also the case in this study) among South Asians compared with white Europeans. Study settings may also have led to the contrasting results, with the current study conducted in the UK and the study by Shah et al10 conducted in Canada. Differences including those related to healthcare may have led to the observed study differences.
The results of the current study agree with the findings from a previous study conducted in the UK by Tillin et al,11 which suggested that the risk of CVD is higher in South Asians, relative to white Europeans, with T2D but not those without T2D. Although results from the study of Tillin et al11 were published recently, follow-up started between 1988 and 1991. It was speculated therefore that over time mortality risk may have changed due to an improvement in CVD management.26 In addition, in past decades greater attention has been paid to the differences in disease risk between ethnicities within healthcare, for example, in diabetes screening. It is, however, interesting to note that, according to the current study, these changes have not affected the higher CVD and all-cause mortality risk among South Asians compared with white Europeans.
In accordance with previous studies, this study reported differences in CVD and cancer risk between white European and South Asian participants.11 25 26 In the future, it might be important to consider that when the high CVD risk among South Asians is better managed in these populations, this may impact on cancer risk. The higher risk for CVD mortality may partly result in the lower cancer mortality among South Asians, but if CVD mortality was lowered in South Asians then the risk of developing cancer due to a higher life expectancy may increase. On the other hand, South Asians may have a high prevalence of genetic polymorphisms that are protective of cancer, suggesting that the low cancer risk may actually be conserved in the case that the interplay with environmental risk factors is not changed.27
Adjustment for T2D only partially explained the increased risk of CVD mortality among South Asians compared with white Europeans for CVD mortality. However, sensitivity analyses were used to exclude participants with T2D, which resulted in the full attenuation of the higher risk for CVD mortality in South Asians. However, it cannot be discarded that this may be attributable to our limited power to detect an association when T2D cases were excluded. In contrast to this finding, the excess CVD incidence risk in South Asians, compared with white Europeans, was not altered after the adjustment for T2D or exclusion of T2D cases from the analyses, resulting in a slight attenuation of the CVD risk.
Although this study provides evidence that T2D may not fully explain the higher CVD risk experienced by South Asians, further investigation is needed to underpin the risk factors that could play a key role in the increased T2D and CVD risk in South Asians. Especially since T2D and CVD share common denominators that may explain both the increased risk T2D and CVD risk,28 preventive measures for T2D may also impact on CVD risk independent of its development through T2D. Unfortunately, the underlying causes for the higher susceptibility to both CVD and T2D among South Asians compared with other populations remain unclear despite many hypotheses, mainly related to socioeconomic, genetic, developmental and lifestyle factors, having been investigated.29 However, preventive measures could still target known risk factors that impact T2D risk among both South Asians and white Europeans, such as dietary intake and physical activity.30
Our PAF analyses highlight that the contribution of T2D to the CVD incidence and mortality in the general population is larger among South Asians than among white Europeans due to the higher prevalence of T2D in South Asians than in white Europeans. A reduction in the prevalence of T2D had the largest potential impact among South Asians, and therefore we suggest that preventive measures to prevent or delay the onset of T2D may have the largest impact within the South Asian population.
Limitations
This study is not exempt from limitations. First, the diagnosis of T2D within the current study was based on self-reporting of physician-diagnosed T2D. This may have biased our results as some participants may not recall their diagnosis accurately, at all, or may not want to report it. This bias may be greater if self-reporting was more accurate in one ethnic group compared with others. Furthermore, screening rates for T2D may be different among ethnic groups due to ethnic differences in the prevalence of T2D. However, previous studies using UK Biobank have shown that the use of self-reported diabetes is a valid method and can distinguish between participants with and without diabetes.31 Moreover, studies on the validity of self-reported physician-diagnosed diabetes have shown both excellent positive and negative predictive value.32 In addition, misclassification of the type of diabetes was limited by excluding participants with diabetes diagnosed under the age of 30 years. Second, analyses were adjusted for confounders in accordance with the DAG. It can, however, not be excluded that analyses were overadjusted for confounders. This may have partly led to filtering out the direct effect of T2D on mortality. Third, participants included in the UK Biobank study may not be a representative sample of the British population due to ‘healthy volunteer’ selection bias.33 Therefore, future studies are needed to confirm the findings in representative populations of the UK but also in other countries where South Asians represent a greater proportion of the population. Finally, South Asian populations consist of a very heterogeneous group of people with a wide variety of population characteristics. Heterogeneity exists both in genetic etiology and in lifestyle factors depending on ancestral background. Since diabetes is a common factor affecting all South Asian populations, the different underlying populations were studied together, but in future studies subpopulation-specific figures may be calculated.
Conclusion
In conclusion, South Asians have a higher risk of CVD mortality and incidence but a lower risk of cancer mortality and incidence compared with white Europeans. Although T2D was associated with a higher risk for all-cause mortality and CVD incidence and mortality, in both white Europeans and South Asians, the risk experienced by South Asians with T2D was higher than their white European counterparts.
Acknowledgments
We are grateful to UK Biobank participants. This research has been conducted using the UK Biobank Resource under application number 7155. UK Biobank was established by the Wellcome Trust medical charity, Medical Research Council, Department of Health, Scottish Government, and the Northwest Regional Development Agency, and is funded by the Welsh Government and the British Heart Foundation.
References
Footnotes
JMRG, NS and CC-M are joint senior authors.
JMRG, NS and CC-M contributed equally.
Contributors MM, FH, HW, AS, PW, SI, RB, LF, KS, IvV, JPP, SRG, JMRG, NS, and CC-M reviewed the manuscript and approved the final version to be published. MM, FH, and CC-M performed the statistical analyses. MM, FH, JMRG, NS, and CC-M contributed to the study conception and design, advised on all statistical aspects, and interpreted the data. MM, FH, and CC-M drafted the manuscript. MM, FH, JPP, NS, JMRG, and CC-M are the guarantors of this work, and as such had full access to all the data in the study and take responsibility for the integrity of the data and the accuracy of the data analysis.
Funding This work was supported by the Health Behaviours & Chronic Diseases, Amsterdam Public Health. MM received a travel grant.
Competing interests None declared.
Patient consent for publication Not required.
Ethics approval The UK Biobank study was approved by the North West Multi-Centre Research Ethics Committee, and all participants provided written informed consent to participate in the UK Biobank study. The study protocol is available online (http://www.ukbiobank.ac.uk/).
Provenance and peer review Not commissioned; externally peer reviewed.
Data availability statement Data may be obtained from a third party and are not publicly available.