Article Text

Abstract
Objectives To determine if spatial variations in gut permeability play a role in regulating type 1 diabetes (T1D) progression.
Research design and methods Spatially resolved duodenum, jejunum, ileum, and large intestine sections from end-stage T1D non-obese diabetic (NOD) mice were probed by immunohistochemistry to quantify zonulin levels as a measure of gut permeability in early-progressor and late-progressor NOD mice in comparison with non-progressor NOD mice and healthy NOR/LtJ control mice.
Results Zonulin levels were elevated in the small and large intestines in early-progressor and late-progressor NOD mice in comparison with non-progressor NOD mice and healthy NOR control mice. In early-onset mice, elevated zonulin levels were maximum in the duodenum and jejunum and decreased in the ileum and large intestine. In late-progressor mice, zonulin levels were elevated almost evenly along the small and large intestines. In non-progressor NOD mice, zonulin levels were comparable with NOR control levels in both the small and large intestines.
Conclusions Elevated zonulin expression levels indicated that gut permeability was increased both in the small and large intestines in NOD mice that progressed to end-stage T1D in comparison with non-progressor NOD mice and healthy NOR control mice. Highest elevations in zonulin levels were observed in the duodenum and jejunum followed by the ileum and large intestines. Spatial variations in gut permeability appeared to play a role in regulating the rate and severity of T1D progression in NOD mice indicating that spatial variations in gut permeability should be investigated as a potentially important factor in human T1D progression.
- gut microbes
- gut permeability
- intestinal permeability
- type 1 diabetes
- T1D
- zonulin
This is an open access article distributed in accordance with the Creative Commons Attribution Non Commercial (CC BY-NC 4.0) license, which permits others to distribute, remix, adapt, build upon this work non-commercially, and license their derivative works on different terms, provided the original work is properly cited, appropriate credit is given, any changes made indicated, and the use is non-commercial. See: http://creativecommons.org/licenses/by-nc/4.0/.
Statistics from Altmetric.com
Significance of this study
What is already known about this subject?
Serum zonulin levels have been correlated with increased gut permeability in patients with type 1 diabetes (T1D); however, serum levels do not report on potentially important spatial variations in gut permeability and what role they may play in regulating T1D progression in genetically susceptible individuals.
What are the new findings?
Zonulin expression levels were elevated in the small and large intestines of non-obese diabetic (NOD) mice that progress to end-stage T1D compared with non-progressor NOD mice and healthy control NOR mice.
Patterns of spatial variations of zonulin expression levels varied with the rate and severity of progression of T1D in NOD mice indicating that spatial variations in gut permeability play a role in regulating T1D progression.
How might these results change the focus of research or clinical practice?
These results draw attention to the potentially important role that spatial variations in gut permeability may play in regulating T1D progression in humans and hopefully will motivate research to address the investigate the issue in human studies.
Introduction
Zonulin is a protein responsible for regulation of intercellular tight junctions (zonulae occludens) between intestinal epithelia.1 Increased expression of zonulin by intestinal epithelia leads to increased gut permeability and elevated exposure of the host immune system to bacteria and bacterial antigens and macromolecules.2 3 Elevated intestinal zonulin expression levels have been linked to several autoimmune diseases including celiac disease,4 5 Crohn’s disease,6 type 1 diabetes (T1D),2 7 and inflammatory bowel disease.8
Spatial variations in intestinal zonulin expression levels may be important in gut microbial triggering of T1D. For example, gut microbial populations, including potentially diabetogenic gut microbes, are under constant surveillance in the small intestines by immune cell clusters known as Peyer’s patches,9 which sample antigens from gut bacteria as part of the adaptive immune system.9–11 Peyer’s patches are primarily found in the ileum but can be found throughout the small intestines. Bacterial populations are known to vary strongly along the gut12 and communicate with the immune system in multiple locations, including Peyer’s patches. Increased intestinal permeability has also been linked to bacterial colonization,13 14 which is potentially a causative factor in increased zonulin expression.13
Spatial variations in gut permeability could be also linked to exposure to dietary triggers of T1D. Dietary influences on T1D development have been reported with early introduction (age <3 years) of wheat, rye, oats, and other solid foods linked to increased onset of T1D.15 Such an association between diet and T1D onset can be linked to increased gluten exposure, with a gluten-free diet reported to be effective at reducing T1D onset in the NOD mouse model by ~50%.16 17 A link between gluten and zonulin expression has been reported, with gliadins (a class of wheat protein) causing increases in zonulin release and activation of estimated glomerular filtration rate to increase intestinal permeability.18 Targeted changes in diet (eg, hydrolyzed casein-based food instead of traditional chow containing gluten) reduced and retarded T1D onset incidence rates in the BioBreeding rat model.19 Serum and fecal levels of zonulin have been reported to increase in human on switching to a low-carbohydrate, high-fiber, protein, and fat diet.20
Here, we document how spatial variations in gut permeability were linked to T1D progression in NOD mice by evaluating differences in zonulin expression along the intestines of NOD mice that developed T1D in comparison with those of healthy NOR control mice. Previous studies have used immunohistochemical staining techniques to explore zonulin expression in the mouse model of experimental autoimmune encephalomyelitis to study multiple sclerosis, revealing general increases in expression in the gut.21
Materials and methods
Animal protocol approvals
Animal experiments were approved by the Miami University Institutional Animal Care and Use Committee (protocol nos. 898 and 899) and by the institutional ethics committee (Animal Welfare Assurance no. D16-00100). Surgical procedures were carried out as previously described.22–27 All authors completed online and in-class animal training prior to animal work.
Mouse model strains
Female NOD/ShiLtJ (NOD) were used as study animals (>90% develop T1D by ~30 weeks compared with only ~45% of males at ~35 weeks). Female NOR-LtJ (NOR) mice were used as controls. Control and study animals were either purchased from Jackson Laboratory (001976-NOD and 002050-NOR, respectively) or generated from sibling breeder pairs at Miami University.
Animal numbers and treatment during study
Mice were divided into cohorts of ~12 mice born within 1 week of each other, housed in three to four cages, and ear punched for identification. In total, 44 NOD mice and 10 NOR mice were used. Housing of mice was not adjusted after the start of the study to minimize environmental variation. Mice had ad libitum access to food and water. Animals were sacrificed and intestinal tissue collected for histology once they developed T1D based on criteria described below. Control animals were taken out of the study at specified times to provide age-matched (26–41 weeks of age) samples that did not develop T1D.
Determination of the end-stage T1D
Diabetes progression was monitored by analyzing fasting and ad libitum eating blood glucose levels (BGLs) beginning once animals were weaned from their mothers (~5–6 weeks of age). BGL measurements were taken two times per week, under fasting and non-fasting conditions with blood collected by tail puncture using a commercial FreeStyle Lite Blood Glucose Monitoring System (Abbot Laboratories Pharmaceutical Company). Before T1D onset, fasting and non-fasting BGL were in the ~60–120 mg/dL range for both NOD and NOR mice. At T1D onset, non-fasting BGLs in NOD animals increased to 250–500 mg/dL but fell back to normal levels after fasting. Two consecutive fasting BGL measurements >200 mg/dL were considered indicative of T1D onset. End-stage T1D was defined when BGLs stabilized at >250–500+ mg/dL during non-fasting and fasting periods for two consecutive measurement periods.
Intestinal histology
All dissections and intestinal histologies were performed as described previously.22–29 Details regarding the histological procedures can be found in online supplementary material.
Supplemental material
Western blot experiments
Standard Western blots were used to confirm reactivity of the antibodies to haptoglobin and zonulin using the following antibodies: sheep anti-mouse haptoglobin primary (Invitrogen PA5-33158); rabbit anti-sheep horseradish peroxidase (HRP) conjugated secondary (Abcam Ab97130). Detailed methods for the Western blot experiments can be found in online supplementary material.
Zonulin immunohistochemistry (IHC)
Standard IHC techniques were used to probe intestinal tissues for zonulin expression using the following antibodies: sheep anti-mouse haptoglobin primary antibody (Invitrogen PA5-33158); rabbit anti-sheep HRP conjugated secondary antibody (Abcam Ab97130). Details of the experimental methods can be found in online supplementary material. All images used in this study have been uploaded to the Mouse Model of Type 1 Diabetes Atlas (MMDA)30 and are available for viewing and discussion online (mmda.lib.miamioh.edu).
Experimental design to ensure IHC staining consistency
Representative slides from each T1D onset category were stained in batches of eight so that four different gut sections of a representative onset category were prepared on the same day. This ensured that tissue sections being used to make comparisons experienced the same staining conditions and solutions as much as possible.
Image generation and quantification
All images were taken using an Olympus AX-70 microscope with a 20× objective lens. The background white balance was adjusted to ensure all images had identical balance between empty space and stained tissue (figure 1). Each image was taken at increasing intervals of 90K on a Nikon D300 camera in a 350K range. Background signal in areas of the image lacking tissue was adjusted to be approximately identical for all images. Camera white balance was the only adjustment made for each slide. All images were taken using the exact same brightness, contrast, color, lens, and filter settings. Any brown staining was considered representative of zonulin expression. Multiple images were taken from each intestinal section. Three slides from different mice in each onset category, and three villi from each slide were analyzed to represent each tissue subsection and onset age. Images were analyzed using Image Pro Plus software at the Center for Advanced Microscopy and Imaging facility at Miami University. Within each image, an individual villus was selected and isolated using software tools while preserving the size and scaling of the original image. The inclusion/exclusion criteria for each villus are included in online supplementary material.

Illustration of quantitation of villus immunohistochemistry staining and scoring using an 11-section scale. Panel (A) details an individual villus taken from an early-onset non-obese diabetic animal. Two versions of the villus are shown, the image on the left is unmodified, while the right image shows the result of the masking/scoring process being applied to the original image. The boxed regions indicate the section of the villus examined in part (B) of the figure. (B) The unlabeled panel at the upper left shows the unmodified section of the villus in the boxed region in (A). The subsequent panels labeled 1–10 show the same boxed region with the mask applied for each of the 10 scoring categories as follows: category 1—white, category 2—light gray, category 3—blue, category 4—light green, category 5—dark green, category 6—yellow, category 7—orange, category 8—light red, category 9—pink, category 10—black. The panel labeled “sum” shows the same spatial region as in all other panels with all 11 masks applied. All images contain the same number of pixels and are not modified in terms of scaling or zoom at any point in the quantification process.
Segmentation and quantification of villi
The color observed in IHC sections ranged from white, that is, no tissue present, to dark brown, indicating strong staining for zonulin (figure 1). For quantitation, white regions were assigned a value of 1 and brown staining was divided into 10 categories (2–11), each defined by discrete a range of RGB intensity values with successive segments corresponding to increasingly dark brown DAB staining. A digital mask was generated based on the 10 staining values with 2 representing the weakest staining and 11 representing the darkest staining. Category masks were overlaid on a final image facilitating quantitation. An example of the masking and quantitation process is shown in figure 1. The number of pixels in each mask category were counted to allow quantitation as described below. As no other antibodies or interfering signals were present, all observed staining was attributed to zonulin/haptoglobin in the tissue. Staining was quantified based on the number of pixels in each staining category within each segment. The total area of each villus was determined from the sum of the number of pixels in each category. The percentage of each staining category in each villus was calculated by dividing the number of pixels in the staining category by the total number of pixels counted in the 2–11 categories. The proportion of heavily stained cells was determined using a cut-off (defined as segment 5 and above), which we defined as high levels of zonulin expression. For each villus, an overall “staining score” was calculated by summing the percent areas of categories 5–11.
Results
Confirmation of zonulin antibody reactivity
Reactivity of the anti-haptoglobin antibody was confirmed by Western blot analysis (online supplementary figure S1). Several bands observed in liver extracts corresponded to the sizes expected for haptoglobin precursor, identified as zonulin analog in NOD mice.
IHC detection of zonulin expression levels in the intestinal tissue
A total of 111 slides were generated and analyzed, producing more than 1000 images, from which representative villi were selected using criteria described above. Tissue sections belonging to each disease category (early, late, non, and control) and tissue section (duodenum, jejunum, ileum, large intestine) were evaluated. Figure 2 shows representative IHC sections comparing zonulin expression in intestinal tissue sections of a NOR mouse (figure 2A–D) and an early-progressor NOD mouse that developed T1D before 20 weeks of age (figure 2E–H). Zonulin expression levels were generally stronger in all four tissue sections (duodenum, jejunum, ileum, and large intestine) in the NOD mouse compared with the NOR mouse. The duodenum of the NOD mouse was strongly stained throughout the villi (figure 2A) compared with villi in the corresponding NOR sections (figure 2E). The NOR tissue villi did, however, display small areas of intense staining localized to the goblet cells (figure 2E) that was not observed in villi of NOD mice (figure 2E), indicating that constitutively expressed zonulin may be stored in goblet cells in animals that do not develop T1D, and released and targeted to epithelial tight junctions in animals that develop the disease. Zonulin expression patterns observed in jejunum sections of early-progressor NOD mice were strongly stained through the villi (figure 2F), similar to that observed the duodenum tissue sections, consistently exhibiting stronger staining compared with corresponding NOR tissue (figure 2B). Ileum (figure 2G) and large intestine (figure 2H) sections in early-progressor NOD mice generally showed weaker staining compared with the duodenum (figure 2E) and jejunum (figure 2F). Intestinal sections in NOD mice generally exhibited high levels of zonulin in epithelial villi, with decreased zonulin staining toward the lamina propria and basement membrane and muscularis mucosae, a pattern not typically present in NOR mice control tissues, with goblet cells representing the only feature that exhibited significant zonulin staining in the intestinal tissue of NOR mice.
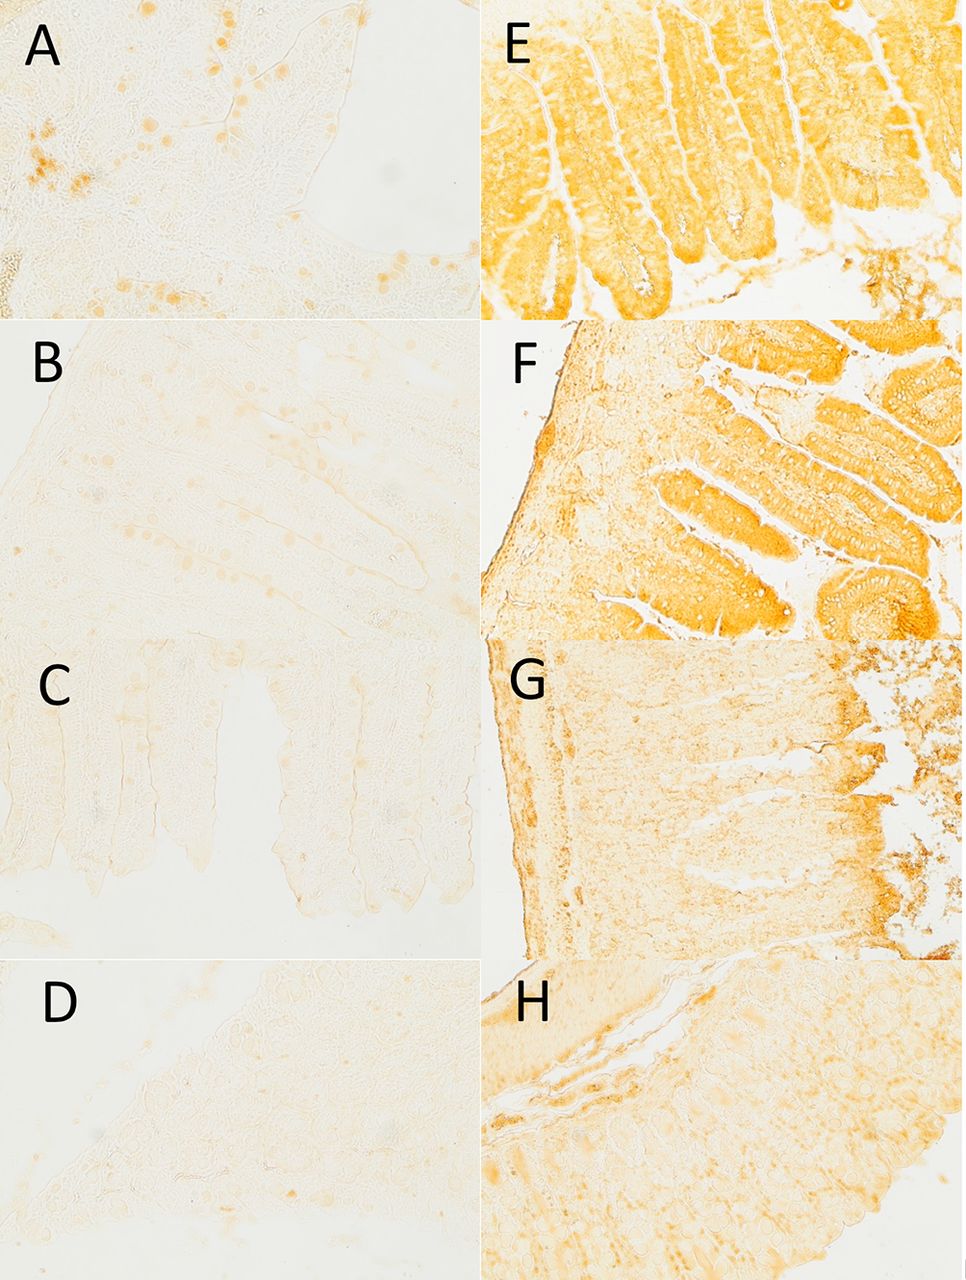
Representative sections from NOR and early-onset non-obese diabetic (NOD) mice using immunohistochemistry staining to probe for zonulin expression levels. (A–D) Zonulin immunohistochemical staining of duodenum, jejunum, ileum, and large intestinal sections of a control NOR animal. (E–H) Zonulin immunohistochemical staining of duodenum, jejunum, ileum, and large intestinal sections of an early-progressor NOD mouse.
Comparison of zonulin expression levels in spatially resolved intestinal tissue sections
Duodenal sections from an early-onset NOD mouse (figure 3A) and a NOR control mouse (figure 3B) exhibited clear visual differences in zonulin expression and localization that were more apparent following application of the scoring masks. NOD sections exhibited higher levels of staining in most areas (figure 3C), while the NOR section was devoid of staining in many of the villi apart from small “hot spots” observed near the edges of villi (figure 3D). NOD tissues also exhibited decreasing zonulin staining from the tip of the villi through the lamina propria and toward the basement membrane. This pattern was absent in the NOR tissue sections, suggesting differences in localization of zonulin expression.
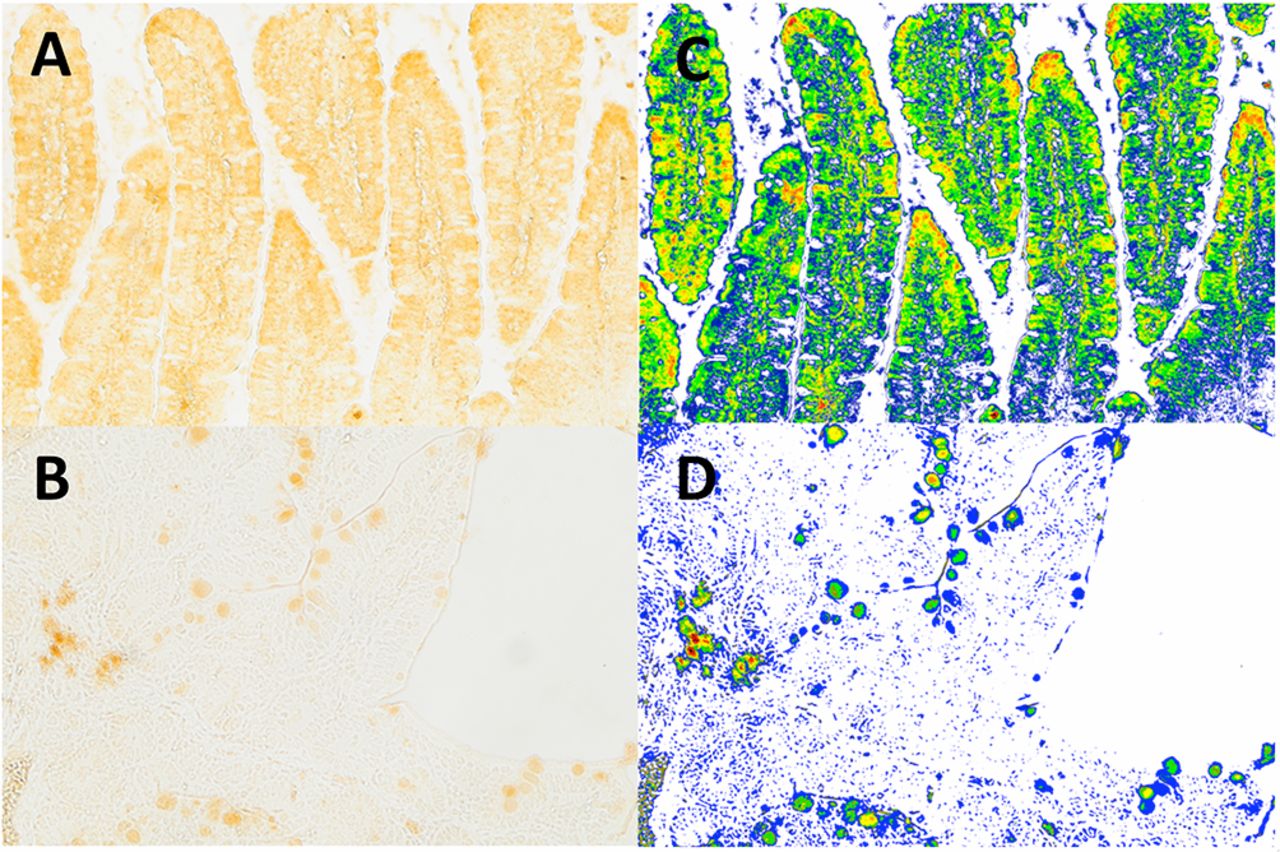
Example of quantification of zonulin staining scores in duodenal villi from an early-progressor non-obese diabetic (NOD) mouse. Duodenal sections (A) from an early-onset NOD mouse and (B) from a NOR control mouse. (C) and (D) represent the same images as in (A) and (B), but with the 11-color category masks applied and overlaid on the original images.
Comparison of zonulin expression levels in spatially resolved intestinal tissue sections for early, late, and non-progressor mice and NOR control mice
Early-progressor mice that developed T1D prior to 21 weeks of age showed significantly higher levels of zonulin expression in all sections of the small and large intestine (figure 4A) in comparison with NOR control mice (figure 4D). Late-progressor mice that developed T1D after 21 weeks of age showed high levels of zonulin throughout the intestines (figure 4B) in comparison with NOR control mice (figure 4D); however, there were no significant differences in zonulin levels along the intestine of late-progressor NOD mice (figure 4B). Non-progressor NOD mice that did not develop the disease up to an age of 32 weeks exhibited clearly lower zonulin levels in the small intestines, that is, duodenum, jejunum, and ileum (figure 4C), compared with early and late progressors. In the large intestines of non-progressor mice, the IQR of zonulin scores was large, but there was a large discrepancy between the average score and the median, which was near zero, indicating that this score may be artifactually overestimated due to outliers, and that low zonulin scores are probably most representative of the large intestine in non-progressor NOD mice. Control NOR mice exhibited significantly lower zonulin levels in the duodenum/jejunum when compared with the ileum/large intestine, and lower zonulin levels throughout the intestines compared with early, late, and non-progressors.
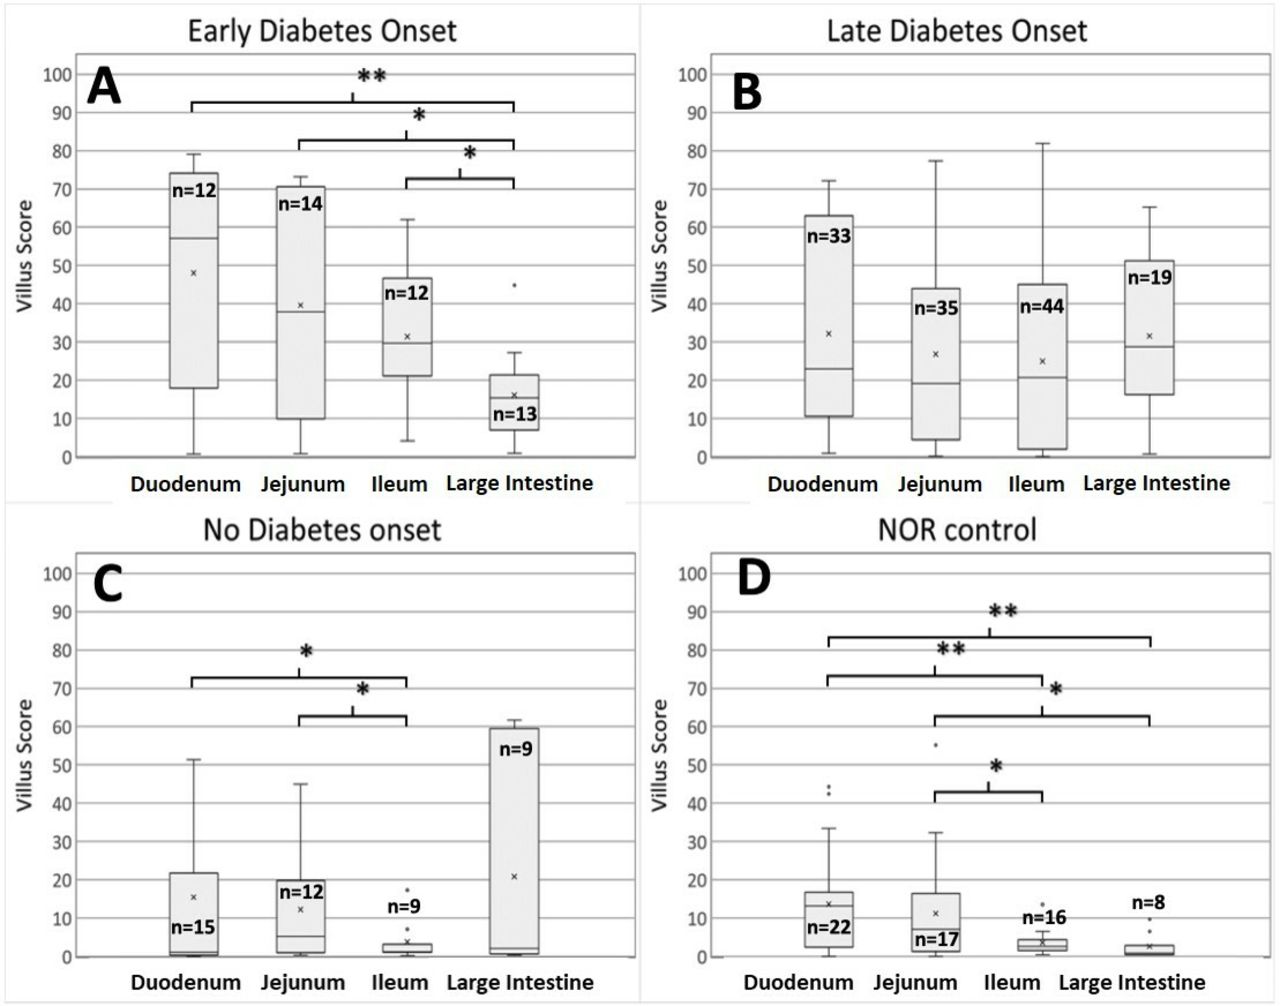
Box-and-whisker plot comparison of zonulin expression levels along the intestines for early, late, and non-progressor non-obese diabetic (NOD) mice and for NOR control mice. (A) Box-and-whisker plots of intensity scores from early-progressor NOD mice. (B) Box-and-whisker plots of intensity scores from late-progressor NOD mice. (C) Box-and-whisker plots of intensity scores for non-progressor NOD mice. (D) Box-and-whisker plots of intensity scores for NOR control animals. The number of villi used in the analysis of each tissue section is indicated inside each box. The p values calculated for comparison groups indicated by brackets are as follows: *p<0.05, **p<0.01.
Comparison of duodenal, jejunal, ileal, and large intestine zonulin expression levels in early, late, and non-progressor NOD mice
Zonulin expression levels were most elevated in the duodenum of early-progressor NOD mice, followed by late-progressor mice, non-progressor mice, and finally NOR control mice (figure 5A). A similar trend was observed in the jejunum (figure 5B). In the ileum, non-progressor NOD mice exhibited zonulin levels comparable with NOR mice, whereas the early-progressor and late-progressor mice exhibited elevated levels of zonulin expression (figure 5C). In the large intestine, early-progressor and late-progressor NOD mice exhibited elevated zonulin levels compared with NOR mice (figure 5D). While non-progressor NOD mice had a larger IQR than NOR mice in the large intestines, the median score was close to that observed for NOR mice, suggesting that increased sampling may yield scores for non-progressor NOD mice in the large intestines similar to that of NOR mice.

Box-and-whisker plot comparison of zonulin expression levels between early, late, and non-progressor non-obese diabetic (NOD) mice and NOR control mice in the duodenum, jejunum, ileum, and large intestines. (A) Box-and-whisker plot of intensity staining scores of duodenum sections of early, late, and non-progressor NOD mice and NOR control sections mice. (B) Box-and-whisker plot of intensity staining scores of jejunum sections of early, late, and non-progressor NOD mice and NOR control sections mice. (C) Box-and-whisker plot of intensity staining scores of ileum sections of early, late, and non-progressor NOD mice and NOR control sections mice. (D) Box-and-whisker plot of intensity staining scores of large intestine sections of early, late, and non-progressor NOD mice and NOR control sections mice. The number of mice used in each category group is indicated in each box. P values for comparisons indicated by brackets had the following values: *p<0.05, **p<0.01, ***p<0.001.
Insulitis and islet health in early, late, and non-progressor mice
Representative pancreata of were analyzed in early, late, and non-progressor NOD mice in comparison with NOR control mice using immunohistofluorescence staining for insulin to detect functioning islet β cells, glucagon to detect functioning α cells, and 4′,6-diamidino-2-phenylindole (DAPI) to counterstain the nuclei of surrounding acinar cells and the nuclei of infiltrating monocytes of the immune system present during a state of insulitis (figure 6). Figure 6A shows representative islets from NOR control mice in the early-onset age category. These islets were predominantly comprised of functioning β cells and surrounded by a thin layer of α cells on the periphery of the islets. Even in NOR control mice, some evidence of insulitis was evident, as shown in the middle panel of figure 6A; however, there was no evidence of loss of β cells and these mice had normal ad libitum feeding and fasting BGL levels at the time of sacrifice. Older NOR control mice sacrificed at ages in the late-progressor to non-progressor range had healthy islets with some non-symptomatic insulitis as observed in NOR mice sacrificed in the early-progressor age range (figure 6B). In contrast, early-progressor NOD mice displayed a broad spectrum of insulitis and islet health ranging from islets in a state of strong peri-insulitis, that is, a largely intact islet surrounded by a thick layer of monocytes (figure 6C, left panel) to islets in a state of advanced destruction and loss of β cells (figure 6C, middle panel), to islets largely in a state of post-insulitis in which the islets are entirely depleted of β cells and only the contracted remnant of the islet comprised predominantly of α cells remained (figure 6C, right panel). A similar distribution of islets was observed in late-progressor mice, ranging from intact islets in an advanced state of peri-insulitis (figure 6D, left and middle panels) to completely atrophied islets post insulitis and devoid of functional β cells (figure 6D, right panel). Finally, non-progressor mice contained largely intact islets free from insulitis (figure 6E, left and right panels) to atrophic post-insulitis islets completey devoid of functioning β cells (figure 6E, middle panel). It should be noted that islets were readily detected (~n=15/section) in the pancreata of NOR control mice, but islets were rare and difficult to identify in end-stage NOD mice (n=~4–5 islets/section). Non-progressor NOD mice fell in the middle with about 10 islets/section.

Immunohistofluorescence imaging of islets in early, late, and non-progressor non-obese diabetic (NOD) mice and in age-matched NOR control mice. (A) The three panels show representative islets from NOR control mice in the early-progressor age range of 12–21 weeks. (B) The three panels show representative islets from NOR control mice in the late-progressor and non-progressor age range of 22–34 weeks. (C) Representative islets from early-progressor NOD mice. (D) Representative islets from late-progressor NOD mice. (E) Representative islets from non-progressor NOD mice. Red color indicates positive staining for insulin indicating functioning β cells. Green color indicates positive staining for glucagon indicating functioning α cells. Blue color indicates DAPI staining of the nuclei of acinar cells and of monocytes of the immune system. All images were collected with an objective lens magnification of 20× except for panels labeled with an asterisk, which were collected with an objective lens magnification of 40×.
Discussion
Our IHC-based results indicated that zonulin expression levels were generally elevated throughout the intestines in all NOD mice that reached end-stage T1D, regardless of the age of onset, in comparison with non-progressor NOD mice or compared with NOR control mice. Zonulin expression along the intestines varied strongly depending on whether the NOD mouse was an early progressor, late progressor, or non progressor to end-stage T1D. Zonulin expression levels were significantly elevated in the small intestine in both early-onset and late-onset NOD mice in comparison with non-progressor NOD mice and NOR control mice. This observation, if confirmed in larger studies and by using an independent measure of zonulin expression levels such as qPCR, may indicate that gut permeability changes in the small intestine could be linked to T1D progression. Patterns of zonulin expression in the large intestines were less clear, but also suggested that elevated permeability was characteristic of mice that progressed to end-stage NOD, and larger studies will be required to resolve zonulin expression patterns in this section of the gut. In all tissues examined, zonulin expression levels were the lowest in the large intestines of NOR control mice. Zonulin expression levels were significantly elevated in the large intestines of the early-progressor and late-progressor NOD mice compared with NOR control mice. The median score for the large intestines of non-progressor NOD mice was similar to that of NOR control mice.
Examination of how zonulin expression levels varied along the intestines by age of onset indicated that zonulin expression levels were significantly elevated in early-progressor NOD mice in comparison with NOR mice in all sections of the small and large intestines. A distinct trend in zonulin expression levels was observed in early-progressor NOD mice with the highest zonulin levels occurring in the duodenum and decreasing along the jejunum, ileum, and large intestine. This trend was also observed in NOR mice, although the zonulin expression levels were significantly lower levels in all sections. In late-progressor NOD mice, zonulin levels were elevated in the duodenum in comparison with NOR mice, similar to early-progressor NOD mice; however, the high zonulin expression levels in late-progressor NOD mice persisted in all sections of the small and large intestine in contrast to the decreasing levels observed in early-progressor NOD mice and in NOR mice. Non-progressor NOD mice exhibited zonulin expression levels in the small intestine comparable with NOR mice, and the median zonulin expression score in the large intestine was also comparable with NOR mice.
The spatial trends and patterns of gut permeability observed in NOD mice, and the differences associated with age of onset can be considered in terms of potential dietary and gut microbial diabetogenic triggers such as dietary gluten or diabetogenic gut microbes. The small intestines of end-stage NOD mice exhibited significantly elevated zonulin expression levels, and therefore presumably increased permeability, in early-onset and late-onset mice, that is, mice that progressed to end-stage T1D by 34 weeks. Significantly increased permeability of the small intestines would expose the immune system of the NOD mice to significantly more potentially diabetogenic dietary and microbial antigens in comparison with non-progressor NOD mice and NOR control mice. While the small intestine has orders of magnitude fewer gut microbes in comparison with the large intestine, the bacterial populations within the small intestines are not insignificant, as indicated by the fact that Peyer’s patches, which survey gut microbial populations for pathogenic bacteria, can be found throughout the small intestines, although they tend to be more abundant in the ileum. Zonulin expression levels were also statistically elevated in the large intestines of early-progressor and late-progressor NOD mice in comparison with NOR mice and compared with the median score values of non-progressor NOD mice, indicating that the large intestine must also be considered a potential site of gut microbial triggering of T1D.
While previous work examining zonulin levels in T1D has largely focused on the human studies that do not allow investigations of zonulin expressions along the intestines, some animal model studies investigating zonulin expression levels along the intestines have been reported. Nouri et al21 and Watts et al2 probed zonulin levels in mouse and rat models, respectively, reporting variations along the small intestine and increases in a mouse model of multiple sclerosis and a rat model of diabetes. Nouri et al reported higher levels of zonulin in animals that developed T1D,21 and spatial variations within the small intestine largely matched previously reported studies.2 21 Many reported studies of intestinal permeability are based on measurement of serum zonulin levels using a commercial ELISA or a more traditional sugar absorption test such as the lactulose-mannitol test.7 19 31–33 However, measurements of serum zonulin levels as an indicator of intestinal permeability lack spatial information regarding zonulin expression levels in the gut, which, if identified, could indicate the most likely intestinal sites of elevated exposure of the host immune system to gut microbes.
Other concerns regarding gut permeability inferences based on serum zonulin levels is the failure of some commercial ELISA kits to react with pre-HP2 (zonulin).34 35 This can lead to erroneous conclusions regarding zonulin expression levels. Pre-HP2 is biologically active (as zonulin) and found in many places outside the gut and is processed in the endoplasmic reticulum into haptoglobin, a protein that does not share the biological function of zonulin but is active in the blood.14 Recommendations have been made to cease using serum zonulin levels as an indicator of intestinal permeability, at least when the zonulin concentration measurements are based on commercial ELISAs.34 Also, while zonulin plays a clear role in regulation of tight junctions and corresponding intestinal permeability, it is not the only protein involved in this process and therefore future studies investigating the link between T1D and gut permeability may consider other related proteins such as occludins and claudins.7 8 36 Zonulin expression can also be influenced by dietary and gut bacterial alterations.37 For example, dietary restriction of gluten has been reported to reduce T1D onset in the BioBreeding rat model of T1D,17 19 while experiments with rabbits by Asmar et al showed links between small intestine exposure to bacteria and zonulin expression.13
It has also been observed that alterations to the gut microbiome and/or diet can increase the T1D incidence rate in “at risk” populations,17 37 which may be caused by, or correlate with, changes in intestinal permeability and zonulin expression levels throughout the gut. Increased contact between metabolites, bacteria, and the immune system in an already abnormal immune system may provide a direct link between gut alterations and the autoimmune attack on β cells of the pancreas. All NOD mice used in this study were given ad libitum access to identical food products, so the relationship between gut bacterial alterations, diet, and zonulin expression was not characterized in this study.
Conclusion
Spatially resolved zonulin expression levels along the small and large intestines have not been previously documented in the NOD mouse model of T1D, nor has an examination of differing zonulin expression based on the age of T1D onset been reported. Our data show that zonulin expression levels were significantly elevated in all sections of the small intestine of NOD mice that progressed to end-stage T1D in comparison with both non-progressor NOD mice and compared with NOR control mice. Zonulin expression levels also varied strongly along the intestines in early-progressor NOD mice with the highest levels observed in the duodenum and jejunum sections and much lower levels were observed in the ileum and large intestine sections. The data also indicated that intestinal zonulin levels tended to be most elevated in mice that proceeded to end-stage T1D the fastest, even in comparison with NOD mice that reached the same T1D endpoint at a later age. Given the linkage between intestinal zonulin expression levels, gut permeability, and T1D progression, these results provide impetus for further studies of how T1D progression in humans may be linked to spatially dependent elevation of zonulin expression levels in the gut.
Acknowledgments
The studies were supported by the Miami University Undergraduate Research Award program, Undergraduate Summer Scholars program, and Committee on Faculty Research award program. MAK would like to acknowledge support of Miami University and the Ohio Board of Regents for funding to establish the Ohio Eminent Scholar Laboratory where the work was performed. The authors would like to thank Dr Richard Edelman and Matt Duley for their insight and assistance in generating the microscopy data and analysis of the data using Image Pro plus.
References
Footnotes
Contributors Made substantial contributions to conception and design: WCJ, MAK. Made substantial contributions to acquisition of data, or analysis and interpretation of data: WCJ, AHS, MAK. Involved in drafting the manuscript: WCJ, MAK. Involved in revising the manuscript critically for important intellectual content: WCJ, MAK. Gave final approval of the version to be published, takes public responsibility, and can be held accountable for all aspects of the work: MAK.
Funding The authors have not declared a specific grant for this research from any funding agency in the public, commercial or not-for-profit sectors.
Competing interests None declared.
Patient consent for publication Not required.
Provenance and peer review Not commissioned; externally peer reviewed.
Data availability statement Data are available in a public, open-access repository.