Article Text

Abstract
Objective This study investigated the effects of the inflammatory tissue response (ITR) to an insulin infusion set (IIS) on insulin bolus spread over wear time, as well as the effect of cannula insertion angle on the ITR, bolus shape, and pump tubing pressure.
Research design and methods Angled or straight IISs were inserted every other day for 14 days into the subcutaneous tissue of 11 swine and insulin was delivered continuously. Prior to euthanasia, a 70 µL bolus of insulin/X-ray contrast agent was infused while recording a pressure profile (peak tubing pressure, pmax; area under the pressure curve, AUC), followed by the excision of the tissue-catheter specimen. Bolus surface area (SA) and volume (V) were assessed via micro-CT. Tissue was stained to analyze total area of inflammation (TAI) and inflammatory layer thickness (ILT) surrounding the cannula.
Results A bolus delivered through an angled IIS had a larger mean SA than a bolus delivered through a straight cannula (314.0±84.2 mm2 vs 229.0±99.7 mm2, p<0.001) and a larger volume (198.7±66.9 mm3 vs 145.0±65.9 mm3, p=0.001). Both decreased significantly over wear time, independent of angle. There was a significant difference in TAI (angled, 9.1±4.0 mm2 vs straight, 14.3±8.6 mm2, p<0.001) and ILT (angled, 0.7±0.4 vs straight, 1.2±0.7 mm, p<0.001). pmax (p=0.005) and AUC (p=0.014) were lower using angled IIS. As ILT increased, pmax increased, while SA and V decreased.
Conclusions The progression of the ITR directly affected bolus shape and tubing pressure. Although straight insertion is clinically preferred, our data suggest that an angled IIS elicits lower grades of ITR and delivers a bolus with lower tubing pressure and greater SA and V. The subcutaneous environment plays a crucial role in IIS longevity, and the insertion angle needs to be considered in future IIS designs and clinical trials.
- continuous subcutaneous insulin infusion
- insulin delivery
- animal model(s)
- inflammation
This is an open access article distributed in accordance with the Creative Commons Attribution Non Commercial (CC BY-NC 4.0) license, which permits others to distribute, remix, adapt, build upon this work non-commercially, and license their derivative works on different terms, provided the original work is properly cited, appropriate credit is given, any changes made indicated, and the use is non-commercial. See: http://creativecommons.org/licenses/by-nc/4.0/.
Statistics from Altmetric.com
Significance of this study
What is already known about this subject?
The variability of insulin absorption increases over infusion set wear time and it may be attributed to the inflammatory tissue response.
What are the new findings?
As the inflammatory tissue response progresses over infusion set wear time, the bolus volume and bolus surface area decrease, and this effect is diminished using angled insulin infusion catheters instead of straight infusion sets.
How might these results change the focus of research or clinical practice?
The angle of insertion needs to be considered in future insulin infusion set design and clinical trials.
Introduction
The number of patients with type 1 and type 2 diabetes worldwide using continuous subcutaneous insulin infusion (CSII) therapy to manage their blood glucose (BG) levels is rising.1 Closed-loop and hybrid closed-loop automated insulin delivery systems have become accessible and show promising results by improving BG control, decreasing the incidence of hypoglycemia, and alleviating some of the burden of the disease.2–4 The weak link in the success of insulin pump therapy and artificial pancreas systems is still the insulin infusion set (IIS), in particular the cannula residing in the subcutaneous tissue of the patient. Manufacturers, regulators, and professional societies currently recommend changing a commercial Teflon IIS every 2–3 days due to an increase in insulin absorption variability and therefore worsening of glycemic control.5 6 An ideal IIS would produce rapid and consistent absorption of insulin from the subcutaneous tissue into the bloodstream from dose-to-dose and day-to-day for more than 7 days, and minimize the formation of scar tissue that may adversely affect insulin absorption and future pump use.
It is debated whether a clinical difference exists between CSII catheters inserted at 90° compared with angled insertions (typically 30°–45°).7 8 A 90° (straight) IIS is generally preferred by patients due to its easier method of insertion, especially when teaching children or patients with poor dexterity.8 9 However, especially in slim patients, the risk of intramuscular injection is greater when inserting at 90°, which increases the incidence of cannula kinking, occlusion, insertion pain and hypoglycemia.7 10 It has been reported that using angled IIS reduces the risk of cannula kinking and dislodgment.8 9 11 Although an increasing number of patients use Teflon IIS every day, there is a lack of systematic in vivo studies on the impact of angle of insertion on the subcutaneous inflammatory tissue response and the pattern of insulin delivery over time.
We have previously reported that the inflammatory response to the cannula of an IIS and insulin/preservatives can have a significant effect on insulin absorption (pharmacokinetics).12 In the present study, we combined micro-CT imaging, histopathology and insulin tubing pressure analysis to investigate the progression of the inflammatory tissue response to straight and angled CSII catheters over time in a non-diabetic swine model. This animal model has been successfully used in prior studies by our group and collaborators,12 13 and has been shown to be the most adequate for human skin and adipose tissue wound healing.14 We hypothesized that the change in thickness of the layer of acute and chronic inflammatory tissue surrounding the cannula of a CSII catheter has a direct effect on insulin spread (bolus volume and surface area) and tubing pressure. We further hypothesized that the angle of insertion (90° vs 30°) would significantly affect the total area of inflammation, the thickness of the inflammatory layer surrounding the cannula, the bolus surface area, bolus volume, and pump tubing pressure during an insulin bolus.
Research design and methods
Eleven healthy Yorkshire female swine, aged 3–6 months and weighing 60–70 kg, were used as a model of human subcutaneous tissue.14 15 Female swine were chosen over male animals due to their larger abdominal surface area. Swine were housed in a gated pen in groups of three for 1 week of acclimation, and then separated by gated walls (ensuring snout contact) during the following 2 weeks of the study. All medications are listed in online supplementary table S1.
Supplemental material
CSII catheter insertion
Animal studies took place over a period of 2–3 weeks (1 week of acclimation week followed by 2 study weeks with two to three animals studied in tandem). After placing the animals under general anesthesia using isoflurane, commercially available CSII catheters with Teflon cannulas were inserted into the subcutaneous tissue of the shaved abdomen every other day for 14 days using aseptic technique (online supplementary figures S1 and S2). Sterile benzoin was applied to the skin surface to enhance adhesion of the CSII catheter adhesive, sparing the insertion site. Sufficient space was left between catheters to ensure proper excision without overlap. Both angled and straight Teflon catheters were inserted using the spring-loaded automated inserter. Five swine had CSII catheters inserted at a 90° angle (Inset, Animas Corporation, West Chester, Pennsylvania, or Quickset Medtronic MiniMed, Northridge, California; 6 mm cannula length) and six swine at a 30° angle (Inset 30 Animas Corporation or Silhouette Paradigm Medtronic MiniMed; 13 mm cannula length). Sterile Tegaderm adhesive bandages were placed over the CSII catheters and infusion tubing to secure attachment to the skin and protect from moisture/humidity during wear time. Therapeutic athletic kinesiology tape (KT Health, Vilnius, Lithuania) was used to cover the abdomen and provide additional protection against catheter dislodgment due to the movement of the animals.
Insulin infusion and BG monitoring
Each catheter was connected to an insulin pump (OneTouch Ping, Animas Corporation or Paradigm REAL-Time Revel, Medtronic MiniMed) stored within a custom protective vest (Lomir Biomedical, Notre-Dame-de-l’Ile-Perrot, Quebec, Canada; online supplementary figure S2). A basal infusion of dilute Lispro/Humulog insulin (Eli Lilly, Indianapolis, Indiana) was continuously delivered throughout the duration of the study at a concentration of 5 units/mL (U-5) at a rate of 0.05 units/hour. A 7-unit (70 µL) bolus was infused over 45 s before each meal to mimic the everyday use of the pump therapy. Insulin Lispro was diluted per manufacturer’s recommendation with a sterile diluent (Eli Lilly). BG levels were monitored with intermittent capillary BG measurements using a commercial glucose meter and test strips (Bayer Contour Next, Parsippany, New Jersey).
Tubing pressure recording
On the final day of the study, swine were placed under general endotracheal anesthesia and a final 70 µL bolus of dilute insulin and X-ray contrast agent (70% U-100 Lispro, 30% IsoVue 300) was infused. A pressure sensor (PendoTECH, Princeton, New Jersey) was interconnected between the IIS and the pump, and connected to a data logger (MSR Electronics, Switzerland). A custom amplifier supplied by Capillary Biomedical was permanently attached to the pressure sensor (online supplementary figure S3). Pressure data were standardized to a baseline of 5 s and a maximum time of 300 s (5 min). The peak pressure (pmax) and area under the curve (AUC) were determined for each bolus data set. AUC measurements were calculated using the trapezoidal method.
Tissue excision and imaging
After 5 min of pressure recording, CSII catheters and surrounding tissue were excised and specimens gently frozen in isopentane cooled with dry ice (Iso-CO2) for subsequent micro-CT imaging. Following removal of the CSII catheter-tissue specimens, each swine was euthanized by intravenous injection of Beuthanasia (1 mL/4.5 kg body weight) solution while under general anesthesia.
After excision, frozen CSII catheter-tissue specimens were imaged using a micro-CT scanner (Inveon, Siemens Medical Solutions USA, Knoxville, Tennessee) to determine the three-dimensional (3D) distribution pattern of insulin/X-ray contrast agent in the subcutaneous tissue. The surface area and volume of the insulin/contrast agent bolus infused into the subcutaneous tissue were measured using 3D visualization imaging software (Amira, Thermo Fisher Scientific, Hillsboro, Oregon). The excised tissue was then fixed, grossed, sectioned, and stained with H&E and Masson’s trichrome stain. The area of inflammation (Rasband, WS, ImageJ, US National Institutes of Health, Bethesda, Maryland, 1997–2018; https://imagej.nih.gov/ij/) and the thickness of the inflammatory layer (Leica Biosystems, Buffalo Grove, Illinois) were measured on all catheters with ≥35% view of the channel (online supplementary figures S4 and S5). The percentage of the catheter channel shown was determined by measuring the length of the void length and dividing it by the length of the catheter (90°=6 mm; 30°=13 mm).
Statistical analysis
Micro-CT, tissue histology, and tubing pressure data were analyzed using analysis of variance with generalized linear model. Kruskal-Wallis test was used for data not normally distributed and post-hoc analyses were performed with Bonferroni correction. Pearson correlation and linear regression analysis were used to examine relationships between variables of interest. A p<0.05 was set for statistical significance. Statistical analyses were performed with SYSTAT V.13.0 and GraphPad Prism V.5.0 (GraphPad Software, San Diego, California).
Results
The methods described above were successfully carried out in 11 swine with no adverse events or symptomatic hypoglycemia. We inserted a total of 48 angled and 40 straight catheters. One straight and two angled IIS were accidentally removed and thus excluded from analysis. Two IIS produced a pump occlusion alarm (90° inserted for 4 days and 30° inserted for 2 days) when delivering a bolus of insulin/X-ray contrast agent.
Tissue histology images
A total of 66 catheters were included in the analysis of tissue histology (online supplementary tables S3 and S4). Samples were included if the histology image showed at least 35% of the cannula channel. The mean channel view was 70.6% for angled and 90.1% for straight cannulas (p<0.001).
In general, the total area of inflammation increased consistently from day 0 to day 8 around both CSII cannula types, then remained relatively stable from day 8 to day 14 (figure 1A). On average, the total area of inflammation was significantly larger around Teflon cannulas inserted at 90° compared with those inserted at 30° (p<0.001; table 1). Inflammation area was significantly larger around 90° cannula compared with 30° cannula on days 8–14 postinsertion (p<0.05; figure 1A).

Histopathology. (A) Area of inflammation and (B) thickness of inflammatory layer around the cannulas of CSII catheters inserted at 30° and 90° over wear time. Values are shown as mean±SD, n=76 catheters in each group; *p<0.05 vs 30°, ANOVA-GLM. Micro-CT. (C) Bolus surface area and (D) bolus volume over catheter wear time. Values are shown as mean±SD, n=66; *p<0.05 vs 90°, +p<0.05 vs day of insertion, ANOVA-GLM with Bonferroni correction (micro-CT image for day 0, angled CSII catheter not available). (E) Panel of representative images of tissue histology and micro-CT images of catheter-tissue specimens for each day. Contrast agent spread in the tissue is shown in orange, and CSII catheter hub on skin surface in teal. Trichrome stains of representative histology slides show the layer of inflammatory tissue over time around the void (white) left by the cannula after removal. Fibrin and red blood cells are stained red; collagen/connective tissue is stained light or dark blue. Blue and orange scale bars are equivalent to 3 mm. ANOVA-GLM, analysis of variance-generalized linear model; CSII, continuous subcutaneous insulin infusion.
Summary of data averaged over all days
A thick layer of inflammatory tissue (approximately 900 μm) already developed around the 90° straight cannula after 2 days of wear time. The layer of inflammatory tissue around the 30° angled cannula was significantly thinner after 2 days of wear time than the 90°cannula (figure 1B; p=0.005 vs 30°). The layer of inflammatory tissue around each Teflon cannula varied in composition, thickness, and continuity. Inflammatory layer thickness around the 90° cannula consistently increased from day 0 to day 10, and then stabilized through day 14. Inflammatory layer thickness around the 30° cannula increased from day 0 to day 4, and then stabilized through day 14 (figure 1B). The layer of inflammatory tissue around the 30°cannula was significantly thinner on day 8 through day 14 of wear time, compared with the 90° cannula. Layer thickness around the 90° cannula was consistently thicker compared with the 30° cannula over 2 weeks of wear time (p<0.001; figure 1B and table 1).
Micro-CT images
Seventy-six catheters were included for micro-CT image analysis (online supplementary table S2). Catheters were excluded if a pump alarm occlusion occurred (n=2) or no contrast was detected in the tissue (n=1). While studying the first animal, micro-CT methods were developed for all subsequent studies and thus all eight CSII catheters from this animal were not included in the analysis.
The 70 µL bolus of insulin and X-ray contrast agent mixed with the tissue fluid adjacent to the cannula, greatly increasing the measured volume and surface area of the bolus within the tissue. The average volume of a bolus of insulin/X-ray contrast agent in the subcutaneous tissue was three times larger than the infused 70 µL. Contrast agent density was highest adjacent to the cannula orifice and lowest in the tissue several millimeters away from the orifice.
Although the pump was always set to deliver 7 units, in four instances (5%) of all included IIS, less than 70 µL was detected within the tissue (1× angled, 3× straight) without an occlusion alarm. In one instance (straight, catheter excluded from analysis), no contrast agent entered the tissue, again without a pump occlusion alarm. Independent of wear time, a bolus of insulin/X-ray contrast agent delivered through catheters inserted at 30° had a significantly larger mean surface area (p<0.0001) and volume (p=0.001) than those delivered through a 90° catheter (table 1). There was no difference between angled and straight CSII catheters in bolus surface area to volume ratio.
The surface area and volume of insulin/X-ray contrast bolus delivered into the subcutaneous tissue around both types of CSII catheters generally decreased for several days after insertion, then stabilized (figure 1C,D). Of clinical interest, the surface area of the bolus delivered through the 90° straight cannula into the subcutaneous tissue was significantly smaller than the surface area delivered through the 30° angled cannula on day 2 and day 4 of wear time (figure 1C; p<0.05). The volume of a bolus delivered through a straight cannula into the subcutaneous tissue was significantly smaller than the volume delivered through an angled cannula on day 2 of wear time (figure 1D; p<0.05). A bolus delivered through a 90° straight cannula had a significantly smaller surface area on days 2, 4, 10, 12, and 14 compared with the day of insertion (figure 1C; p<0.05). The surface area of a bolus delivered through an angled cannula was not significantly different on all days of wear time compared with day 1, except significantly decreased on day 4 (figure 1C). In general, the bolus volume was higher on the day of insertion (day 0) compared with all days postinsertion when infused through both types of CSII catheters (figure 1D). This difference in bolus volume was statistically significant on day 4 (90°) and day 8 (30°) versus day 1. Measured volume was on average three times the infused volume of 70 µL. For both catheter types, the volume and surface area of a bolus decreased over 4 days before leveling out at values >70 µL (figure 1D).
Twenty-four of the angled cannulas were observed to kink (52%) within the subcutaneous tissue by micro-CT imaging, and 13 of the straight cannulas (43%). Kinks most commonly occurred immediately below the dermis or just proximal to the cannula tip.
Tubing pressure
The maximum tubing pressure (pmax) as well as the area under the pressure curve (AUC) measured over 5 min were significantly higher for straight CSII catheters when infusing a bolus of 70 µL (table 1). Independent of wear time the median pmax was 44% lower in angled infusion sets compared with straight CSII catheters (p=0.005), while the median AUC was reduced by 50% (p=0.01). The AUC was especially high on days 0, 2, and 4 for straight IIS and dropped to values similar to angled IIS after 6 days of wear time (n.s.; figure 2). It is important to note that the SDs of pmax and AUC were quite large, as we did not exclude extreme values from pump occlusion alarms or leaks onto the skin (figure 2).

Pressure analysis. (A) Changes in maximum tubing pressure over wear time. (B) Changes in area under the pressure curve over wear time. Values are shown as mean±SEM.
Correlations
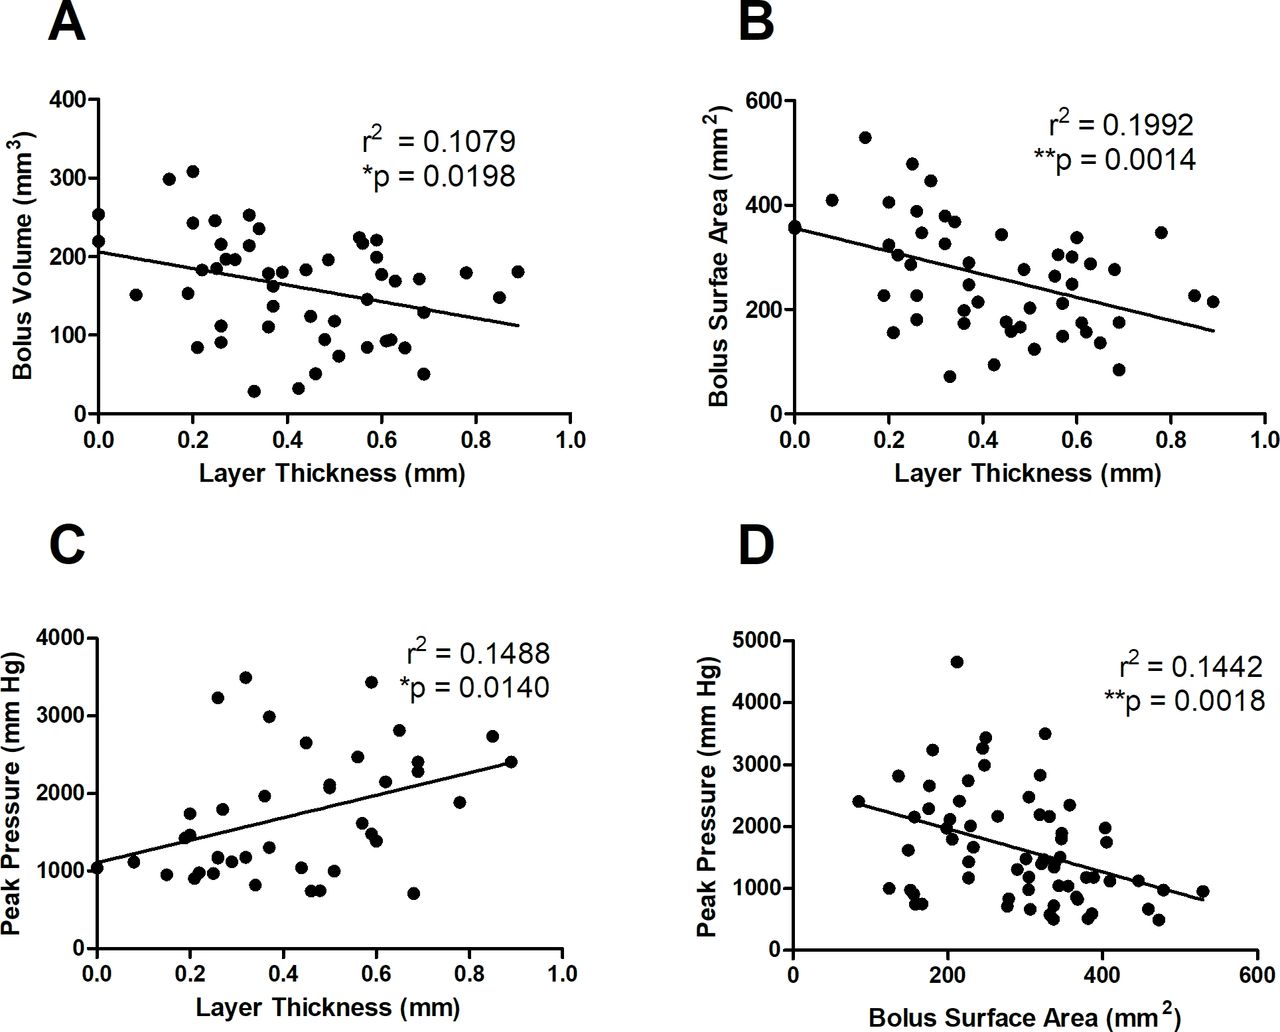
To better understand potential relationships among the variables described above, we performed correlations between the micro-CT, histology, and pressure analysis. We found that as the thickness of the inflammatory layer increased, the volume (p<0.05) and surface area (p<0.005) of a bolus decreased, while pmax increased (p<0.05; figure 3A–C). Additionally, as pmax increased, the bolus surface area decreased (figure 3D).
Correlations. (A) Layer of inflammation versus bolus volume. (B) Layer of inflammation versus bolus surface area. (C) Layer of inflammation versus peak tubing pressure. (D) Bolus surface area versus peak tubing pressure. *p<0.05, **p<0.005
Discussion
Our findings suggest that catheters inserted at a 30° angle elicit a significantly lower inflammatory response compared with catheters inserted at 90°. The 30° insertion angle also resulted in a greater volume and surface area (spread) of an insulin bolus, and was associated with lower tubing pressures compared with straight IIS. The novelty of this work stems from the combination of pressure analysis, micro-CT imaging, and histopathology, giving greater insight into the mechanisms of insulin absorption variability and other CSII therapy failure modes.
The acute inflammatory response following CSII cannula insertion is triggered by the initial trauma of piercing the epidermis, dermis, and subcutaneous tissue with a steel introducer needle and Teflon cannula.16 17 Consequently, insulin is delivered into an area of damaged cells, connective tissue and extracellular matrix, characterized by a loss of functional capillary and lymphatic vessels.16 Over wear time, neutrophils, macrophages, and fibroblasts infiltrate the region to form a layer of acute and chronic inflammatory tissue around the Teflon cannula containing proteolytic enzymes.16 The accumulation of inflammatory cells, thrombus, and fresh collagen (designated layer of inflammation) requires insulin to travel the path of least resistance toward intact and functional capillaries and lymph vessels.12 18 A surrounding layer that is thick, dense, and continuous will significantly hinder the dispersion and diffusion of insulin molecules to the surface of functional capillary and lymph vessels for absorption into the circulation. Insulin may be degraded within the wound or travel upward onto the skin surface along the path of least resistance, due to a non-compliant continuous layer of inflammatory tissue surrounding the cannula. This concept of variable flow resistance due to a mechanical barrier may explain the high variability in bolus shape patterns over wear time observed in this study (figure 1E). Our results show that with increasing thickness of the inflammatory layer, the volume and surface area of an insulin bolus in the subcutaneous tissue decrease and insulin tubing pressure increases. This may suggest that insulin flow into the adjacent tissue is interrupted, possibly affecting glycemic control in a real-life setting.
Independent of the cannula angle, both the inflammatory layer thickness and the area of inflammation increased steadily over the first 4 days of wear time. Patients are instructed to change their IIS after 2–3 days to reduce the incident of skin irritation, poor glycemic control, and occlusion rates, all of which increase by 40% by day 5.5 6 19 With increasing wear time, insulin absorption into the circulation becomes more variable and less reliable, resulting in an incidence of unexplained hyperglycemia of up to 68% in the first 72 hours after catheter insertion.8 20 21 Wearing the infusion set for 4 days instead of 2 days can increase the risk of hyperglycemia by almost 40%.6
The decrease in compliant healthy tissue over wear time may explain the rise in tubing pressure (pmax, AUC), as insulin has increasing difficulty finding a path through the subcutaneous tissue. Tubing pressure was decreased by 50% using angled compared with straight CSII catheters, suggesting an easier flow of insulin into the surrounding tissue. Patients experience both occlusions triggering a pump alarm and the so-called ‘silent occlusions’ in their clinical routine with a reported increase in occlusions after 3 days of IIS use.5 22 While we only registered two pump occlusion alarms, we saw 11 cases of elevated pressure profiles where tubing pressure did not return to baseline after bolus delivery but did not cause the pump to alarm (see online supplementary material II). In five of these instances without pump alarm, the delivered volume was much less than the expected 70 µL (between 0 and 50 µL). In a real-life setting, these types of events could worsen BG control and increase the risk for hypoglycemia and diabetic ketoacidosis (DKA).
Supplemental material
We found a significant difference in tissue response and insulin bolus distribution using CSII catheters of different angles. There is limited literature on the number of patients using an angled IIS and/or the reasons for choosing it. Published literature on catheter angle of insertion draws conclusions mainly from patient testimonies, case studies, and/or surveys, or does not differentiate between angles but merely cannula material.10 11 23 24 Heinemann and Krinelke25 reported in 2012 that only about 20%–30% of patients use angled Teflon CSII catheters, while also prompting the question whether more studies on the angle of insertion should be conducted. A case study by Kuroda et al26 reported that patients using angled IIS experience less unexpected hyperglycemia and premature catheter failure. An angled CSII catheter is less likely to hit the muscle layer, which has two advantages: first, the inflammatory response may be less severe, and second the incidence of cannula kinking and/or obstruction is decreased.7–9 Our results do not support the latter as we found that more angled cannulas kinked (52% vs 43%). This may be attributed to our method of measuring kinks through micro-CT analysis, rather than inspecting the cannula once it is already removed. In summary, our results showed that angled CSII catheters were associated with a lower inflammatory tissue response and lower tubing pressures. Both bolus surface area and volume were significantly larger when infused through angled IIS, suggesting an increased contact of insulin with capillaries and lymph vessels.
While our findings were significant, there are limitations to our methods and analysis. First, the histology images used for analysis were produced from a thin film of tissue (2–5 µm), thus only providing a snapshot of the inflammatory response to the cannula of a CSII catheter. Second, locating an angled insertion channel in a fatty tissue specimen is methodologically more challenging than for straight catheters. To account for this limitation, we only included images showing at least 35% of the insertion channel and created four standardized points to measure the thickness of layer of the inflammatory tissue, measured independently by two investigators. We expected the total area of inflammation to remain similar regardless of the channel view and found this to be true for a data subset (results not shown). Third, micro-CT imaging was performed on frozen tissue samples to preserve the shape of the bolus, but freezing the specimen affects the structure of the subcutaneous tissue and may cause artifacts. Others, however, have successfully employed similar methods to analyze insulin bolus shape and distribution in the subcutaneous tissue.27 28 In order to better understand how insulin distribution, inflammation and pressure influence insulin absorption, future studies should include insulin pharmacokinetic clamp experiments. The set-up presented here required large amounts of skin and subcutaneous tissue, ruling out a human study. Although the outcome may not be the same as in a patient with diabetes, swine skin and subcutaneous tissue are similar to human tissue in their structure and wound healing pattern.14 15
The CSII catheter is considered the weak link of insulin pump therapy, often failing to ensure reliable dose-to-dose or day-to-day insulin delivery/absorption, leading to clinical complications such as hypoglycemia and hyperglycemia or DKA.25 Our results show that even when the pump fails to deliver a full bolus into the subcutaneous tissue, it will sometimes fail to alarm, and the same holds true for unusually high tubing backpressures. Unreliable insulin delivery may cause clinical problems in the daily therapy of an insulin-dependent patient. We furthermore show that after approximately 6 days of wear time, the inflammatory tissue response to a Teflon cannula stabilizes. This suggests that the wear time of a CSII catheter may be prolonged by overcoming the initial acute inflammatory response and thus the associated variability in insulin absorption. To our knowledge, this is the first systematic study assessing tissue response, bolus distribution and tubing pressure of commercially available angled and straight Teflon CSII catheters and the first to correlate these findings over CSII catheter wear time. Based on our findings, we believe that in future studies, CSII catheters should not only be grouped by material but also separated by angle of insertion, in order to adequately drive future IIS recommendations. The methods and results presented here may assist in the design of future studies to develop an ideal IIS with reliable dose-to-dose and day-to-day delivery and absorption of insulin over an extended duration of wear time.
Acknowledgments
We thank the technicians and veterinarians from the Thomas Jefferson University Office of Animal Resources (Evelyn Skoumbourdis, Joseph Altemus, Judy Daviau, and Cynthia Lang) for their support. We thank Dr Peter A McCue for his guidance with histopathology methods and measurements, as well as the student volunteers assisting with animal work (Dylan Bard, Cecilia Freeman, Jacqui Hamati, Nilanjan Haldar, and Lindsey Szymanski). Publication made possible in part by support from the Thomas Jefferson University and Philadelphia University Open Access Fund.
References
Footnotes
GE and JRK contributed equally.
Contributors GE and JRK contributed to data analysis and interpretation, drafting of the manuscript, and critical revision of the manuscript for important intellectual content. GE, MCT, AK, DD, ARD, CL and JIJ contributed to in vivo studies and data acquisition. PS and JIJ contributed to the study concept and design, data interpretation, drafting the manuscript, critical revision of the manuscript for important intellectual content, and were responsible for study supervision. MCT was responsible for the statistical analysis and interpretation of the data, drafting of the manuscript, and critical revision of the manuscript for important intellectual content. MLT is responsible for developing part of the protocol and for data analysis and interpretation. JIJ is the guarantor of this work and as such had full access to all the data in the study and takes responsibility for the integrity of the data and the accuracy of the data analysis.
Funding This study was sponsored by Capillary Biomedical and funded by the Juvenile Diabetes Research Foundation (JDRF; award 2-IND-2016–232 M-X).
Competing interests JIJ is a founder, equity owner and advisory board chairman of Capillary Biomedical. PS is a founder, equity owner and President/CEO of Capillary Biomedical.
Patient consent for publication Not required.
Ethics approval The study and animal procedures were approved by the Thomas Jefferson University (TJU) Institutional Animal Care and Use Committee.
Provenance and peer review Not commissioned; externally peer reviewed.
Data availability statement Data are available upon reasonable request. The number of samples included in each analysis can be found in Tables S2-S4 (Supplementary Material I). Histology and micro-CT images as well as pressure curves for each individual CSII catheter/specimen can be found in Supplementary Material II.