Article Text

Abstract
Objective Impaired fasting glucose (IFG) and impaired glucose tolerance (IGT) may convey disparate risks of metabolic consequences. Fasting plasma glucose (FPG), while an expedient screening procedure, may not adequately assess metabolic risk, particularly among youths. In order to inform a strategy for screening Chinese youth for pre-diabetes, we examined the relative value of IFG versus IGT to define metabolic risk by assessing their association with insulin resistance, beta-cell dysfunction, adverse adipokine profiles and other cardiometabolic risk factors.
Research design and methods We recruited 542 subjects (age 14–28 years) from the Beijing Child and Adolescent Metabolic Syndrome study for an in-depth assessment of cardiometabolic risk factors, including a 2-hour oral glucose tolerance test, liver ultrasound and serum levels of four adipokines.
Results FPG failed to identify nearly all (32/33) youths with IGT, whereas 2-hour plasma glucose (2 h PG) missed 80.8% (21/26) of subjects with IFG. Impaired beta-cell function was evident from decreased oral disposition indices in those with isolated impaired fasting glucose (iIFG) or isolated impaired glucose tolerance (iIGT) versus normal glucose tolerance (NGT) (all p<0.001), whereas reduced insulin sensitivity (Matsuda) index was most pronounced in the iIGT group (p<0.01). Moreover, alterations in adipokine levels (fibroblast growth factor 21, adiponectin and leptin/adiponectin ratio) were associated with iIGT (p<0.05) but not iIFG. Youths with iIGT had a 2-fold to 32-fold increased incidence of hypertriglyceridemia, hypertension and metabolic syndrome (MetS) compared with those with NGT. In addition, subgroup analyses of participants with normal FPG revealed that the odds of having IGT increased 3-fold to 18-fold among those with elevated TGs, hypertension, moderate-to-severe non-alcoholic fatty liver disease or MetS.
Conclusions Chinese youth with iIGT exhibit a higher cardiometabolic risk profile than those with iIFG. Thus, 2 h PG is preferred over FPG to identify the pre-diabetes phenotype at greatest risk of subsequent development of cardiovascular disease.
Trial registration number NCT03421444.
- impaired fasting glucose
- impaired glucose tolerance
- adipokines
- metabolic syndrome
This is an open access article distributed in accordance with the Creative Commons Attribution Non Commercial (CC BY-NC 4.0) license, which permits others to distribute, remix, adapt, build upon this work non-commercially, and license their derivative works on different terms, provided the original work is properly cited, appropriate credit is given, any changes made indicated, and the use is non-commercial. See: http://creativecommons.org/licenses/by-nc/4.0/.
Statistics from Altmetric.com
Significance of this study
What is already known about this subject?
Impaired fasting glucose and impaired glucose tolerance (IGT) may reflect different metabolic subphenotypes of pre-diabetes, which may carry disparate risks of metabolic consequences.
Fasting plasma glucose (FPG) is recommended for screening for pre-diabetes due to cost and convenience compared with 2-hour oral glucose tolerance test and hemoglobin A1c.
What are the new findings?
The IGT phenotype is associated with a more adverse cardiometabolic risk profile and may be a stronger predictor of cardiovascular disease than the impaired fasting glucose phenotype in youth.
Alterations in adipokine concentrations are already detectable in IGT states and may reflect adipose tissue dysfunction as an early pathogenic event in the development of type 2 diabetes.
FPG is inadequate for the identification of IGT and its accompanied elevated cardiovascular risk in youth.
How might these results change the focus of research or clinical practice?
Our findings suggest that a 2-hour plasma glucose rather than FPG test is necessary to identify the pre-diabetes phenotype among youths at risk of metabolic syndrome.
Introduction
The increasing prevalence of type 2 diabetes (T2D) among young individuals, both globally and in China, presents a major public health challenge. In 2017, the International Diabetes Federation (IDF) estimated that 425 million people between the ages of 20 and 79 years worldwide were affected by T2D, with the number projected to increase to 629 million by 2045.1 According to a recent national survey in China, nearly 1 in 10 adults had T2D and the prevalence of pre-diabetes was as high as 50%.2 As T2D is a progressive disease with insidious onset, often silent until presenting with organ damage after many years of hyperglycemia, screening programs for early manifestations of the disease, like pre-diabetes, are needed.3
Pre-diabetes is defined as an intermediate metabolic state between normal glucose tolerance (NGT) and overt T2D, which encompasses individuals with impaired fasting glucose (IFG) as well as impaired glucose tolerance (IGT).4 Studies in adults have suggested the existence of metabolic subphenotypes among pre-diabetic individuals, with IFG being characterized by a combination of hepatic insulin resistance (IR) and defective early-phase insulin secretion, while IGT primarily consists of peripheral IR combined with impaired first-phase and second-phase insulin secretion.5–9 Not only is pre-diabetes an intermediate state of dysglycemia, but also it exists on a continuum of cardiometabolic risk between metabolic syndrome (MetS) and T2D.10 11 However, the overlapping pathogeneses of dysglycemia and cardiometabolic dysfunction are not fully understood. While this overlap can be partially attributed to an intricate relationship between metabolism and inflammation,12 13 a number of adipokines, such as leptin, adiponectin, fibroblast growth factor 21 (FGF21), and retinol binding protein 4 (RBP4) play an important role not only in the atherosclerotic process but also in the development of diabetes.14 15 Nonetheless, the preponderance of evidence addressing the pathophysiological mechanisms responsible for a relationship between cardiometabolic risk and pre-diabetes are derived from adult-based studies, with little understanding of the clinical manifestations in youth, especially from China. While fasting plasma glucose (FPG), 2-hour oral glucose tolerance test (OGTT) and hemoglobin A1c (HbA1c) are all endorsed by the American Diabetes Association (ADA) to test for pre-diabetes and diabetes, FPG is preferred as a screening test due to cost and convenience, especially in youth,16 17 despite the fact that its efficiency is still under debate.
Given that little is known about the evolution of these conditions in young populations and the likely existence of metabolic subphenotypes within pre-diabetes, with differing abilities to be detected and to portend cardiovascular disease, the aims of the present study were to (1) examine the efficacy of IFG as a screening strategy for identifying IGT in adolescents and young adults, (2) investigate the characteristics of insulin sensitivity and pancreatic beta-cell function in youth with isolated IFG versus IGT, (3) compare adipokine and cardiometabolic risk profiles between those with isolated IFG and IGT, and (4) compile these data to inform a strategy for screening at-risk youth for pre-diabetes based on data from the Beijing Child and Adolescent Metabolic Syndrome (BCAMS) study.18–20
Methods
Participants
The BCAMS is a longitudinal cohort study of cardiovascular risk factors beginning in childhood. The study protocol has been reported in detail elsewhere18–21 and is registered online (www.clinicaltrails.gov). Briefly, in 2004, a population-based survey was conducted in the Beijing area with a representative sample of children and adolescents (n=19 593, 50% boys). Approximately 4500 were identified as being at elevated risk of MetS due to the presence of at least one of the following risk factors: overweight defined by a body mass index (BMI) at ≥85th percentile; blood pressures (BPs) at >90th percentile, total cholesterol of ≥5.2 mmol/L, triglyceride (TG) of ≥1.7 mmol/L or FPG of ≥5.6 mmol/L based on capillary blood sampling. Beginning in 2012, these at-risk individuals were recruited consecutively through various modalities (phone, text and email) for a medical examination.19 Among this follow-up cohort of 559 individuals (14–28 years, mean=20.2 years), 17 did not consent to take OGTT, leaving 542 available for the current analysis.
Clinical measurements
Anthropometric measurements, including height, weight, waist circumference (WC), and fat mass percentage (FAT%), were measured following standardized procedures19 20 after removing bulky clothing and shoes. Height was measured to the nearest millimeter using a portable stadiometer. WC was measured midway between the lowest rib and the top of the iliac crest. Weight and FAT% were measured to the nearest 0.1 kg using a TANITA Body Composition Analyzer (ModelTBF-300A). Measurements of systolic blood pressure (SBP) and diastolic blood pressure (DBP) were recorded in the sitting position from the right arm with a mercury sphygmomanometer and rounded to the nearest 2 mm Hg. Three readings were taken 10 min apart, and the mean of the lowest two readings was taken as the BP. BMI was calculated as weight divided by height squared. Non-alcoholic fatty liver disease (NAFLD) was diagnosed by ultrasonography according to the 2010 Prevention and Treatment Guidelines for NAFLD published by the Chinese Liver Disease Association22 and was graded as mild, moderate or severe according to the ultrasonographic images by referring to established criteria23 24: mild, characterized by mildly increased liver echogenicity and clear depiction of hepatic and portal vein walls; moderate, with increased liver echogenicity obscuring the hepatic and portal vein walls; and severe, with increased liver echogenicity and significant posterior shadowing that impairs evaluation of the deep liver parenchyma and diaphragm.
Laboratory measurements
After a 12-hour overnight fast, participants performed a standard OGTT (with 1.75 g/kg, maximum 75 g glucose). Blood samples were obtained for the measurement of glucose and insulin at 0, 0.5, and 2 hours after oral glucose administration. The samples were centrifuged, aliquoted and immediately frozen for future analysis of hormones. HbA1c was analyzed using the TOSOH G7 automated analysis system with high-performance liquid chromatography. Serum lipids and glucose were assayed using the Hitachi 7060 C automated biochemistry analyzer. Low-density lipoprotein cholesterol (LDL-C) and high-density lipoprotein cholesterol (HDL-C) levels were measured directly. High-sensitivity C reactive protein was measured by immunoturbidimetric assay. Serum aspartate transaminase and alanine amino transferase were assayed using an automated biochemistry analysis system. Insulin, leptin and adiponectin concentrations were measured by monoclonal antibody-based sandwich ELISA developed in the Key Laboratory of Endocrinology, Peking Union Medical College Hospital.25–27 The intra-assay coefficients of variation (CVs) for insulin, leptin and adiponectin were <4.1%, <7.4% and <5.4%, respectively. The interassay CVs were <7.0%, <9.3% and <8.5%, respectively. FGF21 and RBP4 were measured using a commercial ELISA Kit (R&D Systems, Minnesota, USA) with interassay CVs of <7.4% and <10%, respectively.28 29 All samples were analyzed in duplicate.
Calculations and definitions
Using blood glucose and serum insulin levels from the OGTT, we calculated the homeostasis model assessment of insulin resistance (HOMA-IR, mainly reflecting hepatic IR) as HOMA-IR=fasting insulin (FIns, mU/L)×FPG (mmol/L)/22.5,30 and whole-body insulin sensitivity (Matsuda) index (ISIMatsuda, reflecting both hepatic and peripheral insulin sensitivity) during the OGTT calculated as ISIMatsuda=10 000/(FPG×FIns)×(G×I),31 where G=mean serum glucose and I=mean serum insulin concentration. These indices have been demonstrated to strongly correlate with the euglycemic–hyperinsulinemic clamp and minimal-model frequently sampled intravenous glucose tolerance test-derived measures of insulin sensitivity in obese children and adolescents.32–34 Pancreatic beta-cell function was estimated using the following indices: Homeostasis model assessment of β-cell function (HOMA-β) =20×FIns/(FPG−3.5),30 insulinogenic index (IGI=△Ins30/△Gluc30),35 and oral disposition index (DIo=IGI×ISI),36 which reflects the capacity of pancreatic islets to compensate for reduced insulin sensitivity.
Glucose tolerance status was defined according to ADA criteria,37 with subjects classified as having pre-diabetes, including the following: IFG: FPG≥5.6–7.0 mmol/L and IGT: 2-hour plasma glucose (2 h PG)≥7.8–11.1 mmol/L. T2D was diagnosed in patients with FPG≥7.0 mmol/L, OGTT 2 h PG ≥11.1 mmol/L or HbA1c≥6.5%. MetS was defined according to the harmonized criteria when at least three of the following five criteria were met38: (1) central obesity: WC≥90th in 10–16 years, WC≥90 cm for boys and WC≥80 cm for girls in over 16 year olds; (2) FPG≥5.6 mmol/L and/or 2 h PG ≥7.8 mmol/L or a diagnosis of diabetes; (3) SBP≥130 mm Hg or DBP≥85 mm Hg or presence of drug treatment for hypertension; (4) HDL-C<1.03 mmol/L in men or <1.29 mmol/L in women; and (5) TG≥1.70 mmol/L.
Statistical analysis
All statistical analyses were carried out using the Statistical Package for Social Sciences V.21.0 for Windows. Data are presented as mean±SD or geometric mean (with 95% CI) for continuous parameters and percentage for categorical variables. All skewed distributions underwent natural logarithmic transformation prior to analysis. Comparisons between groups were accomplished using t-tests or analysis of variance with post hoc comparison tests for continuous variables, while categorical variables were explored using the χ2 test. Logistic regression analysis was used to calculate the OR and CI of variables while adjusting for possible confounders. The k statistic was calculated as a measure of agreement between FPG and 2-hour OGTT diagnoses for individuals with hyperglycemia. A p value of <0.05 (two-sided) was considered to be statistically significant.
Results
Agreement of classification between FPG and 2 h PG during OGTT
We evaluated the agreement of classification between FPG and 2 h PG during OGTT (online supplementary table 1). Of the total 542 participants, 54 (10%) had pre-diabetes, including 21 (3.9%) with isolated impaired fasting glucose (iIFG), 32 (5.9%) with isolated impaired glucose tolerance (iIGT) and one (0.2%) with combined IFG/IGT, while 10 (1.9%) met the criteria for T2D. There was poor agreement between the classification of pre-diabetes and diabetes defined by FPG and 2 h PG during OGTT (kappa value of 0.12). FPG failed to identify the majority 6/10 (60%) of those with T2D and nearly all 32/33 (97%) with IGT, whereas 2 h PG would miss 21/26 (80.8%) of individuals with IFG.
Supplemental material
Characteristics of the participants stratified by NGT, iIFG and iIGT
We next focused on participants with iIFG and iIGT. The clinical and biochemical features of the study participants grouped as NGT, iIFG and iIGT are shown in table 1. The three groups were similar in gender and age distribution. Compared with the NGT group, the iIFG group had higher BMI (p<0.05), WC (p<0.05), FAT% (p<0.05), TG (p<0.001), LDL-C (p<0.05), DBP (p<0.05) and HbA1c (p<0.001), while iIGT had higher FAT% (p<0.05), SBP (p<0.05) and DBP (p<0.05) than NGT and lower TG (p<0.05) than the iIFG group. FIns was highest in the iIFG group, and 2-hour insulin levels reached their peak in the iIGT group. The prevalence rates of MetS were 7.5%, 14.3%, and 46.9% among the NGT, iIFG and iIGT groups, respectively. Compared with the NGT group, the iIFG group had a higher proportion of participants with hypertension (p<0.05), and the iIGT group had higher proportions with hypertension (p<0.01) and hypertriglyceridemia (p<0.05). Consequently, the iIGT group had more components of MetS than the iIFG group (p<0.001). Compared with the NGT group, the iIFG group had a higher prevalence of NALFD, while the iIGT group had the highest proportion with moderate-to-severe NALFD (all p<0.01).
Characteristics of the study participants according to glucose homeostasis status
Comparisons of IR and beta-cell function in participants with isolated IFG and IGT
As shown in table 1, the homeostasis model indices (HOMA-IR and HOMA-β) were most aberrant in the iIFG group (all p<0.05), while the iIGT group had significantly reduced ISI (p<0.01) after adjustment for age, gender and BMI. The early-phase insulin secretion parameter, IGI, was significantly lower in the iIGT group compared with NGT (p<0.05), and after accounting for IR, beta-cell function (as reflected by DIo) gradually diminished across the three groups (p<0.001).
Comparisons of adipokines in participants with iIFG and iIGT
Among the four adipokines, including leptin, adiponectin, FGF21 and RBP4, as well as leptin:adiponectin ratio (table 1), only the iIGT group showed significant differences in the levels of FGF21, leptin and leptin/adiponectin compared with the NGT group. After adjusting for age and gender (figure 1), adiponectin levels were significant lower in the iIGT versus NGT and iIFG groups (all p<0.05), whereas the difference in leptin levels between the iIGT and NGT groups was ablated (p>0.05). When further controlling for BMI, adiponectin levels remained significantly lower in the iIGT than the NGT (p<0.05) and iIFG (p=0.01) groups, while the differences in FGF21 levels between the NGT and iIGT groups were attenuated (p=0.064).
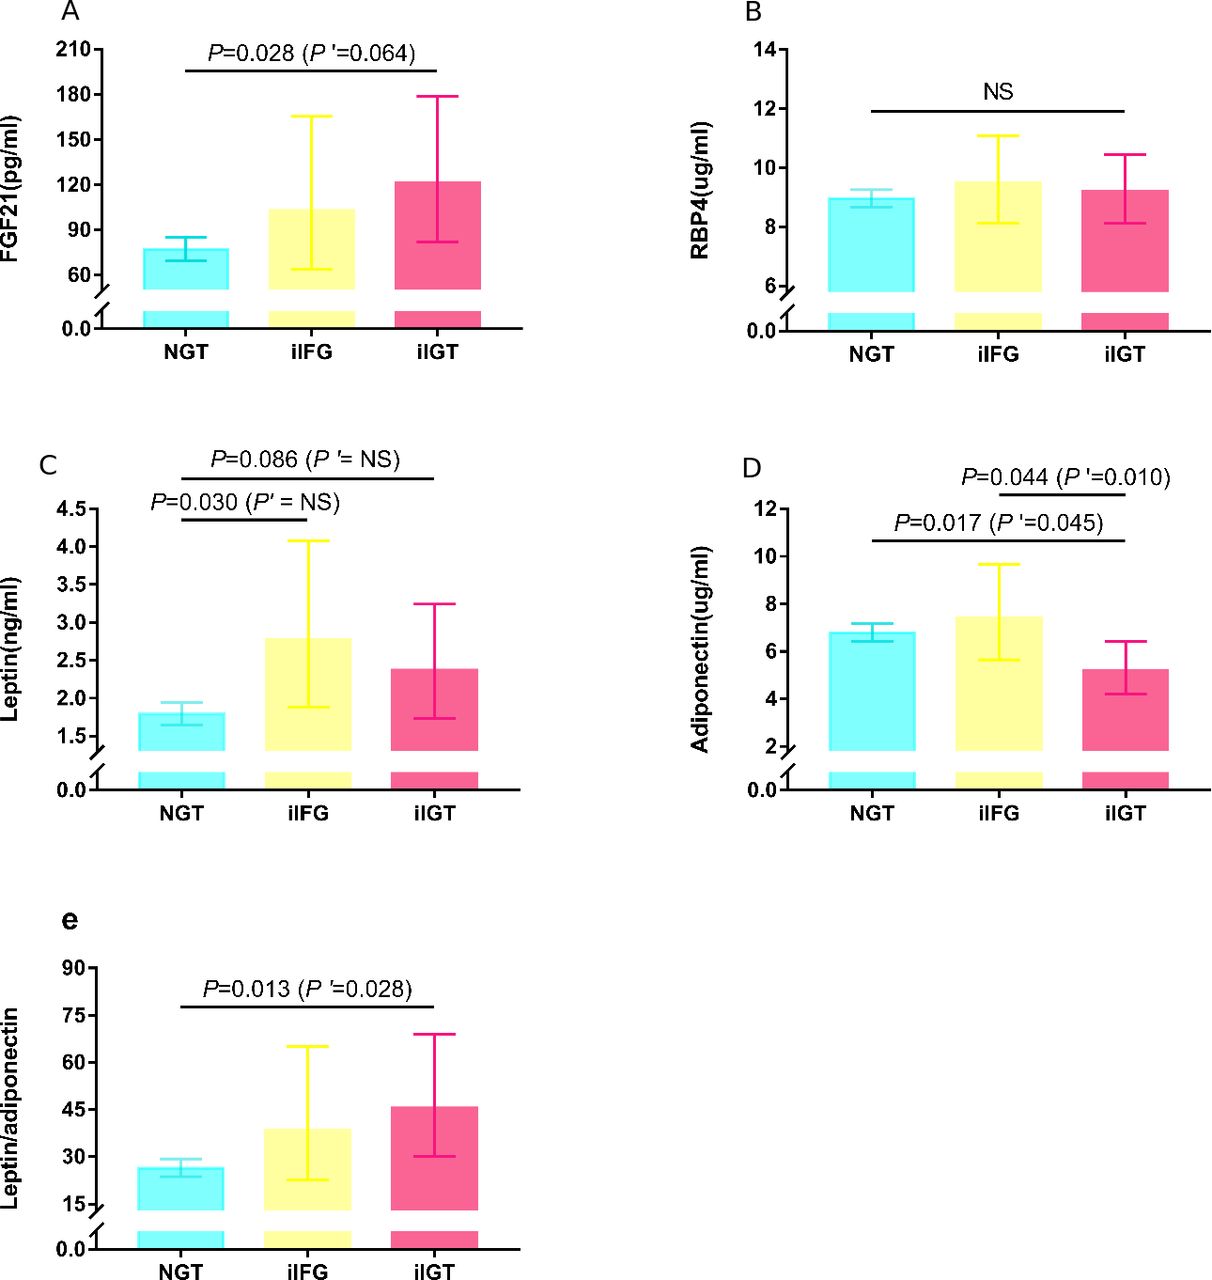
Figure 1Comparison of adipokine levels among the three groups. Data were presented as geometric mean (95% CI) and calculated from the general linear regression model with post hoc comparisons after controlling for age and gender. P’ values were further adjusted for BMI. Only p values of <0.10 were represented. (A) The iIGT group had higher FGF21 levels than the NGT group, and the difference was attenuated with further adjustment for BMI. (B) RBP4 levels were not significantly different (NS) among the three groups. (C) The difference in leptin levels among the three groups was ablated after controlling for BMI. (D) The iIFG group was associated with decreased adiponectin levels compared with NGT and iIFG. (E) The iIGT group was associated with increased leptin/adiponectin compared with the NGT group. FGF21, fibroblast growth factor 21; iIFG, isolated impaired fasting glucose; iIGT, isolated impaired glucose tolerance; NGT, normal glucose tolerance; NS, not significant; RBP4, retinol binding protein 4.
Comparisons of cardiometabolic risk factors in participants with iIFG versus iIGT
Compared with the NGT group, the iIFG group had higher risk of exhibiting hypertension (BP≥130/85 mm Hg), IR (defined as HOMA-IR>3.0) and mild NAFLD, while the iIGT group displayed a higher risk of hypertension, hypertriglyceridemia (≥1.7 mmol/L), IR, MetS and moderate-to-severe NAFLD after controlling for age and gender (all p<0.05, data not shown). However, after further adjusting for BMI (table 2), only the elevated risk of IR (OR=3.50, 95% CI 1.19 to 10.30, p=0.023) remained for the iIFG group, while the increased risks of hypertension, IR, MetS and the moderate-to-severe NAFLD remained significant in the iIGT group, with odds ratios of 4.0 (95% CI 1.46 to 10.93, p=0.007), 3.7 (95% CI 1.37 to 9.73, p=0.01), 32.6 (95% CI 9.67 to 110.02, p<0.001), and 6.29 (95% CI 1.04 to 37.86, p=0.045), respectively.
ORs of cardiometabolic risk factors comparing participants with iIFG or iIGT versus NGT
Characterizing the cardiometabolic risk factors in participants with normal FPG but with missed IGT by FPG test to inform a strategy for screening at-risk youth for pre-diabetes
Given our evidence that FPG is inadequate for the detection of IGT, we endeavored to assess the cardiometabolic risk profile in the subgroup of participants who had normal FPG but were still likely to have IGT. Table 3 demonstrates that in the 510 participants with normal FPG, the odds of an abnormal 2 h PG increased 2.9-fold in participants with hypertriglyceridemia, 4.7-fold with hypertension, 4.7-fold with moderate-to-severe NAFLD and 18.3-fold in the presence of MetS. However, IGT was not significantly more prevalent among subjects with obesity. Therefore, our findings suggest that among youth with normal FPG, the presence of hypertension, hypertriglyceridemia, moderate-to-severe NAFLD or MetS increases the likelihood of IGT, such that a 2-hour OGTT is warranted.
ORs of IGT according to metabolic risk factors in those with normal fasting plasma glucose (N=510)
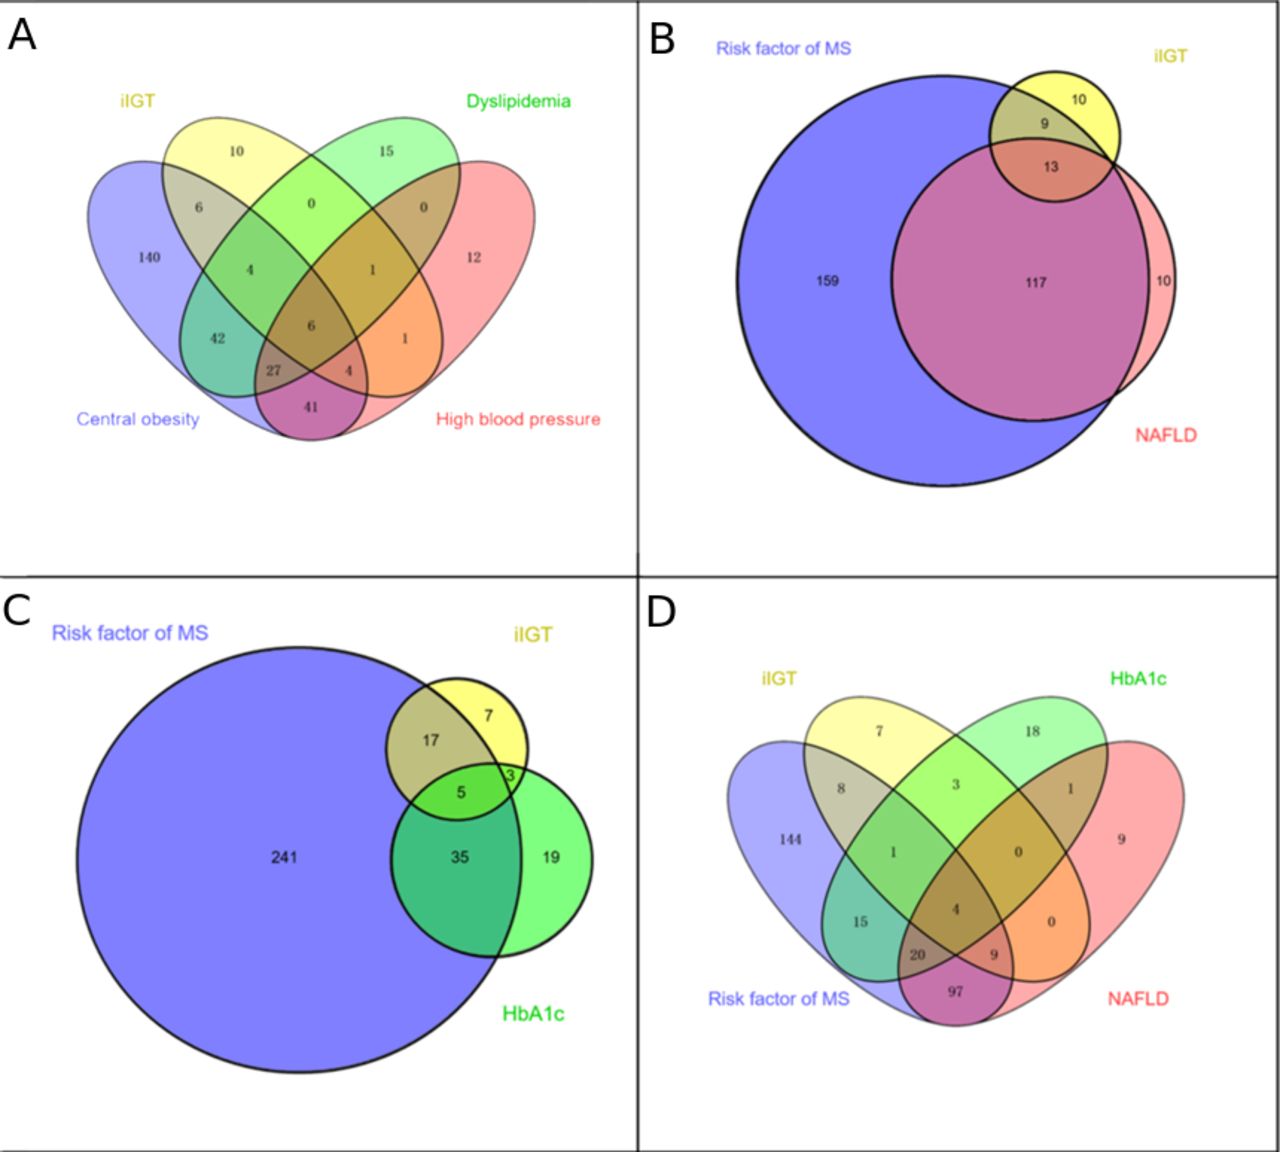
However, it should be noted that even with this approach, 31% (10/32) of participants with IGT would be missed (figure 2A,B). Moreover, the addition of HbA1c (≥5.7%) and the components of MetS (figure 2C) or NAFLD to the screening paradigm (figure 2D) only garners an additional three subjects with IGT, leaving 22% (7/32) of participants to be missed.

Comparisons of combination efficiency to identify the missed IGT in those with normal FPG. Proportions and their overlap between screening with risk of MetS (including any classical risk factor, i.e, central obesity, dyslipidaemia and high blood pressure), NAFLD, HbA1c of ≥5.7% and iIGT (FPG of <5.6 mmol/L and 2-hour PG of ≥7.8–11.1 mmol/L). Screening subjects with any components of MetS (A) and NAFLD (B) would miss 31% (10/32) of participants with IGT; further adding HbA1c (≥5.7%), in addition to the risk factor of MetS (C) and NAFLD screening (D), 22% (7/32) of participants with IGT remained to be missed. FPG, fasting plasma glucose; HbA1c, haemoglobin A1c; IGT, impaired glucose tolerance; iIGT, isolated impaired glucose tolerance; MetS, metabolic syndrome; NAFLD, non-alcoholic fatty liver disease.
Discussion
In this cross-sectional study of adolescents and young adults (mean age of 20 years) at risk of MetS, we demonstrate surprisingly poor agreement between FPG and OGTT in the classification of pre-diabetes and diabetes when compared with previous reports in older adults. FPG failed to detect nearly all cases of IGT, despite the fact that IGT was indicative of greater IR and beta-cell dysfunction, as well as a more adverse cardiometabolic risk factor profile, than was IFG. Although FPG is the most common screening procedure for dysglycemia in clinical practice, for Chinese youths with existing indicators of MetS and normal FPG, a 2-hour OGTT is necessary to identify the pre-diabetes phenotype. To the best of our knowledge, this is the first study to compare the relative value of FPG versus 2-hour OGTT to identify subphenotypes of pre-diabetes in Chinese youth and to explore the pathophysiological mechanisms responsible for their elevated cardiometabolic risk.
Although experts do not agree on how to identify individuals at high risk of diabetes, since the ADA advocated for the addition of HbA1c to FPG and 2 h PG for the screening and diagnosis of pre-diabetes in 2010,37 there has been increased interest in establishing thresholds for HbA1c, FPG and 2-hour OGTT in different ethnic population.3 39 A study of 6884 adults from Thailand showed that FPG failed to identify 46.3% of all pre-diabetes and 54.7% of diabetes cases, whereas the corresponding percentages for missed diagnosed using OGTT were just 18.9% and 7.0%, respectively.40 In 2012, Sesti et al41 demonstrated discordance between HbA1c, FPG, and 2-hour OGTT for the identification of pre-diabetes and that cardiometabolic risk profiles vary depending on the defining metabolic parameter, with 2-hour OGTT showing the stronger association with cardiometabolic risk factors and subclinical atherosclerosis than FPG or HbA1c. Considering the discrepancies in screening recommendations for dysglycemia,3 16 39 we examined the relative merit of FPG versus 2-hour OGTT when screening for pre-diabetes and T2D in a young Chinese population. We found a greater proportion of hyperglycemia was missed by FPG compared with 2-hour OGTT, and the presence of hypertension, hypertriglyceridemia, NAFLD or MetS increases the risk of IGT in participants, even when FPG is normal. So, consistent with a study of 563 obese Italian children and adolescents where IFG was not a good predictor of IGT in youth,42 in the presence of indicators of MetS, FPG is inadequate as a screen for the pre-diabetes phenotype.
IR and beta-cell dysfunction are fundamental pathophysiological mechanisms for diabetes, which also play crucial roles in determining pre-diabetes.6 A growing number of studies examining the pathogenesis of pre-diabetes, primarily in older adults,5–9 suggest that IFG is characterized by a combination of hepatic IR and defective early-phase insulin secretion, whereas IGT is defined by IR in skeletal muscle rather than liver, combined with defective early and late-phase insulin secretion. In contrast, few studies have examined the mechanisms responsible for pre-diabetes in youth, despite the likelihood that the pathophysiology may be more readily elucidated in the absence of confounding comorbid factors. In the present study, we found that those with IFG had an elevated HOMA-IR, while the IGT group had reduced ISI compared with their NGT counterparts. Considering that HOMA-IR index mainly reflects hepatic IR and ISI reflects both hepatic and peripheral (ie, muscle) insulin sensitivity, our findings in youth are consistent with previous reports in adults.5–9 In addition, impaired beta-cell function was evident from a decreased DIo in those with IFG and IGT versus NGT, suggesting an early and significant decline in beta-cell function, which was observed in a previous study in obese adolescents.43
Individuals with pre-diabetes are at high risk, not only for the development of diabetes mellitus44 but also for adverse cardiovascular outcomes.10 45 Moreover, pre-diabetes subphenotypes (ie, IFG vs IGT) may be associated with disparate risks of microvascular and macrovascular complications. For example, the Baltimore Longitudinal Study on Ageing demonstrated that IGT, but not IFG, was associated with increased levels of coronary heart disease risk factors.46 Similar findings were recently reported in a large European cohort with coronary artery disease47 and a recent meta-analysis of 53 prospective cohort studies.45 While these associations have not been well studied in youth, our data suggest that IGT portends a higher likelihood of hypertension, hypertriglyceridemia, NAFLD and MetS in young Chinese individuals than does IFG. Consistent with our result, a recent study in 3088 Italian children and adolescents with overweight/obesity demonstrated that IGT was associated with higher cardiometabolic risk than IFG.48 Thus, it appears that pathophysiological mechanisms leading to cardiovascular disease among pre-diabetics are not strongly influenced by age or ethnicity.
The increased risk of cardiometabolic disease in pre-diabetes is multifactorial.49 Certainly, the higher degree of IR exhibited by IGT individuals may contribute to the development of atherosclerosis. In addition, chronic subclinical inflammation, evidenced by adipokine imbalance, could be a unifying mechanistic factor because it predicts the development of both diabetes and cardiovascular disease.12 14 We examined this hypothesis by exploring the association between the pre-diabetes subphenotypes and four well-known IR-related adipokines (leptin, adiponectin, FGF21, and RBP4).14 Even after controlling for BMI, higher levels of FGF21 and leptin/adiponectin ratio, as well as lower adiponectin were present in the IGT (but not the IFG) group compared with their NGT counterparts, suggesting a specific role of adipose tissue dysfunction in the pathogenesis of IGT. Our findings are congruent with a number of studies50–52 reporting various adipokine abnormalities associated with IGT compared with NGT. Although minor discrepancies exist between which adipokines are affected (and to what degree), this can be explained by differences in age, sample size and ethnicity of participants. Our findings suggest that alterations in blood levels of certain adipokines are already detectable in youth with pre-diabetes, particularly those with IGT status, and may reflect adipose tissue dysfunction as an early pathogenic event in T2D development. Thus, circulating adipokines may be a more sensitive biomarker of adipose tissue dysfunction than anthropometric measures like BMI or WC. However, clearly more studies in younger populations are needed, since data in this age group are limited.
Given our evidence that IGT is representative of more serious IR, beta-cell dysfunction, and greater cardiometabolic risk than is IFG, and isolated use of FPG is limited by its discordance with IGT, we sought a method to efficiently identify the obscured IGT in those initially classified as NGT on the basis of FPG alone. In line with the new guidelines of ADA-2019,17 we found that IGT occurs more frequently in youth with conditions associated with IR (including hypertension and dyslipidemia) and in those with NAFLD based on liver ultrasound. When 2-hour OGTT was performed in youth meeting criteria for the MetS in their initial screening, more than two-thirds of IGT can be detected. This two-stage screening process is less labor intensive and might translate into more efficient clinical practice by avoiding the OGTT in 59% of participants with NGT. However, it should be noted that even with this strategy, nearly a third of individuals with IGT would be missed. Adding HbA1c testing in individuals with traditional risk factors of the MetS leaves only 22% of undetected IGT to be missed. It is open to debate whether this is acceptable, in light of the possibility of avoiding unnecessary OGTTs in low-risk individuals. Previous studies of western children and adolescents have proposed that using fasting TG levels alone53 or in combination with FPG54 identifies the subsample in whom to perform OGTT. However, these approaches were less than satisfactory in our cohort of youth (see online supplementary file 1). Moreover, compared with TG, BP appears be of greater value when predicting IGT in our cohort (table 3 and figure 1). This dichotomy is likely to be related to differences in age and ethnicity in their respective cohorts, but further study is needed to define optimal screening strategies.
Strengths of this study include its relatively large cohort, standardized collection of detailed data to assess cardiometabolic phenotype, and comprehensive approach to screen for dysglycemia via OGTT. Despite these strengths, some limitations remain. First, the estimation of IR and beta-cell function using OGTT is less precise than ‘gold standard’ measures, like euglycemic clamp or frequently sampled intravenous glucose tolerance test. However, ISI, HOMA-IR, and DIo have been validated in other populations against these standards and found to be valid and appropriate for clinical investigations and epidemiological studies.31 32 55 It should be noted, however, that we only used three time points for glucose and insulin during the OGTT to calculate the ISIMatsuda, which may lead to inaccuracy compared with the original calculation, which is based on the mean of five values.31 Second, as our sample was taken from a pool of Chinese youths at increased risk of cardiovascular disease, similar studies in other ethnical populations are needed to evaluate the generalizability of our findings. Finally, while we found that youth with IGT possessed markers for increased cardiometabolic risk, a causal relationship is not possible to infer due to the cross-sectional nature of the study design. However, our ongoing follow-up observations in this cohort may serve to elucidate a causal mechanism.
Conclusions
In conclusion, in this young Chinese population, we found that FPG fails to identify nearly all individuals with IGT. The fact that IGT was more indicative than IFG of profound IR, β-cell dysfunction and an adverse cardiometabolic profile suggests that FPG is inadequate as a screen for dysglycemia in Chinese youth. Rather, a 2-hour OGTT is necessary to adequately identify pre-diabetes in the subset of subjects with risk factors for MetS, even in the absence of obesity.
Acknowledgments
The authors thank Professor Jie Mi and all the Beijing Child and Adolescent Metabolic Syndrome study members, and all participants for their continuing participation in this research effort.
References
Footnotes
YL and DF are joint first authors.
ML and SG contributed equally.
Contributors YL and DF contributed to the data analysis and drafted the manuscript; ICE and YZ contributed to the data analysis and revised the manuscript; LH, YZ, JF, GL, DW and YW contributed to the data collection; SMW contributed to the concept and design of the study, interpretation of the data and revision of the manuscript; ML contributed to the concept, design of the study, analysis of the data and revision of the manuscript. SG was responsible for the concept, design and data collection in the Beijing Child and Adolescent Metabolic Syndrome follow-up study; contributed to the acquisition and interpretation of the data; and revised the manuscript. All authors read and approved the final manuscript.
Funding The authors have not declared a specific grant for this research from any funding agency in the public, commercial or not-for-profit sectors.
Competing interests None declared.
Patient consent for publication Not required.
Ethics approval The study protocol was approved by the Ethics Committee at the Beijing Chaoyang Hospital, and signed informed consent was obtained from all participants and/or their parents or guardians.
Provenance and peer review Not commissioned; internally peer reviewed.
Data availability statement All data relevant to the study are included in the article or uploaded as supplementary information.