Article Text

Abstract
Objective Time-dependent covariates are generally available as longitudinal data were collected periodically in the cohort study. To examine whether time-dependent triglyceride to high-density lipoprotein cholesterol (TG/HDL-C) ratio could predict the future risk of type 2 diabetes mellitus (T2DM) and assess its potential impact on the risk of T2DM incidence.
Research design and methods This study enrolled 1460 participants without T2DM aged 55 or above in 1992 in the Beijing Longitudinal Study of Aging during 25 years. The questionnaire data were collected in nine surveys from 1992 to 2017. Physical examination and blood laboratory tests including TG and HDL-C concentrations were measured in five surveys. Incident T2DM cases were confirmed via a self-reported history of T2DM or the fasting plasma glucose level.
Results 119 new cases of T2DM were identified. In the Cox regression analysis with time-dependent TG/HDL-C ratios and covariates, the adjusted hazard ratios (95% confidence interval) of T2DM incidence were 1.90 (1.12 to 3.23), 2.75 (1.58 to 4.80) and 2.84 (1.69 to 4.77), respectively, for those with TG/HDL-C ratios (both TG and HDL-C were expressed in millimole per liter) in the ranges of 0.87–1.30, 1.31–1.74 and ≥1.75, compared with individuals with TG/HDL-C ratios <0.87. The similar results of subdistribution hazard ratios were obtained by performing the Fine-Gray model with time-dependent TG/HDL-C ratios. This positive association and the statistically significant trend with increased risk of T2DM incidence in the three categories of elevated TG/HDL-C ratio was confirmed by multiple sensitivity analyses. Furthermore, the T2DM discriminatory power of TG/HDL-C ratio combining with other risk factors was moderately high.
Conclusions We found that time-dependent TG/HDL-C ratios were positively associated with the risk of T2DM risk. The elevated TG/HDL-C ratios increased the future risk of T2DM incidence. Lowering the TG/HDL-C ratio could assist in the prevention of diabetes for older adults.
- type 2 diabetes
- triglycerides
- HDL cholesterol
- association analysis
This is an open access article distributed in accordance with the Creative Commons Attribution Non Commercial (CC BY-NC 4.0) license, which permits others to distribute, remix, adapt, build upon this work non-commercially, and license their derivative works on different terms, provided the original work is properly cited, appropriate credit is given, any changes made indicated, and the use is non-commercial. See: http://creativecommons.org/licenses/by-nc/4.0/.
Statistics from Altmetric.com
Significance of this study
What is already known about this subject?
A few studies have examined the association of triglyceride to high-density lipoprotein cholesterol (TG/HDL-C) ratio at baseline and the future risk of type 2 diabetes mellitus (T2DM).
Levels of TG and HDL-C commonly tend to fluctuate over time. However, few studies have evaluated the association between the TG/HDL-C ratio and the risk of T2DM by accounting for time-dependent TG/HDL-C ratios.
What are the new findings?
Time-dependent TG/HDL-C ratios were positively associated with the future risk of T2DM incidence in the Beijing elderly population. Elevated TG/HDL-C ratios significantly increased the risk of T2DM incidence. This positive association was confirmed by multiple sensitivity analyses.
The association of TG/HDL-C ratios at baseline or the average ratios during the follow-up period with the future T2DM incidence was weaker or stronger, respectively, than the one between time-dependent TG/HDL-C ratios and T2DM incidence.
The T2DM discriminatory powers of prediction models combining TG/HDL-C ratio and other risk factors were moderately high.
How might these results change the focus of research or clinical practice?
Lowering TG/HDL-C ratio could assist to prevent T2DM in the general population, and monitoring lipid profile deserves more attention in clinical practice.
Introduction
Type 2 diabetes mellitus (T2DM) imposes a large economic burden on the global healthcare system.1 The prevalence of T2DM is steadily increasing everywhere, most markedly in the world’s middle-income countries. China is experiencing the world’s largest diabetes epidemic. The prevalence of T2DM in Mainland China has risen from a low 0.67% in 1980 to an astounding 10.9% in 2013.2 The International Diabetes Federation estimated the number of Chinese people aged 20–79 years with diabetes to be at 114.4 million in 2017.3 Identifying modifiable risk factors and reducing the prevalence of these factors is essential for the prevention of T2DM.
Dyslipidemia such as elevated triglycerides (TGs) or decreased high-density lipoprotein cholesterol (HDL-C) is a common feature accompanying T2DM and pre-diabetic states.4–7 There are several prospective studies that have demonstrated elevated blood TG levels to increase the risk of diabetes,8–10 impaired glucose tolerance11 and impaired fasting glucose.12 Some studies have shown that HDL-C is inversely associated with the incidence of T2DM.13–15 Insulin resistance (IR) is a key risk factor for T2DM. The triglyceride to high-density lipoprotein cholesterol (TG/HDL-C) ratio has been reported to be a surrogate marker of IR.16–18 This might be a simple and reliable method to assess IR. However, only few prospective studies have evaluated the association between the TG/HDL-C ratio at baseline and the incidence of T2DM.
To our knowledge, there have been only a 15-year prospective study in an urban community population and a rural cohort study that examined whether the higher TG/HDL-C ratio at baseline is associated with the increase risk of incident T2DM in Chinese people. It is worth noting that the majority of published studies19–22 on this topic were based on a single measure of TG/HDL-C ratio, failing to take into account the potential effect of change in the ratios over time. Many covariate data such as TG, HDL-C and blood pressure are collected regularly in longitudinal studies. They may fluctuate over time and are commonly addressed as time-dependent (or time-varying) covariates in statistics.23 24 Not accounting for time-dependent and cumulative average of the TG/HDL-C ratio over time could bias the true association between the TG/HDL-C ratio and the risk of T2DM. Thus, prospective studies that evaluate the unbiased effect of the time-dependent TG/HDL-C ratio on the risk of T2DM in the presence of time-varying confounders are essential.
We took the opportunity of a well-designed prospective study of Beijing Longitudinal Study of Aging (BLSA) with 25 years of follow-up to investigate the association between time-dependent TG/HDL-C ratios and the risk of T2DM incidence based on the longitudinal data. Furthermore, we also examined whether a single measure of TG/HDL-C ratio at baseline or average TG/HDL-C ratio during the follow-up period was associated with the future risk of T2DM incidence.
Research design and methods
Study population
The BLSA is a community-based prospective cohort study specifically designed to investigate the risk factors for common non-communicable diseases of Chinese people aged 55 and older, which was started in 1992 and was implemented by the Capital Medical University.25 To select a representative sample whose geographic distribution, economic status, age and education were similar to those of the Beijing population older than 55 years, a three-stage stratification-random clustering sampling method was conducted during cohort establishment. A full description of the design and implementation of this cohort study has been described previously.25 26 Briefly, 3257 community residents who were from the Xuanwu District (urban), Daxing County (suburb, rural) and Huairou County (extended suburb, mountain), aged at least 55 years were invited to participate in 1992. A total of 2101 participants completed the questionnaire assessments and physical examination of the first survey from July 1992 to August 1992. These participants were followed up in 1994, 1997, 2000, 2004, 2007, 2009, 2012 and 2017. In five surveys (1992, 2000, 2009, 2012 and 2017), participants underwent physical examinations and laboratory tests. The data used in this study were from this cohort implemented during the period from 1992 to 2017.
This study excluded 244 participants with diabetes (a self-reported history of T2DM or a fasting plasma glucose (FPG) concentration ≥7.0 mmol/L) at baseline. We also excluded 395 individuals, who failed to complete the laboratory tests or had missing data for TG levels or HDL-C levels at baseline. We further excluded two participants who died from type 1 diabetes and had no history of T2DM. Therefore, 1460 participants with complete data were considered in the final analyses. This study was in accordance with the principles of the Declaration of Helsinki. All participants provided their written informed consent before taking part in this survey.
Measurement and data collection
In nine surveys, a standard vis-à-vis questionnaire was used to collect the data on demographics (age, sex, residence and education level), behavior lifestyles (smoking status, alcohol consumption levels and physical activity) and the self-reported history of diseases. Heights and weights were measured, in light clothing, with the use of standardized stadiometers and scales, respectively. Blood pressure was measured on the right arm using a standard mercury sphygmomanometer or an electronic sphygmomanometer with the subjects resting for at least 5 min in a sitting position. The face-to-face interview and physical examination were conducted by trained senior medical students. All laboratory examinations, including total cholesterol (TC), low-density lipoprotein cholesterol (LDL-C), HDL-C, TGs, FPG, were performed at the laboratory of Xuanwu Hospital, Capital Medical University (Beijing, China). All laboratory tests were measured by taking venous blood after at least 8 hours of fasting in the morning. Data were entered into a central database by an experienced researcher.
Assessments of TG/HDL-C ratio
The TG/HDL-C ratio was calculated as TG (millimole per liter) divided by HDL-C (millimole per liter). Based on previously published cut-points of TG/HDL-C ratio,27–29 the TG/HDL-C ratio was classified into four groups by the values of 0.87, 1.31, 1.75 which were in accordance with the values of 2.00, 3.00 and 4.00 when both TG and HDL-C were expressed in milligram per deciliter.
Assessment of confounding covariates
In the present study, considering the degree of economic and educational level in Daxing County and Huairou County to be more or less equal, these two counties were combined into one group (ie, rural or non-urban sites). Body mass index (BMI) was calculated as the weight in kilograms divided by the height in meter square. Educational level was classified into the two groups: primary or lower level and secondary level or higher level. Alcohol use was defined as an average intake of alcohol of at least 50 mL per day. Physical activity level was classified into the three groups of low, moderate and high with exercise time of <3, 3–10 and >10 hours per week, respectively.
Assessments of incident T2DM
Incidence of T2DM was defined as a self-reported physician-diagnosed history of T2DM or a FPG concentration ≥7.0 mmol/L (126 mg/dL).30 31 All participants were followed up for mortality from the baseline examination (July 1992) to the end of follow-up (December 2017). Dates of death were obtained from the death certificates, hospital records, local police registry and the interview with family members. The follow-up time was accrued from the baseline to the date of T2DM, or the baseline to the date of death, loss of follow-up, whichever occurred first.
Statistical analysis
Continuous variables were expressed as means±SD. Frequencies and percentages were used to express the categorical variables. Cox regression with time-dependent covariates was performed to estimate the association between TG/HDL-C ratio and the risk of T2DM incidence. In the Cox regression, the last observation time of the lost follow-up participant or the death time was identified as the right-censored lifetime. To consider the potential impact of death as competing risk events rather than the right-censored, Fine-Gray’s proportional subdistribution hazards model was used to assess the association of TG/HDL-C with the risk of T2DM. Hazard ratio (HR) and subdistribution hazard ratio (SHR) with corresponding 95% confidence interval (CI) were calculated from Cox regression and Fine-Gray model, respectively.
Four-step forward multivariable-adjusted models were built for the statistical analyses. Model 1 was adjusted for age, sex, district, educational level, cigarette consumption, drinking status and physical activity level. Model 2 was adjusted for variables in model 1, as well as for BMI, systolic blood pressure (SBP) and diastolic blood pressure (DBP). Model 3 was adjusted for variables in model 2 plus TC and LDL-C. To examine whether the potential association between TG/HDL-C ratio and the risk of T2DM was due to the single measure of FPG at baseline, we further adjusted for FPG at baseline in model 4.
While for the analysis of time-dependent TG/HDL-C ratio, age, cigarette consumption, drinking status, physical activity, BMI, SBP, DBP, TC and LDL-C were updated during 1992–2012 as time-dependent confounders, and sex, educational level, residence and FPG at baseline were time-invariant variables. Longitudinal data of time-dependent TG levels and HDL-C levels collected during the follow-up time was used in the time-dependent Cox regression and time-dependent Fine-Gray model. Cox regression and Fine-Gray model with time-invariant TG/HDL-C ratio and all confounding covariates measured at baseline or the average levels of continuous variables during the follow-up period were also implemented to explore its association with the risk of T2DM. The linear trend test across TG/HDL-C ratio categories was performed by assigning the median value to each category and modeling this as a continuous variable in separate regression models.
Multiple sensitivity analyses were performed to examine whether the potential association between TG/HDL-C ratio and the risk of T2DM was consistent. The restricted cubic spline was used to assess the dose–response relationship between the average TG/HDL-C ratio and the risk of T2DM. Finally, risk prediction models including TG/HDL-C and other risk factors were built for predicting the future T2DM incidence. The performance of these risk prediction models was evaluated by plotting the time-dependent Receiver Operating Characteristic (ROC) curves and calculating the areas under curves (AUCs).
For all analyses, a two-tailed p-value <0.05 was considered to be statistically significant. All statistical analyses were performed using R version 3.5.1 (R Foundation for Statistical Computing, Vienna, Austria) and SAS V.9.4 (SAS Institute, Cary, North Carolina, USA).
Results
Among 1460 participants (733 men and 727 women) at baseline, the mean age of the study population was 68.82±8.50 years. Among these participants, the mean±SD, median, the 25th and 75th quartiles (IQR) of the follow-up duration were 9.68±6.76 years, 8.00 years, 4.34 years and 13.52 years (9.18 years), respectively. During 14 133.21 person-years of follow-up, 119 new incident cases of T2DM were identified, 709 subjects died and 567 individuals lost to the follow-up. The cumulative newly onset incidence of T2DM was 8.42 per 1000 person-years overall. The flowchart of this study and the incident cases of T2DM in each survey is shown in figure 1. Table 1 summarizes the characteristics of the subjects according to different surveys. During the follow-up, there were an increase in the proportion of physical activity and a reduction in smoking and alcohol intake.

Flowchart of the study population and the incidence of T2DM during the 25-year follow-up time of nine surveys. (A) Flowchart of the participants included in the current study. (B) Flowchart of the participants developed to T2DM from 1992 to 2017. FPG, fasting plasma glucose; HDL-C, high-density lipoprotein cholesterol; T2DM, type2 diabetes mellitus; TG, triglyceride.
Characteristics of the study participants according to the survey time
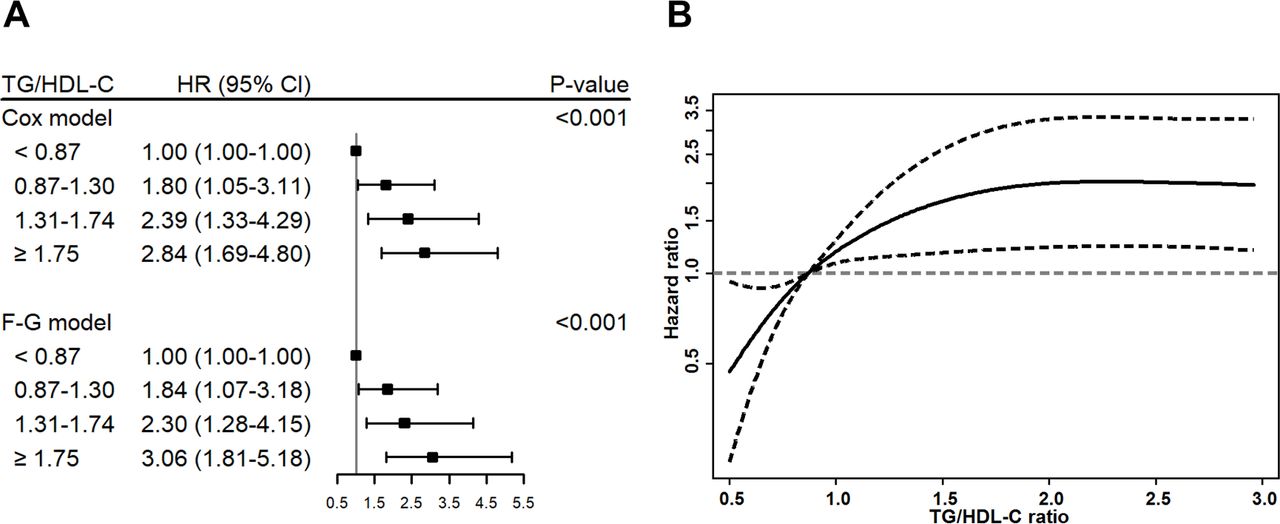
The time-dependent TG/HDL-C ratios were positively and strongly associated with the future T2DM risk (table 2). After step-forward adjustment for confounding covariates, graded positive risk of T2DM incidence for those with step-elevated TG/HDL-C ratios was similar across four multivariable-adjusted models. In the analyses of the final model adjusted simultaneously for all potential confounding factors, the HRs (95% CI) of newly onset T2DM for those with TG/HDL-C ratios when both TG and HDL-C were expressed in mmol/L (mg/dL) in the ranges of 0.87–1.30 (2.00–2.99), 1.31–1.74 (3.00–3.99) and ≥1.75 (4.00) were 1.90 (1.12 to 3.23), 2.75 (1.58 to 4.80) and 2.84 (1.69 to 4.77), respectively, compared with individuals with TG/HDL-C ratios <0.87 (2.00) (table 2). There were statistically significant trends with increased risks of T2DM incidence in the three categories of elevated TG/HDL-C ratios (p-values<0.001 for trend for all comparisons). In the competing risks regression analysis with the time-dependent covariates, the similar results of SHRs were obtained (table 2).
Adjusted HRs and SHRs (95% CI) for incidence of type 2 diabetes mellitus by TG/HDL-C ratio groups in the regression analyses with time-dependent TG/HDL-C ratio and covariates
The association of TG/HDL-C ratios at baseline with the future T2DM incidence was weaker than the one for the association between time-dependent TG-HDL-C ratios and T2DM incidence. The HRs of T2DM incidence for participants with baseline TG/HDL-C ratios in the ranges of 0.87–1.30, 1.31–1.74 and ≥1.75 at baseline were 1.44 (0.84–2.48), 2.40 (1.39–4.17) and 2.53 (1.51–4.24) compared with individuals with TG/HDL-C ratios <0.87, which were significantly less than those for time-dependent TG/HDL-C ratio groups (tables 2 and 3). Furthermore, the group with TG/HDL-C ratios in the range of 0.87–1.30 was not significantly associated with the higher risk of T2DM (p-value=0.183) as compared with the group with TG/HDL-C ratio less than 0.87. The similar results of smaller SHRs of T2DM incidence for baseline TG/HDL-C ratio than time-dependent TG/HDL-C were observed. Whereas, the association of average TG/HDL-C ratios, based on the average level of continuous covariates such as age, BMI, SBP, DBP, TC and LDL-C during the follow-up period, with the T2DM risk was stronger than the one for the association between time-dependent TG-HDL-C ratios and T2DM incidence, in which the HRs of T2DM incidence for participants with average TG/HDL-C ratios in the ranges of 0.87–1.30, 1.31–1.74 and ≥1.75 were 2.11 (1.22–3.65), 3.19 (1.77–5.76) and 3.46 (2.03–5.88) compared with individuals with TG/HDL-C ratios <0.87 in the Cox regression analysis (tables 2 and 3), respectively.
Association of TG/HDL-C ratio with type 2 diabetes mellitus in the regression analyses with time-invariant ratio and covariates
Moreover, the time-dependent TG/HDL-C ratios remained significantly associated with T2DM risk after restricting 1049 participants with the age less than 75 years at baseline (figure 2A). In addition, we applied the Cox regression and Fine-Gray model only using the longitudinal data from 1992 to 2000, and we got the similar significantly positive association between TG/HDL-C ratios and the risk of T2DM (online supplementary table S1). Equally important, we compared the association between TG/HDL-C ratios and T2DM incidence using the data by 2000 (8-year duration), 2004 (12-year duration), 2012 (20-year duration) with the one by 2017 (25-year duration), and consistent results were obtained (online supplementary figure S1). All sensitivity analyses presented the robust conclusion that high TG/HDL-C ratio was an independent risk factor of T2DM.
Supplemental material

Association between TG/HDL-C ratios and the risk of T2DM incidence. (A) Adjusted HRs and sub-HRs (F-G model) of T2DM incidence for different groups compared with the lowest group according to the time-dependent TG/HDL-C ratios in the regression analyses among the participants aged less than 75 years in 1992. (B). Adjusted dose–response relationship between the average TG/HDL-C ratios and the risk of T2DM using a restricted cubic spline curve with 95% CIs for HRs. F-G, Fine-Gray; HDL-C, high-density lipoprotein cholesterol; T2DM, type2 diabetes mellitus; TG, triglyceride.
Significant positive association between average TG/HDL-C ratio and T2DM risk was observed by performing a restricted cubic spline Cox regression (figure 2B). HRs and 95% CI were calculated for continuous TG/HDL-C ratios with respect to the reference value of 0.87 after simultaneous adjustment for all potential confounding factors. Based on the association between TG/HDL-C ratio and risk of T2DM, we found that there were significant dose–response relationships between the risk of T2DM incidence and the average TG/HDL-C ratios (p-value <0.001 for linearity of TG/HDL-C ratio in the Cox regression analysis). The HRs of incident T2DM were significantly higher in those with higher TG/HDL-C ratios compared with the reference level of 0.87.
We also analyzed other risk factors associated with the T2DM incidence. The multivariate Cox regression analysis showed that elevated FPG, high BMI and more cigarette consumption were each positively associated with the risk of T2DM, while age was negatively associated with the risk of T2DM (online supplementary table S2). Notably, TG/HDL-C ratio was the strongest one among these associated risk factors.
Furthermore, a univariate Cox regression with TG/HDL-C ratio and a multivariate prediction model including TG/HDL-C ratio, age, BMI, cigarette consumption and FPG were built for predicting the future T2DM incidence. The discriminatory power of the multivariate model (full model) combining TG/HDL-C ratio with other risk factors, where the risk score was calculated by 0.178*TG/HDL-C ratio - 0.040*age + 0.098*BMI + 0.027*cigarette + 0.269*FPG, was moderately high with AUCs 0.713 (95% CI 0.620 to 0.805) and 0.733 (95% CI 0.669 to 0.797), respectively, for 5-year and 10-year T2DM incidence. In addition, based on the results of Fine-Gray model analysis, a multivariate predication model accounting for the competing risk of death was set up with slightly higher AUCs 0.727 (95% CI 0.639 to 0.815) and 0.760 (95% CI 0.703 to 0.817), respectively, for 5-year and 10-year T2DM incidence (online supplementary figure S2).
Discussion
In this prospective community-based and 25-year longitudinal follow-up study, we observed that time-dependent TG/HDL-C ratios were positively associated with the risk of T2DM incidence. All sensitivity analyses showed that TG/HDL-C was an independent risk factor of T2DM. Multivariate prediction models combining TG/HDL-C ratio and other risk factors were built and they had moderately high discriminatory powers.
Some previous studies have demonstrated that high TG/HDL-C ratio was associated with an increased risk of T2DM.19–22 In a prospective cohort study including 5314 participants of African-American, Hispanic, white and Chinese-American ethnicity, T2DM also developed to a significantly greater degree in subjects within the highest group of TG/HDL-C ratios with HR 1.82 (95% CI 1.38 to 2.39) compared with individuals within the lowest group of TG/HDL-C ratios during a mean follow-up of 7.7 years.20 In Chinese people, only two cohort studies have examined whether elevated TG/HDL-C ratios were associated with the increased risk of T2DM incidence.19 22 One cohort study, which included only 687 urban-community adults of Chinese, conducted two surveys during a 15-year follow-up and demonstrated that an increased TG/HDL-C ratios enhanced the risk of T2DM with an adjusted OR 1.341 (p-value=0.010).19 Another prospective study from the Rural Chinese Cohort Study with two surveys during 6-year follow-up and included 11 946 adults of Chinese rural population also showed that people in the highest TG/HDL-C ratio group had the twice risk of developing T2DM incidence than those in the lowest ratio group with an HR of 2.11 (95% CI 1.55 to 2.86).22 However, those two studies included either only urban or rural participants, which were not a good representative sample of Chinese people. Furthermore, since there were only two surveys in these two studies, the conclusions of the association were only based on a single measure. Few studies considered the effect of repeated-measurement of TG/HDL-C ratio and the possible role of time-varying confounders; thus, that might have biased the strength of the association between TG/HDL-C ratio and the incidence of T2DM. In our study that included both urban and rural adults of Chinese population, we have investigated the association of time-dependent TG/HDL-C ratios with the risk of T2DM incidence by adjusting for time-varying confounders meanwhile, which could reduce these deficiencies of the previous studies. Consistent with those findings, we discovered a higher T2DM risk with an increased TG/HDL-C ratio in multiple analyses. Moreover, the notion of the bias discrepancy supported by our observations that the HRs of T2DM risk for time-dependent TG/HDL-C ratios were significantly larger than those for baseline TG/HDL-C ratio in the current analysis. To the best of our knowledge, this is the only multicommunity prospective study of Chinese population that used the TG/HDL-C ratio as a time-dependent variable to examine the potential impacts on T2DM risk.
Some previous reports provided some clues for understanding the mechanisms underlying this association of TG/HDL-C ratios and the risk of T2DM incidence. First, high plasma TG level can increase the IR of peripheral tissues. The intrinsic IR can attenuate the effect of insulin in suppressing TG lipolysis to glycerol and fatty acid, thus high level of TGs leads to the release of more free fatty acids.32 The latter can further exacerbate the problem of insulin sensitivity, a vicious cycle between elevated TG levels and IR,33 which may cause a further reduction in glucose uptake and utilization by the peripheral tissues.34 Second, oxidation and inflammation can predict IR. As HDL-C has the ability of antioxidation and anti-inflammation, reduction in HDL-C may further lead to IR. Third, the combination of TG and HDL-C may have stronger predictability for IR and diabetes. Many studies have showed that the TG/HDL-C may be a proxy of IR to identify subjects at high risk of T2DM16 35 36 and suggested that the TG/HDL-C ratio may be a better surrogate marker of IR than single indicators such as lipoprotein particle concentrations and size, glucose and insulin levels.28 35 This speculation is supported by the results from two large studies, which demonstrated that the ability of fibrates, drugs that raise the HDL-C levels and lower TG levels, seems to reduce IR and lower hazards for diabetes incidence.37 38
This study has several major strengths. It was a multicommunity and well-designed prospective study with follow-up period of 25 years. The data used in this study were robust and the conclusions were convincing based on a good representative sample of Chinese elderly people. To explore the approximated association in reality between TG/HDL-C ratio and the risk of T2DM incidence, repeated measurement of TG/HDL-C ratios were used to identify time-dependent variable, which correct regression dilution bias in analysis procedures and reflect more accurate evaluation of association between TG/HDL-C ratios and T2DM risk. Furthermore, this study benefited from detailed information of standardized procedures including the standard questionnaire, physical examination and laboratory test from each participant, allowing us to adjust for potential confounding factors. Lastly, extensive regression analyses with time-dependent, baseline and average TG/HDL-C ratios were employed to guarantee the robust results of the association between TG/HDL-C ratio and the risk of T2DM.
This study also has some limitations. First, T2DM was defined either as a self-reported history of T2DM and/or an FPG ≥7.0 mmol/L, rather than based on a 2-hour oral glucose tolerance test or the measurement of hemoglobin A1c. It is very likely that some participants, over a course of time, may have developed T2DM and were not diagnosed or another possibility can be that some participants with type 1 diabetes were misdiagnosed as T2DM, when FPG level is met or exceeded 7.0 mmol/L. This missed diagnosis or misdiagnosis may bias the association between TG/HDL-C ratio and the T2DM risk. Second, the levels of TG and HDL-C could have been influenced by the fed-fasted state. Specific detailed dietary habits were not collected and cannot be completely controlled in the current study. Third, since our study only focused on Chinese elderly and the rate of lost follow-up during the surveys was relatively high, which may produce potential bias, further studies on the association between TG/HDL-C ratios and the risk of T2DM with diverse populations and the low rate of lost follow-up would be needed for future generalizability.
In summary, our findings showed that time-dependent TG/HDL-C ratios were positively associated with the risk of T2DM. The elevated TG/HDL-C ratios increased the future risk of T2DM incidence. This emphasizes that lowering TG/HDL-C ratios might benefit not only from weakening “acute” effects on cardiovascular diseases but also from its “chronic” impact on the abnormal metabolism of glucose; thus, attenuating the latter could assist to prevent diabetes in the general population. Given the rapidly increasing number of older adults, repeatedly measured lipid profile values are vital to predict the adverse health outcomes and deserve more attention in clinical practice.
Acknowledgments
The authors thank all the professionals who were involved in the BLSA for their contributions to data collection and quality control.
References
Footnotes
Contributors DZ, ZT and XG contributed to the study concept and design. ZT, FS, XG and DZ contributed to the acquisition of data. DZ, HL, FA and XC performed the statistical analysis. MS, JJ, YH and XG were involved in interpretation of the data. All authors contributed to drafting, modifying and approving the manuscript, and took the responsibility for accuracy and integrity of the manuscript.
Funding This study was supported by grants from the National Natural Science Foundation of China (grants nos 81703317 and 81530087) and the Natural Science Foundation of Beijing Municipal (grant no 7202011).
Competing interests None declared.
Patient consent for publication Not required.
Ethics approval This study was approved by the Ethics Committee of Capital Medical University, China (No Z2019SY008).
Provenance and peer review Not commissioned; externally peer reviewed.
Data availability statement Data are available on reasonable request.