Article Text

Abstract
Introduction Regional fat distribution strongly relates to metabolic comorbidities. We identified the DNA repair genes H2AX and HMGB1 to be differentially expressed between human subcutaneous (SAT) and omental visceral adipose tissue (OVAT) depots. As increased DNA damage is linked to metabolic disease, we here sought to analyze whether depot-specific H2AX and HMGB1 expression is related to anthropometric and metabolic profiles of obesity. We further tested for different H2AX mRNA regulatory mechanisms by analyzing promoter DNA methylation and genotyped rs7350 in the H2AX locus.
Research design and methods Gene expression (OVAT n=48; SAT n=55) and DNA promoter methylation data (OVAT and SAT n=77) were extracted from an existing dataset as described elsewhere. Genotype data for the 3’untranslated region (3’UTR) H2AX variant rs7350 were generated by using the TaqMan genotyping system in 243 subjects of the same cohort. Statistical analyses were done using SPSS statistics software 24 and GraphPad Prism 6.
Results We identified H2AX being higher (p=0.002) and HMGB1 being less expressed (p=0.0001) in OVAT compared with SAT. Further, we observed positive interdepot correlations of OVAT and SAT for both HMGB1 (p=1×10⁻⁶) and H2AX mRNA levels (p=0.024). Depot-specific associations were observed for both genes’ methylation levels with either high density lipoprotein cholesterol, low density lipoprotein cholesterol, triglycerides and/or with OVAT/SAT-ratio (all p<0.05). A significantly lower level of total cholesterol in minor A-Allele carriers of rs7350 compared with AG and GG carriers (p=0.001) was observed. Additionally, subjects carrying the A-allele showed lower SAT HMGB1 expression level (p=0.030).
Conclusion Our results suggest a fat depot-specific regulation of H2AX and HMGB1 potentially mediated by both DNA methylation and genetic variation. Rs7350, DNA methylation and/or mRNA levels of H2AX and HMGB1 are related to lipid parameters. Further studies are warranted to evaluate the functional role of the DNA repair genes H2AX and HMGB1 in obesity and fat distribution.
- metabolic syndrome
- obesity and body fat distribution
- transcription
- fat distribution
This is an open access article distributed in accordance with the Creative Commons Attribution Non Commercial (CC BY-NC 4.0) license, which permits others to distribute, remix, adapt, build upon this work non-commercially, and license their derivative works on different terms, provided the original work is properly cited, appropriate credit is given, any changes made indicated, and the use is non-commercial. See: http://creativecommons.org/licenses/by-nc/4.0/.
Statistics from Altmetric.com
Significance of this study
What is already known about this subject?
DNA damage in adipocytes occurs early in obesity and is related to increased inflammation
HMGB1 level are elevated during adipogenesis which acts as alarm signal of inflammation. In contrast, nuclear HMGB1 is thought to be involved in DNA repair mechanisms like H2AX, which is a key driver for DNA repair. The formation of yH2AX foci serves as earliest signal of occured DNA damage and initiates downstream signalling.
While both, HGMB1 and H2AX protein level are well established markers of inflammtion and DNA repair, regulatory mechanisms of their gene expression level have scarcely been analysed so far, especially in the context of adipose tissue distribution.
What are the new findings?
DNA damage contributes to adipose tissue inflammation and is related to metabolic diseases. We here sought to understand the fat depot-specific regulation of the DNA repair genes H2AX and HMGB1.
We show differential gene expression pattern of H2AX and HMGB1 in subcutaneous adipose tissue (SAT) and omental visceral adipose tissue (OVAT) which is linked to DNA methylation and/or H2AX 3’untranslated region (3’UTR) variant rs7350. Further, we observed associations with lipid metabolites and with the OVAT/SAT ratio.
How might these results change the focus of research or clinical practice?
Our data shed light on the impact of adipose tissue depot-specific regulation of DNA repair genes linking DNA methylation to lipid metabolism and fat distribution. Our data might help to understand the individual risk for developing comorbidities of obesity.
Introduction
Adipose tissue inflammation undoubtedly plays a crucial role in the development of cardiovascular events, diabetes, cancer and other diseases as consequence of morbid obesity. In contrast to subcutaneous adipose tissue (SAT), omental visceral adipose tissue (OVAT) is more ‘dysfunctional’ exhibiting a variety of proinflammatory signals.1 2 Inflammatory factors can cause or induce DNA damage such as DNA double strand breaks (DSBs) which in turn increases inflammation.3 4 Therefore, visceral adipose tissue might be more prone to accumulate DNA damage which is corroborated by higher accumulation of gamma histone variant 2AX foci (yH2AX), the earliest signal for DSBs, as studies in VAT-derived endothelial cells indicate.3 Interestingly, treatment of SAT-endothelial cells from nonobese women with conditioned media derived from obese visceral mature adipocytes leads to an increase of yH2AX, suggesting elevated DNA damage.3
Unlike the canonical histones which are incorporated into chromatin after DNA replication, histone variants are incorporated into chromatin in a replication-independent manner.5 Such histone variants exists for all core histones H2A, H2B, H3 and H4 and are essential in a variety of chromatin modifying processes controlled by, for example, environmental stressors.6 H2AX, encoded by H2AFX (also termed H2AX), is one of the most abundant H2A variants with in average one to two H2AX molecules every fifth nucleosome.5 7 It is involved in various processes where chromatin integrity is critical but is mostly known for its role during DNA repair of DSBs.5 8 On DNA DSB, H2AX is phosphorylated (yH2AX) by kinases of the PI3-family (Ataxia telangiectasia mutated-ATM), which serves as starting point for the recruitment of further DNA damage response proteins to counteract the lesion. While H2AX is already incorporated in native nondamaged chromatin, more can be integrated on DNA damage. The extent of incorporation depends on the availability of free H2AX molecules9 underlining that regulation of H2AX expression and translation is key factor for the ability of a certain tissue to recognize and repair DSB mediated DNA damage. However, regulation of H2AX expression in adipose tissue is not well understood.
In the context of adipose tissue inflammation and DSB repair, another critical protein is the high mobility group Box 1 (HMGB1). HMGB1 contains of two HMG-domains and one acidic tail, while post-translational modifications on the HMG domains are critical for cellular location and hence function of the HMGB1 protein.10 When the cysteine within HMG domain one is fully reduced, HMGB1 is located in the nucleus where it binds to DNA and unwound chromatin by replacing linker histone 1 (H1).11 12 HMGB1 is hypothesized to enable repair proteins to bind around the damage site.12 Whole body HMGB1-knockout mice dye shortly after birth, while knockdown experiments in various cells including 3T3L1 leads to an accumulation of yH2AX suggesting that DNA damage occurs during loss of HMGB1.13–15 Obese individuals are more prone to DNA damage as compared with normal weight adolescents,16 but do also have an improved potential to repair occurred lesions.17 Azzarà et al showed different repair kinetics of DSBs in obese versus lean derived lymphocytes along with differences in HMGB1 expression level.17 There is no doubt that HMGB1 is an important regulator of DNA repair while the precise mechanism is still under debate.14 However, HMGB1 can be actively secreted into the periphery, while dying adipocytes as well as macrophages serve as the main sources of circulating HMGB1.11 Extracellularly, HMGB1 acts in a proinflammatory manner for instance by promoting M2 to M1 macrophage polarization in adipose tissue.11 It is well demonstrated that cytoplasmic HMGB1 is more abundant in adipose tissue from obese humans compared with lean especially in visceral adipose cells including adipose stem cells but also stromal cells.11 Taken together, HMGB1 acts intracellularly to drive DNA repair. However, secreted, extracellular HMGB1 is a strong signal of inflammation and may cause cell death due to its proinflammatory functions. Despite rising knowledge about HMGB1 and H2AX in DNA repair and inflammation, regulation of H2AX and HMGB1 expression in the context of obesity, especially in distinct adipose tissue depots, is not well understood. Based on our own previously published data,18 we identified H2AX as well as HMGB1 to be differentially expressed in human SAT versus OVAT. Therefore, we tested whether differential expression correlates with anthropometric and metabolic variables related to obesity. Further, we hypothesized that this might be mediated by genetic variation (eg, rs7350 in the 3’untranslated region (3’UTR) region of H2AX) and promoter DNA methylation in adipose tissue.
Materials and methods
Study cohort
In the present study, we used the Leipzig Obesity cohort, which has been previously described in detail.2 18–20 Briefly, the cohort contains lean, overweight and obese subjects from whom intraindividually paired samples of SAT and OVAT were taken during bariatric surgery or other procedures such as cholecystectomy. Clinical characterization included anthropometric measurements (height, weight, body mass index (BMI), waist-to-hip-ratio (WHR)) and a wide range of variables clinically relevant for metabolic syndrome such as fasting plasma insulin and glucose levels, lipid parameters, measurements of regional fat distribution or inflammatory markers. Obese individuals were defined to be either subcutaneous or visceral obese based on CT measurements (CT-ratio=OVAT to SAT ratio). The here presented work used a total of 243 individuals of which n=52 are lean, n=42 are overweight and n=149 are obese. Main characteristics of the study population are presented in table 1. The ethics committee of the University of Leipzig has approved all study protocols (approval number: 017-12-23012012) and all participants gave written informed consent before taking part in the study.
Study cohort characteristics
Promoter methylation and gene expression data
DNA promoter methylation data were available for H2AX and HMGB1 in a total of n=77 individuals from a previously published dataset.18 Briefly, genome-wide promoter methylation data were obtained using MeDIP (methylated DNA immunoprecipitation) and subsequently analyzed by using the Human Promoter 1.0R Array (Affymetrix, Santa Clara, California, USA) technology. Gene expression data from the same cohort were extracted from a previously published genome-wide expression data set18 from n=55 (SAT) and n=48 (OVAT) with n=41 overlapping data for SAT and OVAT. RNA integrity was validated by Agilent 2100 Bioanalyzer (Agilent Technologies, Palo Alto, California, USA) and genome-wide mRNA expression data have been generated using human HT-12 gene expression arrays. Only samples with RNA integrity values of more than five were included for further analysis.
Selection of the target genetic variant in the H2AX gene
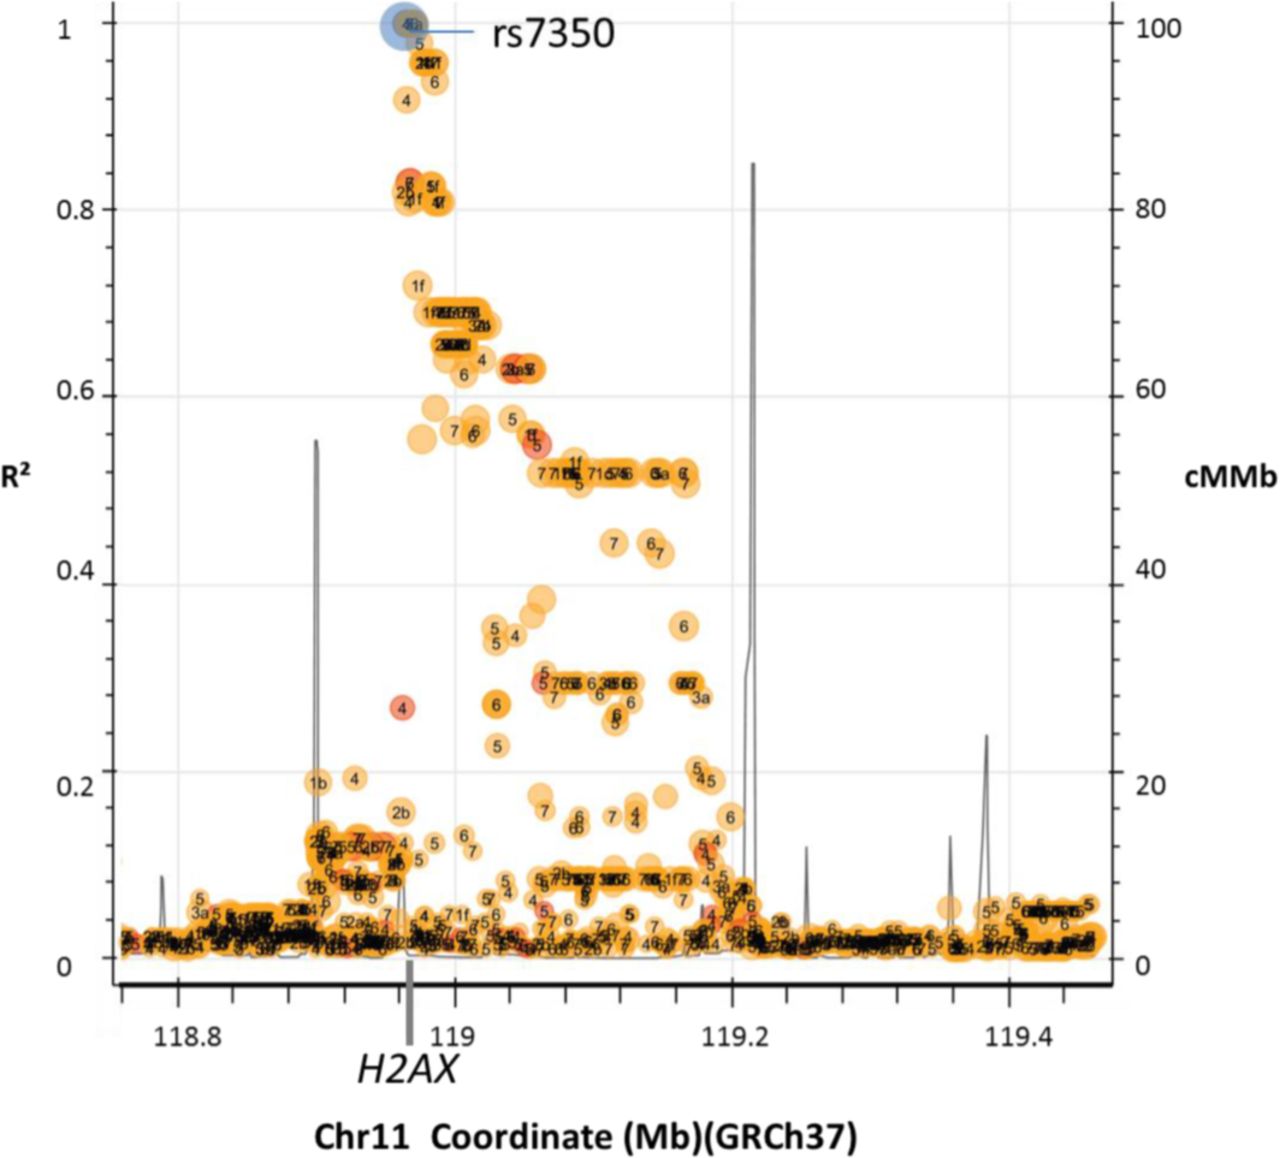
The selection of a potentially regulatory genetic variant for H2AX mRNA expression resulted in rs7350 (G>A) based on the following criteria. First, rs7350 represents a 3’UTR variant while being a tagging SNP (single nucleotide polymorphism) of a larger linkage disequilibrium (LD) block within this region as shown in figure 1. The 3’UTR region of H2AX includes various potentially regulatory features such as binding sites for microRNAs21 and predicted CTCF (CCCTC- factor) domains potentially mediating DNA looping (UCSC genome browser, Hg38, ORegAnno). Second, rs7350 is located in a splice region, and thereby might affect alternative splicing of H2AX. Third, presence of the A-allele results in loss of a CpG site which could potentially affect DNA methylation. All factors hint on rs7350 to be a variant relevant for the regulation of mRNA level of H2AX.

Proxy SNPs for rs7350 in Americans with CEU. Presented are SNPs in linkage disequilibrium to rs7350 in Americans with CEU. The x-axis represents chromosomal position in mega bases on Chr11 according to GRCh37. In addition, genomic location of H2AX is indicated on the x-axis. Peaks highlight recombination hot spots while colors represent functional classes of the genetic variants presented (yellow=coding; red=noncoding; blue=query variant: rs7350). Numbers within the dots rates the regulatory potential of the variant from 1 (high) to 7 (low). Size of dots represents minor allele frequency from small (rare variant) to large (common variant). Details can be found at: (https://ldlink.nci.nih.gov/?var=rs7350&pop=CEU&r2_d=r2&tab=ldproxy). CEU, Central European Ancestry; Chr 11, chromosome 11; cMMb=combined recombination rate; GRCh37, Genome Release 37; Mb, mega bases; R², recombination rate, SNP, single nucleotide polymorphism.
Genotyping
Genomic DNA was extracted from adipose tissue (n=243) using GenElute Mammalian Genomic DNA Miniprep Kit (Sigma-Aldrich, USA) according to manufacturer’s protocols. De novo SNP genotyping for rs7350 was performed by using Allelic Discrimination TaqMan SNP Genotyping System (Applied Biosystems by Life-Technologies Carlsbad, California, USA). Fluorescence signals were detected by the ABI 7500 Real-Time PCR system. To exclude genotyping errors randomly chosen 5% of the samples were regenotyped; all genotypes matched the initially designated genotypes. Each run included six nontemplate controls (water was used as nontemplate). The genotype distribution of rs7350 (AA=31; AG=118; GG=95) was in Hardy Weinberg equilibrium (X²=0.412; p=0.521).
Statistical analyses
SPSS statistics software 24 (SPSS, Chicago, Illinois, USA) and GraphPad Prism 6 (GraphPad, San Diego, California, USA) were used for data evaluation. Prior to statistical analyses all quantitative data were tested to fulfill criteria of a normal distribution by using Kolmogorov Smirnov test and verified visually using histograms. Non-normally distributed data were logarithmically transformed to approximate normal distribution. Data presented in this work are mean±SD if not otherwise stated. Paired and unpaired students t-tests were used for group statistics, while association analyses have been obtained with Pearson’s correlation coefficient. In addition, we performed linear regression analyses to adjust for the potential confounders sex, age and BMI. Results were standardized for the minor allele if not otherwise stated. Genotype data for rs7350 was tested to be in Hardy-Weinberg equilibrium and used as additive (AA versus AG versus GG), dominant (AA+AG versus GG) and recessive mode (AA versus AG+GG) of inheritance for further association tests. To correct for multiple testing we adapted the significance threshold to 5.9×10⁻⁴ (0.05/84 traits). All p>5.9×10⁻⁴ but<0.05 were considered to be of nominal statistical significance. All p values are provided uncorrected for multiple testing. Due to incomplete overlap of DNA methylation, gene expression, genotype and phenotype data, the number of subjects used for specific analyses may vary and is appropriately indicated in figures and tables.
Results
Interdepot-specific variance of H2AX and HMGB1 gene expression and DNA methylation
Among the group of classical DNA repair genes from our genome-wide expression data set,18 we identified H2AX to be the gene most strongly differentially expressed between SAT and OVAT with lower expression in SAT (p=0.002, figure 2A). In addition, HMGB1, another gene relevant in DNA repair processes, was higher expressed in SAT compared with OVAT (p=0.0001, figure 2B). Furthermore, a negative correlation of H2AX and HMGB1 mRNA level in both SAT and OVAT was observed while reaching nominal significance in OVAT only (online supplementary figure 1). No significant relationship was observed between DNA promoter methylation and mRNA expression in the same fat depot for both H2AX and HMGB1 (figure 3).
Supplemental material
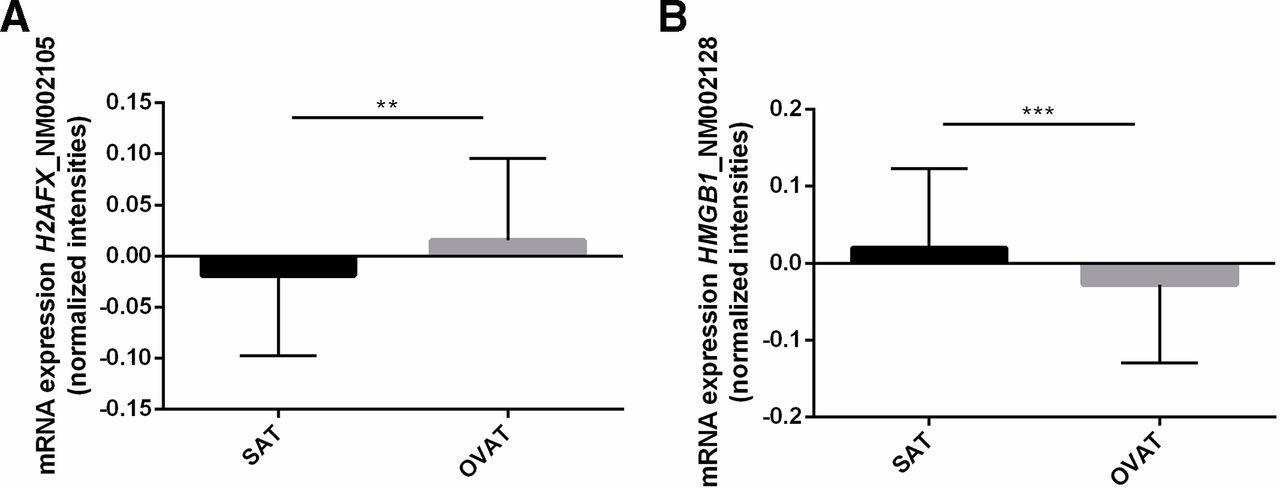
Adipose tissue depot-specific differences in H2AX and HMGB1 gene expression and correlation analyses. (A,B) Data are presented as mean±SD. P-values were calculated using paired samples t-tests in n=41 due to overlapping mRNA data in SAT and OVAT and given as asterix (** = P<0.01; *** = P<0.001). OVAT, omental visceral adipose tissue; SAT, subcutaneous adipose tissue.
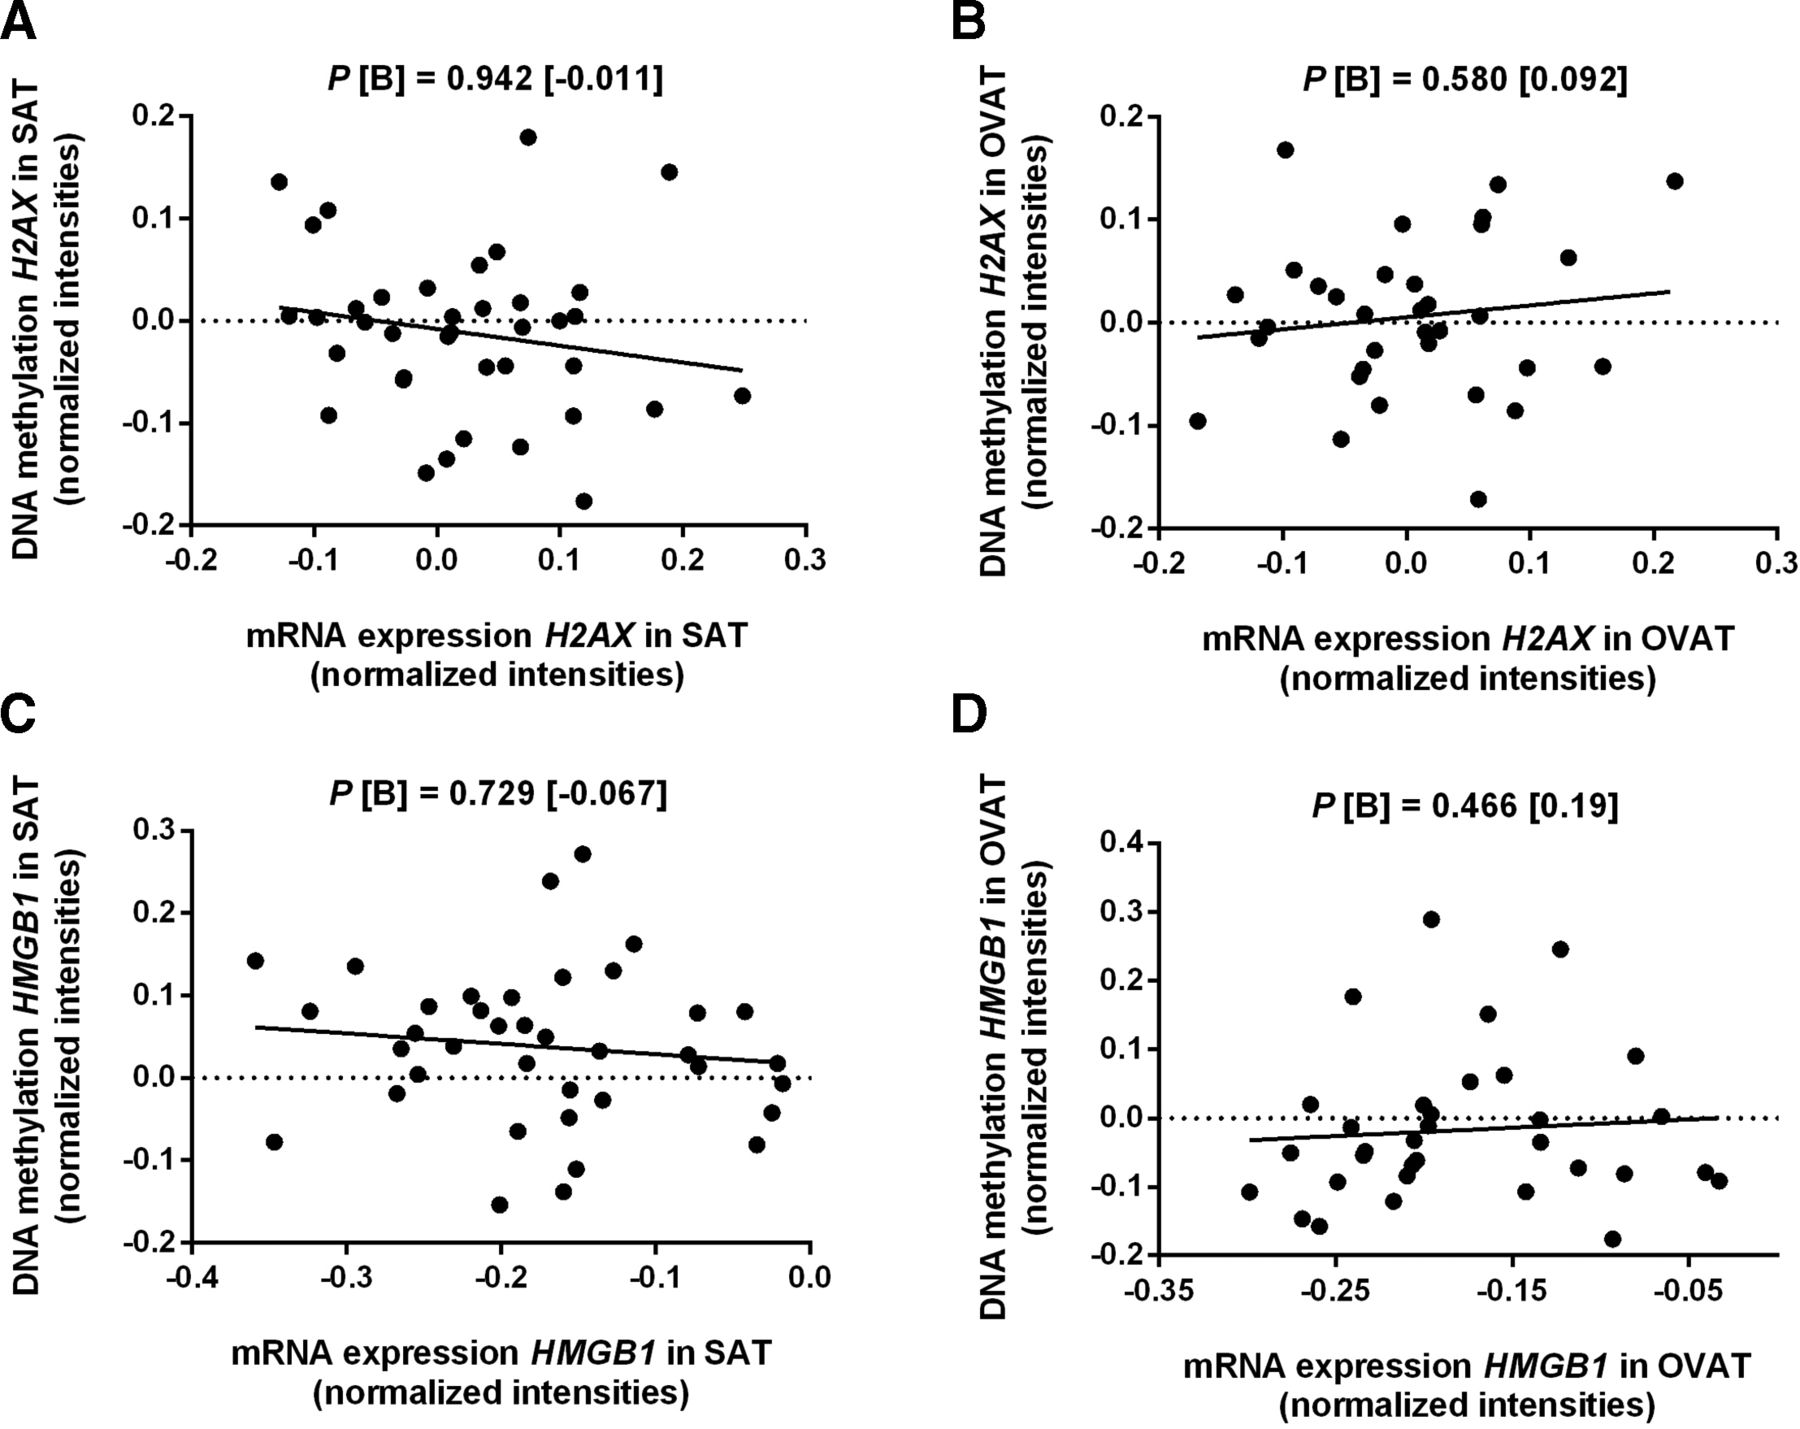
Adipose tissue depot-specific correlations of H2AX and HMGB1 gene expression and DNA promoter methylation. (A–D) Data were calculated using linear regression analyses adjusted for age, sex, BMI in (A,C) n=38 and in (B,D) n=33. B, regression coefficient; BMI, body mass index; OVAT, omental visceral adipose tissue; P, P-value; SAT, subcutaneous adipose tissue.
We identified interdepot correlations of both, H2AX and HMGB1 mRNA level (figure 4). Additionally, H2AX mRNA levels in SAT are correlated with DNA methylation of H2AX in OVAT and HMGB1 in SAT (online supplementary figure 2).
Supplemental material

Interdepot correlation of H2AX and HMGB1 mRNA expression level. Data were calculated using linear regression analyses adjusted for age, sex and BMI in n=41 subjects due to overlapping mRNA expression data of SAT and OVAT. (A) correlation of H2AX mRNA expression level between SAT and OVAT, (B) correlation of HMGB1 mRNA expression level between SAT and OVAT. B, regression coefficient; BMI, body mass index; OVAT, omental visceral adipose tissue; P, P-value; SAT, subcutaneous adipose tissue.
Associations of rs7350 with clinically relevant parameters of obesity
In order to elucidate whether genetic variation in regulatory regions contributes to the observed effects for H2AX, we choose rs7350 as variant of interest due to the criteria as described in the methods section (see also figure 1). To investigate the relevance of this SNP variant in human fat distribution and obesity, we performed association analyses with clinically important variables of these phenotypes. We identified carriers of the minor A-allele to have an overall advantageous lipid profile (online supplementary table 1), while nominal significantly lower total cholesterol levels were observed in subjects carrying the A-allele (figure 5).
Supplemental material
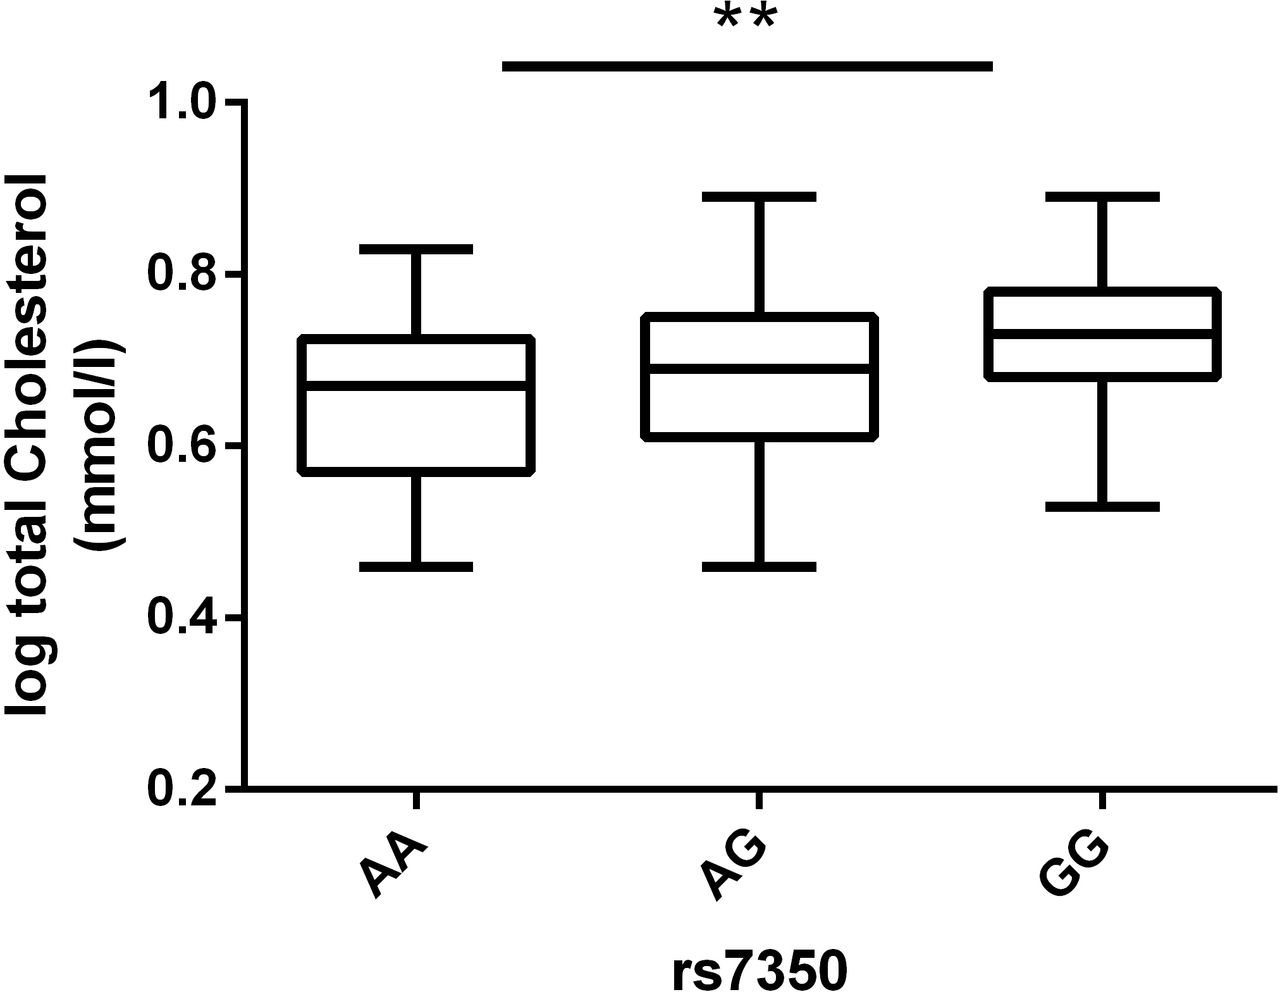
The minor allele of rs7350 is associated with lower total cholesterol level. Data are presented as boxplots with median and quartile distribution. P-values were evaluated using linear regression analyses adjusted for age, sex and BMI for an additive (AA versus AG versus GG; p=0.001), dominant (AA+AG versus GG; p=0.004) or recessive (AA versus AG+GG; p=0.026) mode of inheritance. Numbers of subjects with overlapping SNP and phenotype data for total cholesterol are AA=27, AG=59 and GG=47. BMI, body mass index; **, P-value of additive model; log, logarithmus10. SNP, single nucleotide polymorphism.
Role of rs7350 in DNA methylation and gene expression
To explore potential mechanisms on how rs7350 and/or promoter DNA methylation might interplay with gene expression and/or methylation level, we next analyzed the relationship between genotypes, DNA promoter methylation and gene expression. Indeed, we found that homozygous and heterozygous carriers of the A-allele of rs7350 show decreased DNA promoter methylation levels in SAT which, however, did not reach statistical significance (p=0.068; online supplementary table 2). We did not observe an association of the SNP variant with H2AX expression levels in the same tissue (online supplementary table 2) suggesting that promoter methylation itself might be one factor potentially mediating H2AX expression rather than rs7350 per se. Additionally, A-allele carriers of rs7530 show a nominally significant reduction in HMGB1 mRNA expression in SAT (online supplementary figure 3).
Supplemental material
Associations of H2AX and HMGB1 expression/methylation with clinically relevant parameters of obesity
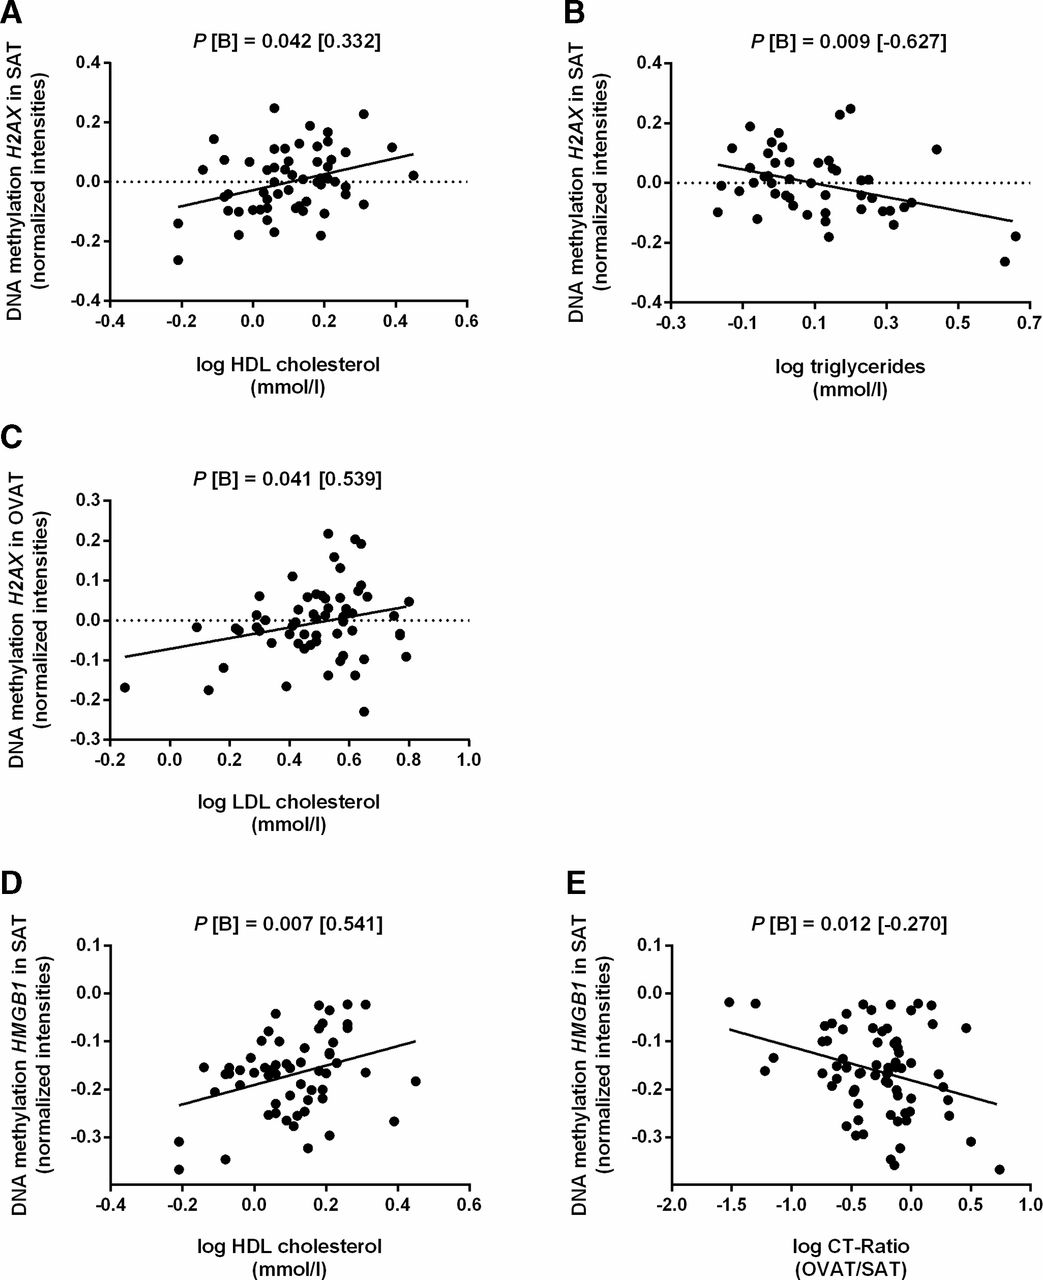
To understand the potential role of differentially regulated DNA repair genes in obesity, we conducted correlation analyses between gene expression and DNA methylation with clinically relevant obesity traits. First, we identified DNA methylation of H2AX in SAT and OVAT to be associated (significant at nominal levels) with parameters of lipid metabolism such as high density lipoprotein cholesterol (HDL-C), low density lipoprotein cholesterol (LDL-C) and triglyceride level (figure 6A–C). However, no correlation of H2AX transcriptomic data with these variables of lipid metabolism was observed. In addition, HMGB1 methylation in SAT was correlated with increased LDL-C level and further with a decreased CT-ratio (figure 6D–E). All analyses withstand adjustment for age, sex and BMI.
Association analyses between DNA methylation level and clinical relevant parameters of lipid metabolism and fat distribution. Data were calculated using linear regression analyses adjusted for age, sex and BMI. Numbers of subjects (N) vary due to availability of phenotype data. CT ratio. (A,B) correlation of H2AX promoter methylation level in SAT with HDL-C (n=57) and triglycerides (n=47). (C) Correlation between H2AX promoter methylation level in OVAT and LDL-C (n=58). (D,E) correlation of HMGB1 promoter methylation level in SAT with HDL-C (n=57) and CT ratio (n=69). B, regression coefficient; BMI, body mass index; HDL-C, high density lipoprotein cholesterol; LDL-C, low density lipoprotein cholesterol; OVAT, omental visceral adipose tissue; P, P-value; SAT, subcutaneous adipose tissue.
Discussion
Adipose tissue distribution may predict obesity-related comorbidities more precisely than overall body fat and body mass index. We previously identified differential genome-wide DNA methylation pattern between intraindividually paired human SAT and OVAT, which translated into distinct gene expression.18 DNA damage occurs due to multiple internal and external factors and obesity, especially adipose tissue inflammation is tightly related to this pathway.11 We therefore sought to identify whether SAT and OVAT from human subjects display differences in regulation of genes involved DNA repair. By doing so, we indeed identified the H2AX gene showing higher mRNA expression level in OVAT compared with SAT. While the role of H2AX in DNA repair is well established, limited knowledge exists about H2AX gene regulation, especially in adipose tissue.5 7 22 23 We analyzed rs7350, a SNP variant within the 3’UTR of H2AX and focused on DNA promoter methylation levels to further elucidate its potential epigenetic regulation in SAT and OVAT. Our results indicate that rs7350 is associated with a protective lipid profile showing lower total cholesterol level in carriers of the A-allele. In addition, we observed that higher H2AX promoter methylation in SAT related to a protective lipid profile including HDL-C and triglycerides. In contrast, H2AX promoter methylation in OVAT related to increased LDL-levels. Further, we found that low levels of H2AX mRNA in SAT were accompanied by higher DNA methylation of H2AX in OVAT. However, we did not find a correlation of gene expression and DNA methylation within either SAT or OVAT. This lack of correlation might be due to a lack of statistical power. Along this line, it may also indicate that the observed interdepot correlation (as presented in the online supplementary file) might be false positive. Therefore, these data clearly need to be carefully interpreted. However, a strong regulation of H2AX, potentially triggering depot-specific gene expression and methylation level, might be crucial for metabolic consequences. Although our data do not provide any evidence for a relationship between genotype data and DNA promoter methylation, the SNP rs7350 might have a direct impact on the overall DNA methylation level at the H2AX locus as being a CpG disrupting variant. Differences at this specific SNP site might affect the binding of transcription factors (TF) necessary for regulation of H2AX expression. One potential TF of interest might be p53. This tumor suppressor was previously shown to mediate expression of H2AX in mouse embryonic fibroblast.24 Moreover, we found H2AX gene expression to be correlated with the expression of HMGB1 in OVAT. However, due to our small sample set these data might be false positive and need to be validated in larger studies. Nevertheless, this observation is interesting as HMGB1 is known to interact with p53 in order to activate gene transcription while both genes are relevant in DNA repair.4 Additionally, in NIH-3T3 mouse fibroblasts, HMGB1 inhibits DNA damage repair in the early hours after the damage which was also supposed to be mediated by p53 interaction.25 Hence, one can speculate that HMGB1 might potentially be involved in the adipose depot-specific regulation of H2AX via p53. Supporting this potential interaction, our data show low HMGB1 methylation level in SAT to be related with increased mRNA expression of H2AX in the same depot. In line with this, higher levels of HMGB1 methylation in SAT seem to be protective as being related to higher HDL-level and a lower OVAT/SAT ratio. It needs to be mentioned, that we find an upregulation of HMGB1 expression in SAT compared with OVAT, while in contrast increased levels of HMGB1 protein in OVAT is postulated in the literature.11 However, we did not measure protein levels and therefore additional regulatory mechanisms might be involved in regulating protein level of HMGB1 in adipose tissue depots. In addition, HMGB1 cellular localization depends on the physiological state of the adipocyte. As we did not assess cellular localization, the overall gene expression level might be higher in SAT compared with OVAT regardless of the protein level in the specific cellular components.
Taken together, DNA methylation of H2AX and HMGB1 might be a critical component for their gene regulation in adipose tissue and inflammation. Furthermore, A-Allele carriers of rs7350 show reduced HMGB1 gene expression in SAT. A protective lipid profile observed in minor allele carriers is not directly related to a reduced HMGB1 expression which might be due to lack of power in our analyses. Further, rs7350 is a proxy within a larger LD-block and therefore H2AX itself might not necessarily be the reason for the correlation with total cholesterol levels. Further, we identified interdepot correlations between OVAT and SAT expression of both H2AX and HMGB1. We also found interdepot correlations of methylation/expression between H2AX and HMGB1 in different adipose tissue depots. These data need to be cautiously interpreted but one might speculate that both genes might be coregulated, either via direct interaction or by a common regulatory mechanism. Future studies should be undertaken in order to clarify the underlying mechanism for the observed correlations of H2AX and HMGB1 expression in adipose tissue and to investigate a potential coregulatory mechanism of these genes. Based on our data, lipid metabolism and the ratio of visceral to subcutaneous fat seem to be related to a depot-specific epigenetic pattern.
Our study is limited at several aspects. First, the sample size for association analyses including genetic factors is rather small and might have led to false positive or false negative results. In addition, analyzing whole adipose tissue does not take into account cell composition rather than cell count. No data are available about the inflammatory state of the subjects’ adipose tissue samples rather than measures of DNA repair capacity. Therefore, we cannot draw any causative conclusions on the above discussed points. Importantly, functional analyses are warranted to confirm or reject the here described results. Therefore, any overinterpretation of our results, which are exclusively based on correlations and associations, should be avoided.
In conclusion, our results suggest a fat depot-specific regulation of H2AX and HMGB1 potentially mediated by both DNA methylation and genetic variation. Rs7350, DNA methylation and/or mRNA levels of H2AX and HMGB1 are related to lipid parameters. Further studies are warranted to evaluate the functional role of the DNA repair genes H2AX and HMGB1 in obesity and fat distribution.
Acknowledgments
The authors thank all individuals who participated in the study. We very much appreciate the excellent technical assistance by Ines Müller. We further thank Lydia Hopp and Hans Binder (Interdisciplinary Centre for Bioinformatics, University of Leipzig) for preprocessing and analysis of the promoter wide DNA methylation and mRNA expression data. We are grateful to Arne Dietrich, Michael R. Schön, Daniel Gärtner, Tobias Lohmann and Miriam Dreßler who contributed adipose tissue samples.
References
Footnotes
Contributors KR performed laboratory work, data analysis, statistics and wrote the manuscript draft. TR and LLCP supported with critical data discussion. MK contributed to sample preparation. MB is PI for the Adiposity cohort and critically discussed the results. YB initiated, conceived and designed the study, contributed to critical data discussion and wrote the final version of the manuscript. All authors contributed to the final manuscript by proof reading, editing and critical discussing the obtained results.
Funding This work was supported by research grants from the IFB AdiposityDiseases: ADI-K50D and ADI K6e-97 to YB. The IFB AdiposityDiseases is supported by the Federal Ministry of Education and Research (BMBF), Germany, FKZ: 01EO1501. KR received a personal EU-Scientia Fellowship (Marie Sklodowska-Curie action from the University of Oslo (FP7-PEOPLE-2013-COFUND)). The research leading to the results has received funding from the European Union Seventh Framework Program (FP7-PEOPLE-2013-COFUND) under agreement n609020-Scientia Fellows. TR and LLCP were funded by Helse-SørØst grants to YB. Further support leading to the results of this work came from the Kompetenznetz Adipositas to MB (Competence network for Obesity) funded by the Federal Ministry of Education and Research (German Obesity Biomaterial Bank; FKZ 01GI1128). A grant by the Deutsche Forschungsgemeinschaft for a Collaborative Research Center (CRC 1052/1 and /2) further supported this work: ‘Obesity mechanisms’ project number 20993838 - SFB1052 (B1 to MB).
Competing interests None declared.
Patient consent for publication Not required.
Ethics approval The Ethics Committee of the University of Leipzig approved this study, while it was performed in accordance to the declaration of Helsinki.
Provenance and peer review Not commissioned; externally peer reviewed.
Data availability statement All data relevant to the study are included in the article or uploaded as supplementary information.