Article Text

Abstract
Objective In the USA, minority populations face a disproportionate burden from type 2 diabetes (T2D), in whom physical activity (PA) is recommended. The aim of this study was to determine levels of PA among a community of free-living Hispanic/Latino adults with T2D using a research accelerometer, a consumer device and a pictogram self-assessment questionnaire.
Research design and methods This was a cross-sectional, observational study. Participants (57 women and 31 men, body mass index (kg/m2) 32.2±7.9 and 29.9±4.5, waist circumference 97.1±30.1 and 93.7±33.0 cm and hemoglobin A1c 8.0±2.0 and 8.1%±1.8%, respectively) wore an ActiGraph (AG) on the hip and a Fitbit (FB) on the wrist for 1 week to estimate daily steps and energy expenditure (EE). Participants reported type and intensity of PA using English-language or Spanish-language pictograms and a 10-point Likert scale (1=‘not active’ to 10=‘very, very active’).
Results Steps per day were not normally distributed; AG median steps/weekday (Monday–Friday) was 6990 (range 1091–25 884) compared with 9329 (288–31 669) using FB (p≤0.01). Both devices recorded significantly more steps on weekdays versus weekends (p≤0.05). EE was also higher during the week. AG and FB were highly correlated to each other (p<0.01). Men were more active than women and maintained their PA throughout the week, whereas women decreased theirs on weekends. Spanish-language pictograms were preferred and self-reported PA matched objective assessments by both devices. Participants perceived themselves to be active (7.1±2.0) due to work.
Conclusions Both objectively measured and self-reported levels of PA in Hispanic/Latino adults with T2D challenge the assumption that lack of PA may be commonplace for this group. AG and FB are different in their measurement of PA but are significantly correlated. New strategies, including use of pictograms, for interventions need to be considered if further increases or changes in PA are to be used as T2D therapy.
Trial registration number NCT03736486
- exercise
- Hispanic
- type 2 diabetes
- physical activity and health
This is an open access article distributed in accordance with the Creative Commons Attribution Non Commercial (CC BY-NC 4.0) license, which permits others to distribute, remix, adapt, build upon this work non-commercially, and license their derivative works on different terms, provided the original work is properly cited, appropriate credit is given, any changes made indicated, and the use is non-commercial. See: http://creativecommons.org/licenses/by-nc/4.0/.
Statistics from Altmetric.com
Significance of this study
What is already known about this subject?
Despite the importance of physical activity in the management of type 2 diabetes (T2D), current evidence suggests that only a proportion of adults with T2D achieve recommended levels of physical activity with important variations by race/ethnicity.
There are different methods of assessing physical activity, each with advantages and limitations.
Measurements of free-living physical activity in community-dwelling Hispanic/Latino adults with T2D are sparse.
What are the new findings?
Among Hispanic/Latino adults with type 2 diabetes, we compared objective measurements of physical activity using a research-based waist worn accelerometer (ActiGraph) with a ubiquitous wrist worn consumer device (Fitbit) and with participants’ self-reported levels. Overall, participants showed moderate levels of physical activity but with the consumer device recording higher step counts compared with the research accelerometer.
We also found differences between men and women for steps and energy expenditure and differences comparing weekdays and weekends for women only.
Overall, both objectively measured and self-reported levels of physical activity challenge the assumption that inactivity is common place for this population with type 2 diabetes.
Significance of this study
How might these results change the focus of research or clinical practice?
While ActiGraph and Fitbit recorded different amounts of physical activity, they are significantly correlated with each other, suggesting either device may be used to measure physical activity, but the accuracy in such measurements may need to be validated against established references.
Moreover, a set of simple pictograms may be a useful adjunct to objective wearable devices to measure physical activity in Hispanic/Latinos with limited health literacy.
Introduction
In the USA, the prevalence of both diagnosed and undiagnosed type 2 diabetes (T2D) is nearly twice as high among Mexican-origin Hispanic/Latino adults compared with non-Hispanic whites.1 Rates of diabetes-related complications, including premature death from diabetes, acute stroke and end-stage renal disease are also higher among Hispanic/Latino adults.2 As part of lifestyle management to improve glycemic control and reduce the risk of complications, the American Diabetes Association recommends that adults with T2D engage in 150 min or more of moderate-to-vigorous intensity aerobic activity per week, spread over at least 3 days each week, with no more than two consecutive days without activity, and including two to three sessions of resistance exercise on non-consecutive days.3 An additional recommendation involves decreasing the amount of time spent in daily sedentary behavior. These recommendations are based on evidence that increasing physical activity appears to be beneficial in reducing cardiovascular risk, improving glycemic control, facilitating weight loss and enhancing psychological well-being for adults with T2D.4
Data from the National Health and Nutrition Examination Survey suggests that only a proportion of adults with T2D achieve recommended levels of physical activity with important variations by race/ethnicity.5 Overall, African-Americans with T2D have the lowest levels of self-reported and objectively measured levels of physical activity, whereas whites appear to overestimate self-reported levels.5 In contrast, Hispanic/Latino adults with T2D are more likely to achieve the recommended levels of physical activity but often underestimate this when self-reporting, although the survey used in that study did not account for occupation-related physical activity.5 Elsewhere, others have reported lower levels of physical activity among Hispanic/Latino adults born outside the USA.6 The reasons for differences in self-reported levels of physical activity are unclear but may suggest different perceptions of physical activity compared with exercise by racial/ethnic group.
Recently, Sansum Diabetes Research Institute (SDRI) launched Mil Familias (MilFamilias.Sansum.org), an observational cohort study which will engage up to 1000 Hispanic/Latino families to address the disproportionate burden of diabetes and cardiometabolic disease affecting this group compared with the background population. As a part of this large study, a 1-year operational pilot recruited approximately 100 Hispanic/Latino adults with an established diagnosis of T2D to test the technical and operational feasibility and the comparability of methods for assessing physical activity using wearable technologies.
The aim of this study was to use self-reported and objective measures to describe physical activity in free-living Hispanic/Latino adults with T2D, including occupational-related physical activity. Objective physical activity was assessed by both a validated research accelerometer and a ubiquitous consumer device. Subjective physical activity was measured with a novel Spanish-language pictogram questionnaire created for this group taking into consideration potential health literacy challenges.
Research design and methods
To assess physical activity, 91 Hispanic/Latino adults aged ≥18 years with T2D were recruited from the local community. All participants provided written informed consent prior to participation in any activities. Demographic data, including date of birth, were recorded at the screening/enrollment visit. Height was measured in centimeters and weight in kilograms using a mechanical column scale with an eye level beam (Seca 700, Seca GmbH & Co. KG, Hamburg, Germany), and waist circumference was measured using a flexible tape at the umbilicus. Hemoglobin A1c (HbA1c) was measured as part of a laboratory venous blood draw. Relative fat mass (RFM) was calculated by the Woolcott and Bergman 2018 method.7 The screening/enrollment, physical examination and laboratory visits were completed before a visit for instruction and placement of the activity monitors. Instruction was undertaken in the participant’s preferred language, either Spanish or English, and written reminders were also provided in the participant’s preferred language. Data collection started as soon as devices were placed on participants, but only complete days with 12 or more hours of wear were used for data analysis.
Physical activity measures
Physical activity was measured using the ActiGraph wGT3X-BT as the reference (ActiGraph, Pensacola, Florida, USA) and the Fitbit Charge 2 (Fitbit, San Francisco, California, USA) monitors as a feasible replacement device, potentially to be used in the larger Mil Familias project mentioned in the ‘Introduction’ section. The ActiGraph is a small (width 3.3 cm×height 1.5 cm×length 4.6 cm) and lightweight (19 g) tri-axial accelerometer and is a commonly used research device for monitoring physical activity in free-living conditions.8 The ActiGraph was worn on the dominant hip with an elastic belt. Fitbit Charge 2 is also a small (width 2.3 cm×height 1.3 cm) and lightweight (32.0–34.9 g) micro-electromechanical tri-axial accelerometer that converts acceleration into step counts and energy expenditure (EE) using proprietary algorithms. The Fitbit was worn on the non-dominant wrist, and the wrist bands accommodated different size wrists (14.0–20.6 cm). Participants were asked to wear both devices 24 hours/day, except when bathing or swimming, for 7 days. Valid wear time was defined as ≥12 hours/day for at least 3 days.9 10
Both devices were initialized using software for each device and with the subject’s gender, height, weight, age, handedness and, for ActiGraph, ethnicity. To avoid changing behavior during the data collection period, Fitbits were not wirelessly synchronized to a mobile phone application but were downloaded at the end of the wear period using a Fitbit app on a computer and via a USB dongle. Fitbit-estimated daily steps and EE were processed at a secure website (Fitbit.com) using proprietary algorithms. ActiGraph measured activity was recorded at a frequency of 30 Hz and analyzed in 60 s epochs using the manufacturer’s software (ActiLife 6.13.3). The downloaded data were screened for wear time using the Troiano algorithm,11 and the Freedson VM3 Combination was used to calculate physical activity EE (kcal/day).8 Resting energy expenditure (REE) was calculated by using gender, height, weight and age and the equation by Mifflin et al.12
To capture self-reported physical activity, a simple, image-based approach featuring Spanish-language pictograms was used to reduce the potential for health literacy challenges influencing the self-assessments. At the visit for the placement of activity monitors, the participants reported type and intensity of physical activity that they normally undertook during specific time periods during the day using Spanish-language pictograms for sleep, sedentary rest, sedentary work, housework, manual work and exercise not work. Participants were instructed to use the one sticker that best described their perceived physical activity level during a day at home and/or a day outside the home, including work. The time periods were 06:00–12:00, 12:00–18:00, 18:00–24:00 and 24:00–06:00 hours. Participants also reported how many days they worked each week and how active they were while at work using a 10-point Likert scale (1=‘not at all active’ to 10=‘very, very active’). This pictogram activity questionnaire was administered by trained community health workers in the participant’s preferred language.
SDRI has developed an ‘Especialista’ model in which bilingual Latino/a community health workers are trained by SDRI in diabetes identification, research methodology and referrals to healthcare and other social needs resources. After enrollment, each participant is paired with an Especialista who speaks their preferred language/s (Spanish and/or English). Participants meet with their Especialista as well as have access via email or phone while enrolled in the study. Especialistas facilitate research activities, which include administering the informed consent and conducting study encounters, such as training and placement of activity monitors.
Statistical analyses
Data analyses were performed using Microsoft Excel Data Analysis ToolPak and GraphPad Prism V.8.1.2 (GraphPad, San Diego, California, USA). Mean and SD were calculated for age, weight, body mass index (BMI), waist circumference, RFM and HbA1c. The accelerometer values were not normally distributed as determined by the Shapiro-Wilk test; therefore, median and range were calculated for all activity variables. Spearman’s correlation coefficients (ρ) were calculated to assess correlations between devices for steps and energy expenditure per day. The average steps per weekday (Monday–Friday) and per weekend day (Saturday–Sunday) were calculated. Differences were compared using Mann-Whitney U tests between men versus women, weekdays versus weekends and devices (table 1 and online supplementary table 4). For the pictogram activity questionnaire, differences between average steps per day for each intensity category in each time period were calculated by paired Student’s t-tests.
Supplemental material
Median step counts recorded by both devices comparing weekdays with weekends by gender
Results
A minimum of 3 days of wear time was required to include a participant’s data, and only days with at least 12 hours of data were used. Data from three subjects were not usable. The mean days of use (±SD) was 6.0±0.7 days for ActiGraph and 5.8±1.0 days for Fitbit. Characteristics of the participants with valid data (n=88) are presented in table 2.
Characteristics of subjects
The mean HbA1c for women and men indicates inadequate diabetes control. In addition, 31% of participants had an HbA1c >9.0% but 35% of participants had an HbA1c <7.0%. For medications, 36% of participants were prescribed insulin, 46% a statin and 31% blood pressure-lowering medication.
Daily, total step counts for both devices were correlated for each day of the week, Monday–Sunday (ρ=0.7–0.9, p<0.001), figure 1.

Fitbit steps per day vs ActiGraph steps per day.
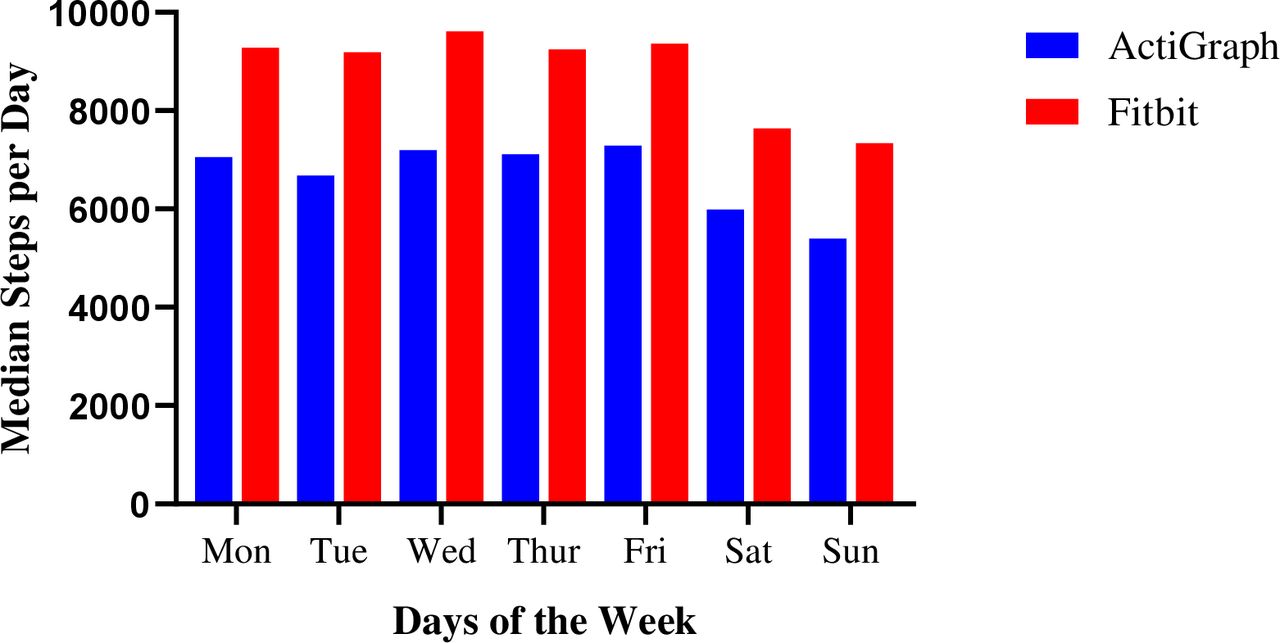
However, median steps/day measured by the ActiGraph was significantly less than the Fitbit assessed counts on all days (p≤0.05), figure 2. For cut-off points of steps per day by each device, we found that most participants had on average between 5000 and 10 000 steps per day (online supplementary table 3).
Supplemental material

Comparison of step counts using Fitbit and ActiGraph over 7 days. Data are shown as median values.
Overall, for the ActiGraph, the median steps/weekday (Monday–Friday) was 6990 (range 1091–25 884) compared with 9329 (288–31 669) using the Fitbit (p<0.01, comparing devices). Additionally, there were significant differences comparing step counts during the week (Monday–Friday) with weekends (Saturday–Sunday) (ActiGraph 5608 (1066–19 892) and Fitbit 7577 (1023–23 603)), with both devices recording higher average number of steps on weekdays (p≤0.05).
There was also a difference in average step counts by gender (table 1), with women averaging a higher step count on weekdays versus weekends. In contrast, the average steps per weekday was similar on weekends for the men.
There were similar differences in device-measured EE (online supplementary table 4).
In terms of the intensity of physical activity measured by the ActiGraph, two participants achieved >6000 steps in an hour; one participant met this level for 2 days (52 years, woman, BMI 26.5) and one for 5 days during a week (43 years, man, BMI 39.1). Thirty (30) participants achieved >3000 steps in an hour during the week; 15 met this on 1 day, 12 on 2 days, 2 on 3 days and 1 on 4 days in the week. Eleven participants achieved >3000 steps in an hour more than once during a day.
Thirty-one participants worked 6–7 days per week; 39 worked 3–5 days per week; 7 worked 1–2 days per week and 14 said they did not work outside the house. For self-reported physical activity, the participants’ average response to “How active are you at work?” was 7.1±2.0 (mean±SD, with a maximum possible score of 10).
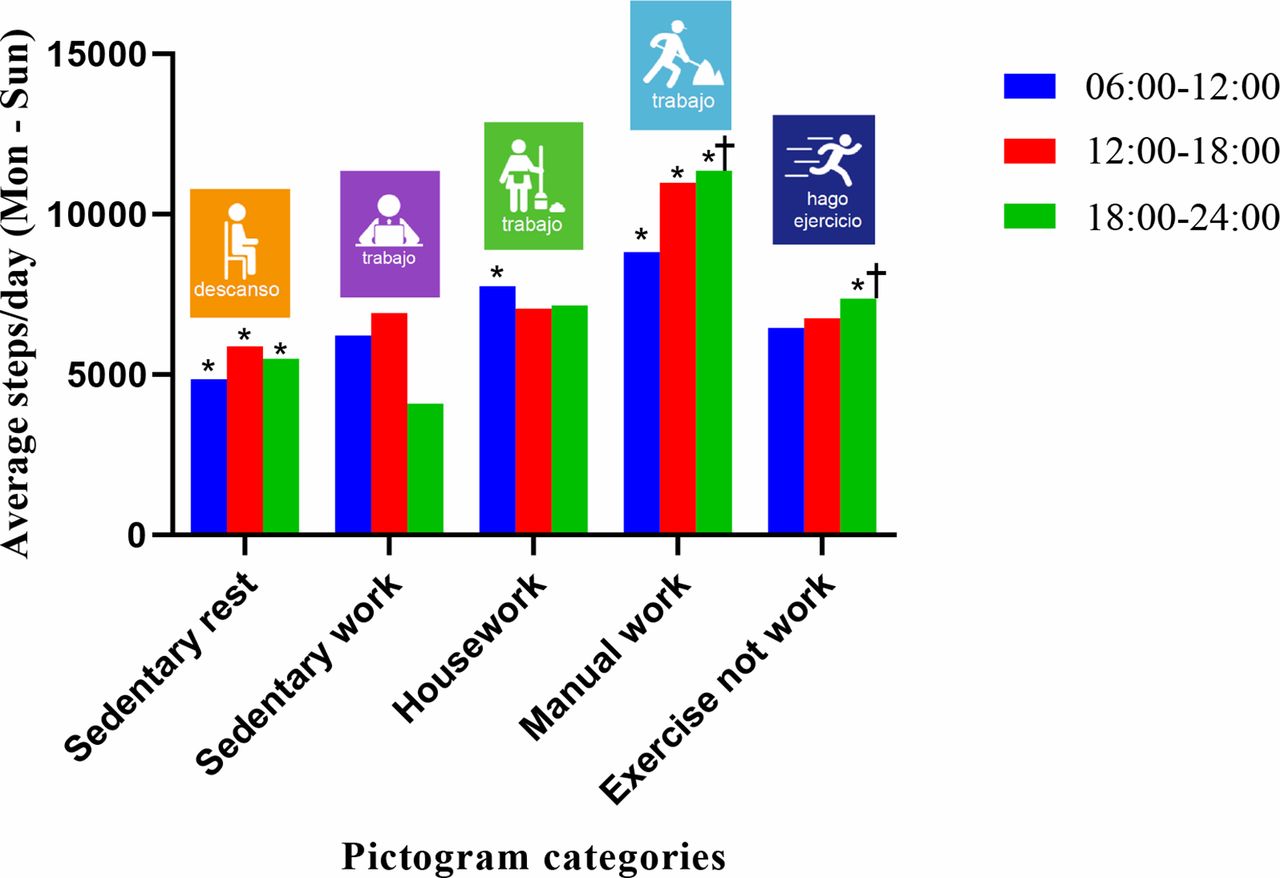
To compare self-reported with objective assessments of physical activity, the median of the average steps measured by ActiGraph was compared with the pictogram for the corresponding times of day (figure 3). Overall, the intensity of objectively measured physical activity increased in line with the self-reported levels using Spanish-language pictograms while outside of the home, except for the ‘exercise not work’ category. All subjects were asleep in the 24:00–06:00 hours time period.
Physical activity assessed by ActiGraph and showing the median number of steps per day and the associated activity pictograms. *P≤0.05 differences between ‘sedentary rest’ and ‘housework and manual work’ for 06:00–12:00 hours, between ‘sedentary rest’ and ‘manual work’ for 12:00–18:00 hours, between ‘sedentary rest’ and ‘manual work and exercise not work’ for 18:00–24:00 hours. †P≤0.05 difference between ‘manual work’ and ‘exercise not work’.
Discussion
In this study, we compared an accelerometer measured assessment of physical activity with a ubiquitous consumer device and a novel pictogram self-assessment method among Hispanic/Latino adults with T2D. In this group, objective measurements of physical activity using both wearable devices showed moderate levels of physical activity, a finding consistent with previous reports.5 Using the physical activity cut points for steps by Tudor-Locke, only 20% of participants were sedentary by ActiGraph and 10% were sedentary by Fitbit.13 The majority of participants had average steps per day of 5000 or more by both devices indicating ‘low activity’ to ‘highly active’. However, we also found that using steps as an assessment of physical activity, the consumer device recorded higher step counts compared with the research accelerometer. This discrepancy has been reported previously elsewhere.14–16 The reasons for the differences in step counts between devices are not clear but may be related to the technology used to assess motion and/or by device placement (ie, wrist vs hip). A new finding is the difference between step counts recorded by both devices during the week compared with weekends. A difference between physical activity on weekdays and weekends has been seen in a pedometer study of mostly white participants without diabetes17 and suggested in other studies of Hispanic/Latino adults.10 18 There was also a difference in average step counts by gender, with women averaging higher step counts on weekdays, while in men the average was similar comparing weekdays with weekends, possibly reflecting different occupations with men continuing to work on weekends. In a previous study of over 12 600 Hispanic/Latino adults, women were more sedentary than men and this was most pronounced in individuals of Mexican background.18 Overall, participants in the current study either approached or met the recommended goal of 10 000 steps per day.19 However, the number of steps needed per day and intensity of steps for health benefits have not been clearly established.20 Participants also perceived themselves to be fairly active due to their work rather than participating in exercise outside of work; this is contrary to previous research,5 but is similar to another study where work explained much of the vigorous activity of men.21
To assess self-reported levels of physical activity, we used simple, Spanish-language pictograms. Capturing useful and reliable data on physical activity levels for US minorities in general can be challenging due to potential language, health literacy and cultural barriers.5 22 Hispanic/Latino adults residing in the USA are four times more likely to not finish high school, twice as likely to live below the poverty line and 20 times less likely to speak proficient English as non-Hispanic whites.23 Visual images, such as pictures and diagrams, can be effective tools for communicating health information, making the presentation of complex information easier to comprehend and supporting written information. Visual communication can benefit all audiences, but can be especially helpful to individuals with lower literacy and numeracy skills, although it is important to appreciate that different understandings may be taken from visual information (https://www.cdc.gov/healthliteracy/developmaterials/visual-communication.html). Often, objectively measured physical activity by activity trackers is not reflected in subjectively measured physical activity by questionnaires.24 25 Overall in this study, participants thought they were fairly active, and we found a significantly higher average steps per day for those indicating ‘manual work’ compared with ‘sedentary rest’ for any time period. The ‘exercise outside of work’ was not associated with a high average steps per day, while the ‘manual work’ pictogram was associated with a significantly higher average steps per day.
There is an association between low levels of physical activity and incident T2D,26 but any amount of physical activity has some health benefits.27 28 A large benefit, defined as a reduction in the HR of premature mortality, occurs when a person moves from being inactive to being insufficiently active (defined as some moderate-to-vigorous physical activity, but not yet meeting the key guidelines target range).27 This relative risk of all-cause premature mortality continues to decline as people become even more physically active. Even at very high levels of physical activity (3 to 5 times the key guidelines), there is no evidence of increased risk of premature mortality. Specifically for individuals with T2D, it has been shown that light physical activity, or performing activities of daily living, following a meal can improve postprandial glucose and glucose homeostasis.29 30
A recent review of studies examining step counts as a measure of physical activity and health found that evidence exists supporting an inverse dose-response relationship between step counts per day with all-cause mortality, cardiovascular disease events and T2D.20 This review could not establish whether the relationship was influenced by age, gender, race/ethnicity, socioeconomic status or weight; thus, more research is needed to examine the effect of these factors. A recent study using data from the Women’s Health Study found that an average of approximately 4400 steps per day was significantly associated with lower mortality rates compared with 2700 steps per day.31 Mortality rates continued to decline up to approximately 7500 steps per day, and stepping intensity (ie, number of steps in 30 min) was not as important as the total number of steps accumulated each day. We examined step counts because steps are a basic unit of human locomotion and can be used to describe physical activity in easy-to-understand terms.20 32 We did not stratify the physical activity of this group in terms of light, moderate, moderate-to-vigorous and vigorous activity, which depends on cut points for the counts to describe levels of physical activity.
Some health insurance companies and employers are now rewarding their members or employees for increased physical activity.33 As an example, United Healthcare Motion
(https://www.uhc.com/employer/programs-tools/unitedhealthcare-motion) gives Apple Watches to participants who reach certain goals, specifically: an intensity of 3000 steps in 30 min; a frequency of 500 steps in 7 min, 6 times per day and 1 hour apart; and a tenacity of 10 000 steps per day. Using the ActiGraph data, we were able to look at hourly physical activity data. Although our subjects are fairly active and approached or reached 10 000 steps per day, only 2 subjects reached 6000 steps in an hour at least twice during the week, and 64% of subjects never reached 3000 steps in 60 min on any day of the week.
We found that EE measured by the ActiGraph was significantly lower on weekends than weekdays among women. The men tended to maintain their EE throughout the week, which may reflect the types of work they do. The difference between ActiGraph and Fitbit estimates of EE were not due entirely to Fitbit’s inclusion of REE. Calculated REE12 was 1302 kcals for women and 1606 kcals for men, but the estimated values using both devices suggested much higher EE. However, errors in predicted EE and steps have been shown for both devices. An ActiGraph worn at the hip tends to underestimate steps and EE, especially for upper body movements without movement of the hip.14 Fitbits worn on the wrist tend to overestimate time spent in moderate-to-vigorous physical activity and steps and to underestimate sedentary time compared with ActiGraph.34 A recent comparison of ActiGraph with the gold standard of doubly labeled water showed that activity-related EE was underestimated in both men and women.35 Elsewhere, two recent studies also suggest that Fitbit overestimates EE.15 36 It will be important for physical activity research to carefully document and report the methods and procedures used for capturing physical activity data.20 37
Strengths and limitations
Our study had several strengths. It is one of the first to compare wearable devices to obtain objective measures of physical activity and to include subjective measures of activity in free-living Hispanic/Latino participants with T2D. We also used trained community health workers to train participants in the use of the devices and to collect the data. It is noteworthy that only three participants were excluded from the analyses due to unusable data; most participants were very compliant and most wore both devices for 6 of 7 days.
There are a few important limitations to this study. As an exploratory-feasibility study to the main trial (Mil Familias), the sample size is relatively small and unbalanced between sexes. Thus, we did not analyze the relationships between free-living physical activity and health outcomes (eg, BMI and HbA1c). The participants did not keep daily physical activity logs, so we cannot specifically describe what activities these participants were doing each day. We could only generalize using the Spanish-language pictograms which were designed to be used among Hispanic/Latino adults of Mexican heritage. This is a cross-sectional study, and the participant’s usual behavior may have been influenced by wearing an activity monitor (Fitbit), where they could see their steps. Simply wearing a visual activity monitor may have increased awareness of how much activity they were doing and could reflect an increase in physical activity that occurs with self-monitoring.38 Wearing an activity monitor that connects through an app on the user’s smartphone and/or through a website has been shown to increase physical activity compared with a pedometer control group.39 Participants in our study did not have access to all behavior change techniques available by syncing with a smartphone or through the Fitbit website,40 but could view their step counts continuously throughout the day. Another limitation is the length of wear time, only 7 days, to describe the mean level of activity. This study plans to include more subjects and to monitor physical activity for 7 days twice a year.
One goal of this study was to describe physical activity levels in this group of Hispanic/Latino adults with T2D. We sought to describe their physical activity with a research accelerometer, a consumer device and self-reported levels using Spanish-language pictograms. The Spanish-language pictogram activity questionnaire appears to be useful when compared with objective measures and therefore may be applicable in future studies to better understand self-perceptions of physical activity and could be extended to other Hispanic/Latino groups.
Conclusions
While ActiGraph and Fitbit use different approaches to assess physical activity, they are significantly correlated with each other, although the consumer device appears to report higher average step counts compared with a validated research accelerometer. For both devices, estimates of EE may be less reliable. Both objectively and self-reported overall levels of physical activity were fairly high among these Hispanic/Latino adults with T2D, and this challenges the assumption that lack of physical activity is common among this group. For larger populations with above-average health literacy challenges, pictograms may be a useful adjunct to more expensive accelerometers or off-the-shelf consumer devices.
Acknowledgments
The authors would like to thank the participants for their time and dedication to improving life for those with diabetes. The authors would also like to thank Casey Conneely and Armando Orozco for their assistance with data analysis.
References
Footnotes
Contributors DK had the original concept for this project. WB, DK, NG, CH and AL wrote the protocol and substantially contributed to the conception and design of the work. WB, NG, AL and JMG were involved in the acquisition of data and participant enrollment and follow-up. WB, DK, NG, JMG and KC analyzed and interpreted the data. WB drafted the manuscript. DK, NG and KC revised and edited the manuscript. All authors have given approval of the final manuscript version to be published and agreed to be accountable for all aspects of the work.
Funding This study was funded by an unrestricted grant from Eli Lilly and Company.
Competing interests None declared.
Patient consent for publication Not required.
Ethics approval The study was approved by an independent review board (Quorum Independent Ethics Review Board, QR# 32669/1).
Provenance and peer review Not commissioned; externally peer reviewed.
Data availability statement Data are available on reasonable request. The investigators agree to share de-identified individual participant data that underlie the results reported in this article, the statistical analysis plan and the study protocol with academic researchers beginning 3 months after publication and ending 5 years following article publication. Proposals should be directed to dkerr@sansum.org. To gain access, data requestors will need to sign a data access agreement.