Article Text

Abstract
Introduction Long-term changes of fasting blood glucose (FBG) in relation to lower-extremity peripheral artery disease (lower-extremity PAD) in people without diabetes has barely been reported. Our study aimed to investigate the association between FBG variability and the incidence of lower-extremity PAD in people without diabetes.
Research design and methods We included 7699 participants without prior lower-extremity PAD and diabetes from the Atherosclerosis Risk in Communities study in the final analysis. At least two measurements of FBG were required during follow-up. Variability of FBG was identified using SD, coefficient of variation (CV), variability independent of the mean (VIM) and average real variability. Lower-extremity PAD was defined as an ankle brachial index <0.9, or hospitalization with a lower-extremity PAD diagnosis. Cox regression model was used to calculate HR for incidence of lower-extremity PAD and FBG variability.
Results During a median follow-up of 19.5 years, 504 (6.5 %) lower-extremity PAD events were observed, 54.4% (n=274) were male, and 17.5% (n=88) were African-American. FBG variability was positively associated with incident lower-extremity PAD, with a linear relationship. HRs for CV and VIM were 1.015 (95% CI: 1.001 to 1.03; p=0.023), and 1.032 (95% CI: 1.004 to 1.06; p=0.022) for lower-extremity PAD, respectively. Participants in the lowest quartile of CV were at lower lower-extremity PAD risk compared with the highest ones (HR: 1.499, 95% CI: 1.16 to 1.938; p=0.002).
Conclusions Higher FBG variability was independently associated with increased prevalence of lower-extremity PAD in people without diabetes.
Trial registration number NCT00005131.
- atherosclerosis
- cardiovascular disease risk
- glucose metabolism
- peripheral arterial disease
This is an open access article distributed in accordance with the Creative Commons Attribution Non Commercial (CC BY-NC 4.0) license, which permits others to distribute, remix, adapt, build upon this work non-commercially, and license their derivative works on different terms, provided the original work is properly cited, appropriate credit is given, any changes made indicated, and the use is non-commercial. See: http://creativecommons.org/licenses/by-nc/4.0/.
Statistics from Altmetric.com
Significance of this study
What is already known about this subject?
Fasting blood glucose (FBG) was associated with risk of vascular disease in people without diabetes.
Higher variability of FBG increased the risk of cardiovascular events and mortality.
What are the new findings?
In a population without diabetes, FBG variability was positively associated with the risk of lower-extremity peripheral artery disease (PAD), with a linear relationship.
How might these results change the focus of research or clinical practice?
Our study suggested that glycemic changes should be emphasized even in people without diabetes.
Additional studies are needed to confirm our findings and explore the mechanisms for the relation between FBG variability and lower-extremity PAD.
Introduction
Lower-extremity peripheral artery disease (lower-extremity PAD) is a severe global health problem, especially in high-income countries during the past few decades.1 Earlier studies have illustrated that many traditional risk factors such as hypertension (HT), diabetes and hyperlipidemia can accelerate the development of lower-extremity PAD.2–4 Our previous studies further demonstrated that new factors such as serum magnesium, cadmium and C reactive protein were associated with the incidence of lower-extremity PAD.5 6 Hyperglycemia is a known risk factor for cardiovascular disease (CVD). However, less attention was paid to the role of normal blood glucose in the process of lower-extremity PAD. Recent studies showed fasting blood glucose (FBG) was associated with the risk of atherosclerosis (AS) in people without diabetes.7 8 Thus, exploring the association between FBG with lower-extremity PAD in people without diabetes may help clinicians to better understand lower-extremity PAD.
Tracking may be defined as the longitudinal stability of a certain risk factor or the predictability of a measurement early in life for values later in life, which is a more effective way to conduct studies.9 Long-term follow-up of risk factors could provide more information than just one-time measurement. High variability of FBG and hemoglobin A1c (HbA1c) could increase the risk of cardiovascular events and mortality.10 11 We also found that higher FBG variability in young adulthood was associated with lower midlife hippocampal integrity and volume in our recent study.12 Actually, long-term changes of risk factors in people without diagnosis of diseases. Changes in insulin, blood pressure (BP) and blood lipids over time had an impact on health many years before diagnosis of diseases.13–16 Norby et al17 studied the trajectories of atrial fibrillation (AF) risk factors for over 25 years, and found that patients with AF increased the prevalence of risk factors 15 years before AF diagnosis. Therefore, studying the trajectories of risk factors is very important for the prevention and treatment of diseases. So far, few studies focused on the association between long-term tracking of FBG and lower-extremity PAD.
The Atherosclerosis Risk in Communities (ARIC) study is a large population-based study with an over 25-year follow-up, which is proper for us to study long-term trajectories of risk factors. Thus, we used data from ARIC to investigate the relation between FBG variability and incident lower-extremity PAD.
Methods
Study population
A total of 15 792 participants were recruited from four US communities in the ARIC study. Participants in ARIC were re-examined four times after the first screen (baseline, visit 1, 1987–1989), then followed by four examinations (visit 2 in 1990–1992, visit 3 in 1993–1995, visit 4 in 1996–1998 and visit 5 in 2011–2013). All participants provided informed consent before each visit.18
The first three measurements of FBG was used to calculate FBG variability, the third visit (visit 3) was defined as baseline in the current study. We excluded those participants with prior lower-extremity PAD (from visit 1 to visit 3; n=1415) at baseline, all diabetes from visit 1 to visit 5 (n=3304), participants with just one-time measurement of FBG (n=307), those without FBG measurement at visit 3 (n=42), as well as those with missing covariates (n=166), leaving 7699 participants in the final analysis (online supplemental file 1).
Supplemental material
Variability of fasting blood glucose
Blood sample was collected from participants who were asked to fast for 8 hours. Aliquots were stored at −70°C for further analyses. FBG was detected using hexokinase/glucose-6-phosphate dehydrogenase method. Diabetes mellitus (DM) was defined as FBG level ≥126 mg/dL (≥7 mmol/L), non-fasting glucose level ≥200 mg/dL (≥11.1 mmol/L) or medication use, or self‐reported physician diagnosis. Variability of FBG was used to investigate trajectory, which was calculated using 1) the coefficient of variation (CV); 2) the variability independent of the mean (VIM), which was calculated as 100×SD/mean β, where β is the regression coefficient based on natural logarithm of SD on natural logarithm of mean; 3) the average real variability (ARV), which was calculated as the absolute difference between successive measurements of FBG, divided by the duration between FBG measurements to create annualized ARV of FBG between all examinations. All the measurements of variability have been previously described.19–21
Lower-extremity peripheral artery disease definition
Individual follow-up for events started from the third visit and continued when lower-extremity PAD occurred or their date of death, or the end of ARIC follow-up, whichever happened first. Lower-extremity PAD was defined as an ankle brachial index (ABI) <0.9, or a hospital discharge diagnosis of lower-extremity PAD, peripheral artery revascularization procedure or peripheral artery intervention therapy during follow-up.18
ABI was defined as the ratio of the ankle systolic blood pressure (SBP) to the brachial SBP. Dinamap 1846 automated oscillometric device (Criticon, Tampa, Florida, USA) was used to measure ankle SBP at the posterior tibial artery with the participant prone, and brachial SBP in the right arm with the participant supine.22 We used the following International Classification of Diseases, Ninth Revision codes to diagnose lower-extremity PAD: 39.25 (aorto-iliac-femoral bypass), 39.29 (leg bypass surgery), 84.11 (toe amputation), 84.12 (foot amputation), 84.15 (below-knee amputation), 84.17 (above-knee amputation), 38.18 (leg endarterectomy), 440.20 (AS of native arteries of the extremities, unspecified), 440.3 (AS of bypass graft of the extremities), 440.4 (chronic total occlusion of artery of the extremities), 443.81 (peripheral angiopathy in diseases classified elsewhere), 443.9 (claudication, peripheral arterial disease not otherwise specified, peripheral angiopathy not otherwise specified, spasm of artery).
Other variables of interest
We got information of age, race, sex, smoking and drinking status, education levels and medication use of participants by self-report. SBP ≥140 mm Hg or diastolic blood pressure (DBP) ≥90 mm Hg or use of antihypertensive medication, or physician diagnosis were used to define HT. Prevalent coronary heart disease (CHD) was acquired by self‐reported history of myocardial infarction, heart surgery, coronary bypass or balloon angioplasty or current medication use.
Body mass index (BMI) was calculated by dividing weight in kilograms by height in meters squared. An estimated glomerular filtration rate (eGFR) was calculated using the four-variable Modification of Diet in Renal Disease equation.23 Enzymatic method was used to measure high-density lipoprotein cholesterol (HDL-C), total cholesterol (TC), triglycerides (TG) and Friedewald equation was used to calculate low-density lipoprotein cholesterol (LDL-C).18
Statistical analysis
Baseline characteristics of participants were described by means and proportions. Analysis of variance was used to compare baseline continuous variables and chi-square tests for categorical variables. Tests were two-sided, and a p value of <0.05 was considered statistically significant.
We modeled each measure FBG variability (SD, CV, VIM and ARV) with the lowest quartile serving as the reference. Linear trends for all continuous variables were tested through the use of restricted cubic splines. In the spline models, CV of FBG as restricted quartile splines with knots at the 5th, 50th and 95th percentiles of its distribution to provide the relationship between CV of FBG and lower-extremity PAD. Cox proportional hazard regression models were used to calculate HR and 95% CIs between FBG variability and time to lower-extremity PAD. Model 1 included adjustment for baseline age, sex, race, education levels, smoking and drinking status. Traditional lower-extremity PAD risk factors such as BMI, SBP, DBP, TC, TG, HDL-C, LDL-C, baseline FBG and eGFR were added in model 2. Model 3 further adjusted for prevalent CHD, HT, history of stroke and use of medication.
We performed subgroup analysis stratified by key demographic and clinical subgroups of age (<60 vs ≥60 years), gender (female vs male), race (white vs black), smoking status (current vs former), kidney function (eGFR <60 vs ≥60 mL/min/1.73 m2). We also stratified the subgroup analysis by prediabetes status (yes vs no) according to baseline FBG (<100 vs 100–126 mg/dL (5.6–7.0 mmol/L)). We further used data from CVD (prevalent of CHD, HT or history of stroke) to conduct sensitivity analysis. Also, we conducted sensitivity analysis excluding participants with missing data. We used mean imputation to deal with missing data. To test for differences within the various subgroups, p values for interaction were derived from multivariable Cox regression models. All analyses were done using SPSS V.22.0 and Stata V.3.0.
Results
Baseline characteristics stratified by CV of FBG
Among 7699 participants included in our study, 44.7% were male, 83.1% were white and the mean±SD age was 60±5.7 years. The median follow-up was 19.5 years. Table 1 summarizes the baseline characteristics of study population by CV levels. Participants in the highest CV quartiles were black, and had higher BMI, DBP, SBP, baseline FBG, TG, eGFR as well as LDL-C levels compared with the lowest ones. And, people in Q4 were more likely to have suffered from prevalent CHD, HT and stroke. Nevertheless, no significant differences among age, gender, TC, HDL-C and use of aspirin and statin were found.
Baseline characteristics of participants according to quartiles of CV of fasting blood glucose
FBG variability and lower-extremity PAD
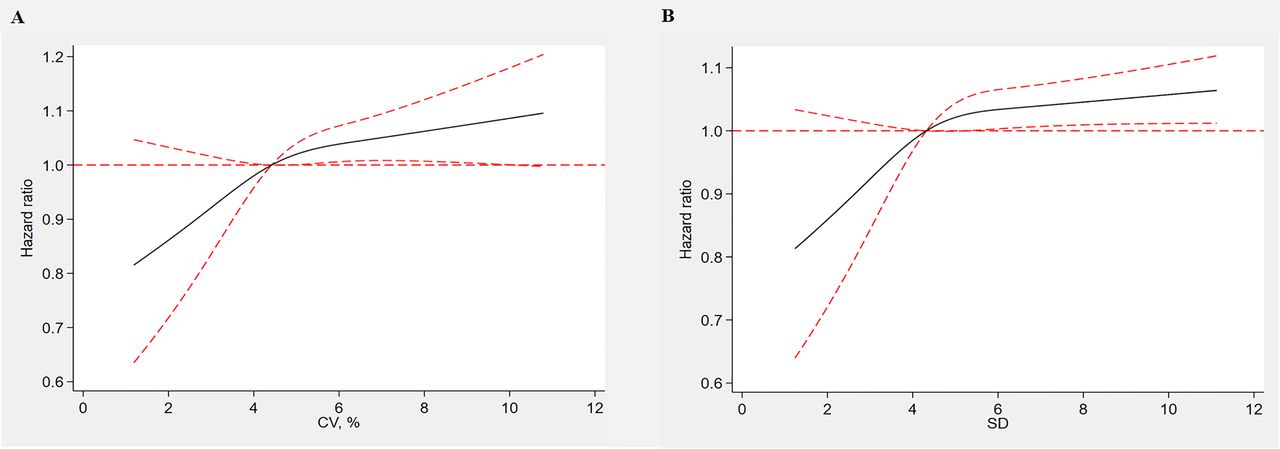
After a medium follow-up of 19.5 years, 504 (6.5%) lower-extremity PAD events were observed, 54.4% (n=274) were male, and 17.5% (n=88) were African-American. We found that higher FBG variability was associated with increased incidence of lower-extremity PAD (table 2) (HR: 1.015, 95% CI: 1.001 to 1.03; p=0.022). Spline regression analysis further confirmed that FBG variability was positively associated with the risk of lower-extremity PAD, with a linear relationship (figure 1).

HRs for peripheral artery disease by fasting blood glucose (FBG) variability. The curves in (A) represent adjusted HRs (solid red line) and their 95% CIs (dashed red line) based on restricted quadratic splines of FBG coefficient of variation (CV) with knots at the 5th, 50th and 95th percentiles of its distribution. The curves in (B) represent adjusted HRs of FBG SD.
The association between FBG variability and lower-extremity PAD
As shown in table 2, after adjusted for multiple adjustment (including age, gender, race, smoking and drinking status, education level, lipids level, BMI, SBP, DBP, baseline FBG, eGFR and prevalent CHD, HT, history of stroke and use of medication), HRs for VIM and ARV were 1.032 (95% CI: 1.004 to 1.06; p=0.023) and 1.016 (95% CI: 1.002 to 1.03; p=0.027) for lower-extremity PAD, respectively. When FBG variability was analyzed as categorical variable, we found that participants in the lowest quartile of CV were at lower lower-extremity PAD risk compared with the highest ones (HR=1.499, 95% CI: 1.16 to 1.938; p=0.002; p for trend=0.011). And similar results were observed with other measures of FBG variability including VIM and ARV (table 2, p for trends <0.05).
Subgroup and sensitivity analysis
Figure 2 summarizes the results of subgroup and sensitivity analysis in our study. When stratified by age, gender and race, the association between FBG variability and lower-extremity PAD was consistent with our previous findings (p for interactions >0.05). Also, no statistically significant interactions were found between FBG variability and smoking status, kidney dysfunction, prevalence of CHD, HT and stroke (all p for interactions >0.05).

HR of peripheral artery disease and FBG CV (A) and SD (B) in demographic and clinical subgroups. CHD, coronary heart disease; CV, coefficient of variation; eGFR: estimated glomerular filtration rate; FBG, fasting blood glucose; HT, hypertension.
Participants were stratified with prediabetes status (yes or no) according to baseline FBG. HRs for FBG variability (CV) and incident lower-extremity PAD were 1.017 and 1.006 (p=0.048 and 0.099). However, no statistically significant interaction was found between those with prediabetes and normoglycemia (p for interaction=0.77) (figure 2).
Discussion
In our study, we found a positive association between FBG variability and lower-extremity PAD in a large population without diabetes. After multiple adjustment, there was a linear relation between FBG variability and the risk of lower-extremity PAD. Our results provided additional information on the relation of FBG and lower-extremity PAD, highlighting the importance of FBG variability in the development of lower-extremity PAD.
As previous studies demonstrated, blood glucose played a significant role in the process of AS in people with or without diabetes.24 25 The Asia Pacific Cohort Studies Collaboration investigated 237 468 participants with or without diabetes, found that FBG within normal range was positive continuous associated with the incidence of CVD. FBG lowering down to levels of at least 4.9 mmol/L could reduce CVD burden.26 As changes of risk factors over time were more reliable than just one-time measurement, more and more studies focused on the association between long-term tracking of blood glucose and CVD.27 28 Ghouse et al10 investigated 6756 participants without diabetes, found that high HbA1c variability was positively related to major adverse cardiovascular events and all-cause mortality. Echouffo-Tcheugui et al11 demonstrated that greater variability of FBG was associated with increased mortality risk. However, few studies have considered the long-term glycemic variability of FBG variability in relation to lower-extremity PAD, especially in people within normal FBG range. To expand the findings of previous studies, we examined the influence of glycemic variability among participants without diabetes. In the current study, we used three methods to assess long-term FBG variability. Consistent with previous studies, our results further demonstrated that higher glycemic variability was positively related to incident lower-extremity PAD in people without diabetes, with a linear relationship (p for trend <0.05). Individuals with a higher variability of FBG tended to be black, with higher baseline FBG, BP and BMI levels as well as higher prevalence of CVDs. Thus, stability of FBG was especially important in these participants. Results of our study strongly underscored the importance of maintaining blood glucose at stable levels throughout the life course.
In a large population (>3.6 million), Savji et al29 concluded that lower-extremity PAD prevalence increased significantly with age. Subgroups analyses in our study demonstrated that the relation was obvious in both young and older, male and female, as well as white and black. We further stratified people with prediabetes status according to baseline FBG levels. However, results from subgroup analyses were similar among participants with or without prediabetes (p=0.77 for interaction). Previous studies showed that CVD risk was significantly increased in prediabetes people.30 31 A systematic review conducted by Ford et al32 showed that impaired fasting glucose (IFG) was associated with increased risk for CVD. However, there were only 3029 prediabetes participants in this study, and most of these previous studies were based on just one-time measurement of FBG. Indeed, compared with previous studies, our present study investigated long-term FBG variability (instead of just baseline FBG measurement) and incident lower-extremity PAD. Preiss et al investigated 6447 males from the West of Scotland Coronary Prevention Study, and followed for 15 years, found that higher FPG in people without diabetes was not associated with long-term risk of cardiovascular events.33 This population was similar to our included participants, and their results were broadly consistent with our own. Moreover, ARIC had one of the longest follow-ups of any studies, representing one of the most powerful prospective studies.
Current cardiovascular risk models differ in the end points and risk factors they consider in their development. The 2013 American College of Cardiology/American Heart Association Guideline on the Assessment of Cardiovascular Risk recommended pooled cohort equation to assess 10-year CVD risk. DM status instead of glucose level was included in this risk prediction model.34 However, two widely used risk models (QRISK2 and 5-year Framingham Risk Score) considered blood glucose levels in their prediction models.35 A few studies demonstrated that prediabetes as well as glucose levels within the normoglycemic range were independently associated with CVD and ischemic stroke.33 36 Our findings further showed that FBG changes among normal range were associated with lower-extremity PAD. Fasting plasma glucose may help in identifying apparently healthy persons with early metabolic abnormalities before progression to prediabetes, and should be considered in CV risk prediction model.
Several mechanisms may be involved in the observed relation between glycemic variability and the increased risk of lower-extremity PAD. To start with, previous studies have shown that fluctuation of glycemia could trigger endothelial dysfunction, and cause oxidative stress.37–40 Also, ‘glycemia swings’ may enhance activation of inflammatory cytokines.41 42 Previous study also illustrated glycemic oscillations could cause apoptosis of pancreatic β-cells.43 In addition, the ‘blood glucose memory’ may play an important role in patients with high FBG variability in the process of lower-extremity PAD.44 Lastly, participants with high variability of FBG tended to have increased prevalence of traditional risk factors for lower-extremity PAD, including older, higher baseline FBG, BP and BMI levels. Future studies are needed to elucidate the exact mechanisms underlying the association between glycemic variability and lower-extremity PAD.
Our study had several strengths. To start with, participants included in our study were from the ARIC study. The ARIC study is a well-designed prospective study with long-term follow-up in a large population, giving us the ability to observe health trends over 25 years. Second, our study included several measures of long-term FBG variability, such as CV, VIM and ARV. In addition, to our knowledge, this was the first study to demonstrate the relation between FBG variability and lower-extremity PAD. Our findings underlined that long-term chronic changes of glycemia in people without diabetes caused damage to vascular system among people without diabetes, especially those at high risk for lower-extremity PAD. Targeting these upstream risk factors could prevent lower-extremity PAD. Our findings were useful to better understand the pathogenesis of lower-extremity PAD and develop preventive strategies. Third, risk prediction models may be improved by including fasting glucose as a continuous risk factor, rather than diagnosis of diabetes.
A few limitations should be mentioned in the study. First of all, our study was not a random clinical trial. We used data from the ARIC study, so our findings needed to be confirmed in future studies. Second, ABI was measured in only a randomly sample of participants at visits 3, 4 and 5. ABI was measured in only one leg at visits 3 and 4. Measurements of ABI in only one leg may not be able to fully diagnose lower-extremity PAD. Third, there were only three measurements of FBG in our study, our results may be can only be extrapolated to other populations without diabetes with the same number of measurements. Furthermore, we did not investigate the relationship between changes of HbA1c (a good indicator reflecting FBG variability) over time with lower-extremity PAD in the current study. As HbA1c was only measured at visits 2 and 5 in a small sample of the ARIC participants, it was difficult for us to investigate the relation between HbA1c variability and lower-extremity PAD. Lastly, this was an observational study, although several other major risk factors were adjusted, we cannot eliminate the possibility of residual confounding.
Conclusions
In conclusion, our study suggested that greater FBG variability was associated with an increased risk of lower-extremity PAD among people without diabetes. Glycemic change in people without diabetes should be emphasized in those with high lower-extremity PAD risk. Future clinical and basic studies are needed to confirm our findings and elucidate the exact mechanisms underlying the relation between glycemic variability and lower-extremity PAD.
Acknowledgments
The authors would like to thank the staff and participants of the ARIC study for their contributions.
References
Footnotes
X-TS and CZ contributed equally.
Contributors XTS, CZ, XDZ and XXL: research idea and study design. XTS, HMZ, ZYX, XDZ: data analysis/interpretation. XDZ, XBZ, XTS, DYY: statistical analysis. XTS, SZZ, YG and XDZ: manuscript drafting. Each author contributed important intellectual content during manuscript writing or revision, and all authors read and approved the final manuscript.
Funding This study was supported by the National Natural Science Foundation of China (grant no.: 81870195) to XXL, and the National Natural Science Foundation of China (grant no.: 81600206) to XDZ.
Competing interests None declared.
Patient consent for publication Obtained.
Ethics approval All participants gave written informed consent prior data collection. The ARIC investigators have full ethical approval from the NIH.
Provenance and peer review Not commissioned; externally peer reviewed.
Data availability statement Data are available on reasonable request. Data may be obtained from a third party and are not publicly available. The datasets generated and/or analyzed during the current study are publicly available. The ARIC data used for this analysis are publicly available.
Supplemental material This content has been supplied by the author(s). It has not been vetted by BMJ Publishing Group Limited (BMJ) and may not have been peer-reviewed. Any opinions or recommendations discussed are solely those of the author(s) and are not endorsed by BMJ. BMJ disclaims all liability and responsibility arising from any reliance placed on the content. Where the content includes any translated material, BMJ does not warrant the accuracy and reliability of the translations (including but not limited to local regulations, clinical guidelines, terminology, drug names and drug dosages), and is not responsible for any error and/or omissions arising from translation and adaptation or otherwise.