Article Text

Abstract
Background The management of diabetes-related complications accounts for a large share of total carbon dioxide equivalent (CO2e) emissions. We assessed whether improving diabetes control in people with type 2 diabetes reduces CO2e emissions, compared with those with unchanging glycemic control.
Methods Using the IQVIA Core Diabetes Model, we estimated the impact of maintaining glycated hemoglobin (HbA1c) at 7% (53 mmol/mol) or reducing it by 1% (11 mmol/mol) on total CO2e/patient and CO2e/life-year (LY). Two different cohorts were investigated: those on first-line medical therapy (cohort 1) and those on third-line therapy (cohort 2). CO2e was estimated using cost inputs converted to carbon inputs using the UK National Health Service’s carbon intensity factor. The model was run over a 50-year time horizon, discounting total costs and quality adjusted life years (QALYs) up to 5% and CO2e at 0%.
Results Maintaining HbA1c at 7% (53 mmol/mol) reduced total CO2e/patient by 18% (1546 kgCO2e/patient) vs 13% (937 kgCO2e/patient) in cohorts 1 and 2, respectively, and led to a reduction in CO2e/LY gain of 15%–20%. Reducing HbA1c by 1% (11 mmol/mol) caused a 12% (cohort 1) and 9% (cohort 2) reduction in CO2e/patient with a CO2e/LY gain reduction of 11%–14%.
Conclusions When comparing people with untreated diabetes, maintaining glycemic control at 7% (53 mmol/mol) on a single agent or improving HbA1c by 1% (11 mmol/mol) by the addition of more glucose-lowering treatment was associated with a reduction in carbon emissions.
- type 2 diabetes
- environmental factors
- economic impact
- cost effectiveness
This is an open access article distributed in accordance with the Creative Commons Attribution Non Commercial (CC BY-NC 4.0) license, which permits others to distribute, remix, adapt, build upon this work non-commercially, and license their derivative works on different terms, provided the original work is properly cited, appropriate credit is given, any changes made indicated, and the use is non-commercial. See: http://creativecommons.org/licenses/by-nc/4.0/.
Statistics from Altmetric.com
Significance of this study
What is already known about this subject?
Diabetes and its complications accounts for a significant proportion of costs in any health service, generating large quantities of carbon dioxide.
Minimizing health service-associated carbon dioxide emissions is a priority to help prevent further global warming.
What are the new findings?
We have used an established model to show that maintaining or reducing glycated hemoglobin concentrations reduces carbon dioxide equivalent emissions compared with those with unchanging glycemic control.
How might these results change the focus of research or clinical practice?
This model can be used as a template for other long-term conditions to assess the environmental impact of treatments on a national basis.
Introduction
The global prevalence of diabetes mellitus has been estimated to increase from 463 million in 2019 to 700 million (20–79 years) by 2045.1 The management of diabetes and its complications imposes a significant economic burden on society.2 3 In addition, the healthcare sector is a significant contributor to the negative impact on the environment. In England, healthcare provision is associated with an estimated annual emission of 22.8 million tons of carbon dioxide equivalent (CO2e).4 A huge proportion of carbon emissions (58.3% in 2015) come from the goods procured by the National Health Service (NHS) in England, with pharmaceuticals estimated to contribute up to 15.3% of the NHS’s carbon footprint.4 Despite an increasingly aging population and a corresponding increase in demand for resources, together with a legal commitment to reduce its carbon footprint by 80% by 2050, the NHS has emphasized the importance of sustainable healthcare.4 5 However, what remains unknown is whether improving markers of chronic disease will have an impact on the carbon footprint. In this study, a novel approach was taken to map the link between healthcare and carbon emission associated with the management of type 2 diabetes mellitus (T2DM).
Methods
Approach and assumptions
A previously validated clinical economic model—the IQVIA Core Diabetes Model (CDM)—was used to estimate the carbon footprint for the analysis.6 This used data based on the UK Prospective Diabetes Study cohorts. Two scenarios were considered to map the impact of effective diabetes management on carbon emission in people with T2DM in the UK when compared with those who were untreated.
Maintaining a glycated hemoglobin (HbA1c) concentration of 7.0% (53 mmol/mol) (scenario 1).
Reducing HbA1c concentration by 1.0% (11 mmol/mol) from baseline (scenario 2).
Each scenario was simulated on two sets of cohorts: people with diabetes on first-line medical therapy and those on third-line therapy (defined in the Study population section). The point estimates for each simulated end point were obtained from the CDM by averaging the model’s output over 1000 simulation replications. We analyzed three outcomes in the study: overall reduction in carbon emission per patient (kgCO2e/patient), reduction in carbon emission per life-year gained (kgCO2e/LY), and improvement in life-year gained. In both scenarios, in order to achieve ‘treatment neutrality’, interventions such as pharmacological or other therapies used to achieve outcomes were not evaluated in the assessment of carbon emission. This allowed an assessment of the relationship between glycemic control and carbon emission by maintaining all other variables constant, including the cost of diabetes treatment.
The assumptions regarding carbon emission were derived from the NHS Goods and Services Carbon Hotspots report that estimated the amount of carbon dioxide (CO2) produced from NHS activities.7 The carbon footprint was assessed using CO2 equivalents (kgCO2e) for the resources used in the management of T2DM complications. A time horizon of 50 years was considered. Future clinical health benefits and costs were converted to present values using a constant discount rate of 5% per year, while the CO2 discount rate was kept at 0% for intergenerational equity reasons.
Estimation of carbon emission related to T2DM complications
The factors related to diabetes management were disaggregated into healthcare resources and services (such as general practitioner visits and specialist clinic visits). These resources/services were broken down into broad sources of carbon emission (eg, building energy, patient travel), which were further segregated into relevant components and activities (eg, medication, equipment). Each unit of activity or resource derived from this breakdown was assigned an associated cost obtained from the NHS Reference Costs,8 the British National Formulary, and the Personal Social Services Research Unit (PSSRU).9 All costs were then converted to 2016 prices by applying inflation/price index (eg, consumer price index). The weighted number of services used (and their costs) was estimated by multiplying the annual number of units used (costs) by the proportion of people receiving those services. The carbon footprint was derived by multiplying the carbon intensity values obtained from the NHS Hotspot report7 by the weighted number of services used (online supplementary table A).
Supplemental material
An alternate assessment of carbon burden
A sensitivity analysis of cost inputs used to estimate the carbon burden was performed to validate base case assumptions. A systematic literature review was conducted to derive the cost of managing diabetes complications.10–16 All the costs were adjusted for 2016 using an inflation rate provided in the PSSRU for each complication.13 These costs were then used to deduce their corresponding carbon emission by multiplying them with a carbon intensity factor of 0.23 kgCO2e/£ (online supplementary table A). In the sensitivity analysis, we simulated the cost inputs from the systematic literature review into the IQVIA CDM and compared the results with the base case in which the cost inputs were previously provided.8 9
In the base case, clinical discounting was taken as 5%. A sensitivity analysis was also performed with discount rates of 2.5% and 3.5% while maintaining CO2 discounting at 0%. The sensitivity analysis based on the discount rates was performed for both sets of cost inputs, that is, those obtained from NHS Reference Costs/PSSRU and the literature review.
Model
A brief overview of the IQVIA CDM is provided here and a detailed description of the model has been previously published.17 The model is designed in a modular way, which permits customization of analyses by facilitating new clinical data, treatment effect, cost and quality of life, and patient management data where and when necessary for type 1 and type 2 diabetes cohorts. The model includes various cost parameters, namely pharmacy, costs associated with screening, treatment procedures for microvascular and macrovascular complications, and management of end-stage complications. A series of submodels are used to simulate the occurrence of diabetes-related complications, including angina, myocardial infarction, congestive heart failure, stroke, peripheral vascular disease, diabetic retinopathy, macular edema, cataract, hypoglycemia, diabetic ketoacidosis, lactic acidosis, nephropathy, neuropathy, foot ulcers and amputations, and mortality, over a range of time horizons. As such the complications were defined in terms of interventions for these complications focusing on hospital admissions and, for example, the need for surgery, and the carbon equivalents of such resource requirements. As such the model also allows users to undertake cost-effectiveness and cost-utility analyses.
Study population
The patient population used in the model was representative of the T2DM adult population in the UK, treated according to the guideline from the National Institute for Health and Care Excellence.18 Two specific patient cohorts were considered, namely people with diabetes on first-line medical therapy and those on third-line therapy attending hospital clinic appointments.
Cohort 1: first-line medical therapy
This cohort consisted of individuals whose diabetes was not adequately controlled by exercise and/or diet and therefore required therapeutic intervention. These people were assumed to be treated with one oral antidiabetic drug (OAD) for initial management of diabetes (eg, metformin).
Cohort 2: third-line medical therapy
This cohort consisted of people whose diabetes remained uncontrolled with a combination of two OADs or an OAD with a glucagon-like peptide-1 (GLP-1) agonist. These people were assumed to be treated with triple therapy (any three OADs, two OADs with a GLP-1 agonist, or insulin with any other drugs). This cohort was chosen rather than the more common second-line escalation because individuals who require such escalations are often referred to secondary care. This means that there is likely to be increased carbon footprint. This difference between first-line and third-line treatment was also felt to most likely demonstrate a greater difference in effect than the simple addition of second-line therapy in the primary care setting.
Results
Baseline characteristics
The mean age in cohort 1 was 59.8 years and 57.1% were male, while in cohort 2 the mean age was 64.5 years and 55.8% were male (online supplementary table B). The baseline characteristics of both cohorts were comparable in terms of mean systolic blood pressure (137.5 mm Hg vs 136.2 mm Hg), mean total cholesterol (4.96 mmol/L vs 4.36 mmol/L), and mean body mass index (31.9 kg/m2 vs 30.5 kg/m2). The average duration since diagnosis was 2 years and 9 years, respectively, for the two cohorts.
Cohort 2 included a higher proportion of comorbidities, including myocardial infarction, stroke, and congestive heart failure, while the proportion of individuals with atrial fibrillation was relatively higher in cohort 1. The incidence of other cardiovascular complications (eg, peripheral vascular disease and left ventricular hypertrophy) was comparable in both cohorts, although cohort 2 had a higher proportion of people with end-stage renal disease.
Modeling results
Reduction in carbon emission due to active treatment
Figure 1 represents the reduction in kgCO2/patient for both scenarios in comparison with untreated people with T2DM. When HbA1c concentration was maintained at 7.0% (53 mmol/mol) (scenario 1), a higher per patient reduction in CO2e was observed in cohort 1 compared with cohort 2 (18% (1546 kgCO2e/patient) vs 13% (937 kgCO2e/patient)). Similarly, when considering a reduction in HbA1c concentration by 1.0% (11 mmol/mol) from baseline (scenario 2), cohort 1 showed a greater CO2e reduction of 12% (1049 kgCO2e/patient) as compared with a CO2e reduction of 9% (655 kgCO2e/patient) in cohort 2.
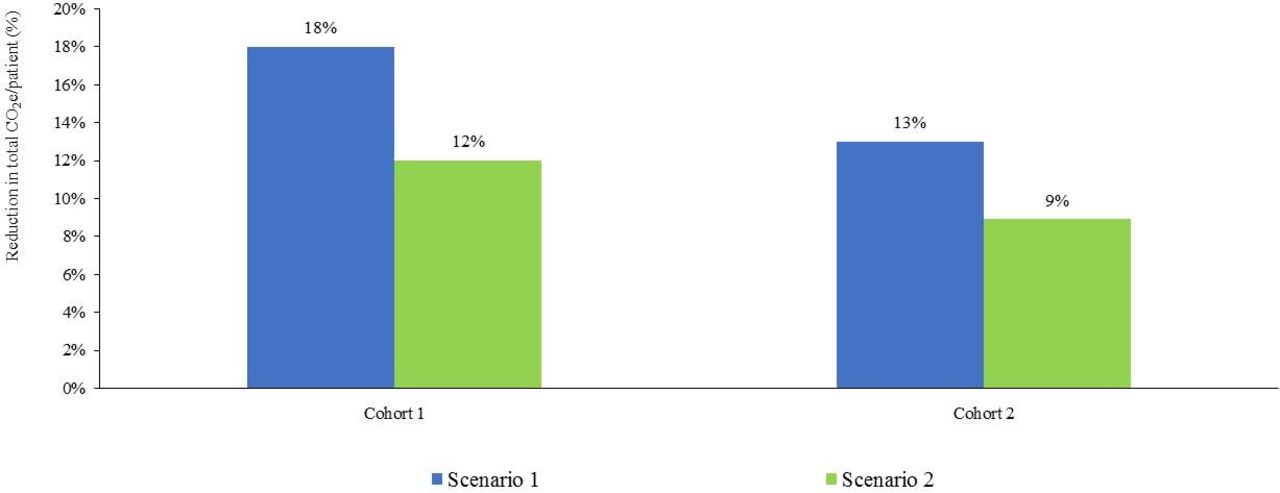
Reduction in total carbon emission per patient. CO2e, carbon dioxide equivalent.
Table 1 describes the outcomes of both scenarios on the reduction in kgCO2e/LY and life year gained as compared with untreated people with T2DM. In scenario 1, a 3.0% and 2.0% improvement in life-year gained was observed for individuals on first-line therapy and those on third-line therapy, respectively. In scenario 2, a 1.9% improvement in life-year gained was observed in both cohorts. The reduction in carbon emission per life-year gained (kgCO2e/LY) on maintaining HbA1c concentration at 7.0% (53 mmol/mol) was 20% and 15% in cohort 1 and cohort 2, respectively. On the other hand, reducing HbA1c concentration by 1.0% (11 mmol/mol) led to a reduction of 14% and 11% of carbon emission per life-year gained, respectively (table 1).
Carbon burden associated with diabetes complication management
Contributing factors to reduction in carbon emission
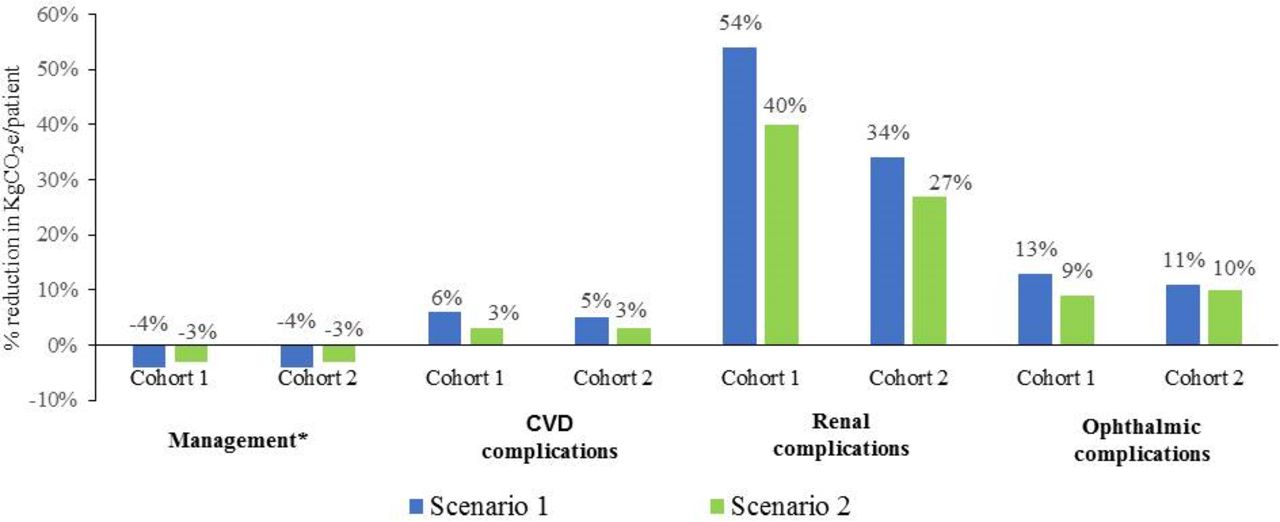
Maintenance or improvement of glycemic control reduced carbon emission, although the degree of reduction varied by which complications were prevented (figure 2). In both scenarios, the largest contributor to the reduction in overall CO2e was the prevention of renal complications. When HbA1c concentration was maintained at 7.0% (53 mmol/mol), carbon emission related to renal complications reported a 54% (955 kgCO2e/patient) reduction in cohort 1 and 34% (504 kgCO2e/patient) reduction in cohort 2. Similarly, the reduction in HbA1c concentration by 1.0% (11 mmol/mol) from baseline led to a reduction in carbon emission associated with renal complications by 40% (708 kgCO2e/patient) in individuals on first-line therapy and by 27% (396 kgCO2e/patient) in those on third-line therapy.

Factors responsible for reduction in total carbon emission per patient. *Components of management-related carbon emission include concomitant medication (statins, ACE inhibitors, and so on), screening, and patient management and preventive programs. CVD, cardiovascular disease; kgCO2e, carbon dioxide equivalent.
Sensitivity analysis
Alternate cost inputs for assessing carbon burden
Sensitivity analyses done using previously published costs were comparable with the results obtained in the base case analysis (figure 3). In the sensitivity analysis, when HbA1c concentration was maintained at 7.0% (53 mmol/mol), first-line medical therapy led to a reduction of 15% (1386 kgCO2e/patient) in carbon emission levels, while third-line therapy resulted in an 11% reduction (786 kgCO2e/patient). When HbA1c concentrations were reduced by 1.0% (11 mmol/mol), first-line therapy reduced carbon emission by 11% (979 kgCO2e/patient), while third-line therapy led to 8% reduction (589 kgCO2e/patient).

Reduction in total carbon emission per patient as calculated with inputs from systematic literature review only. Baseline: results obtained when the respective cohorts were treated with the comparator (placebo/no therapy); scenario 1: HbA1c concentration maintained at 7% (53 mmol/mol) throughout model simulation; scenario 2: HbA1c permanently reduced by 1% (11 mmol/mol) point from baseline; cohort 1: patients on first-line therapy; cohort 2: patients on third-line therapy. CO2e, carbon dioxide equivalent; HbA1c, glycated hemoglobin.
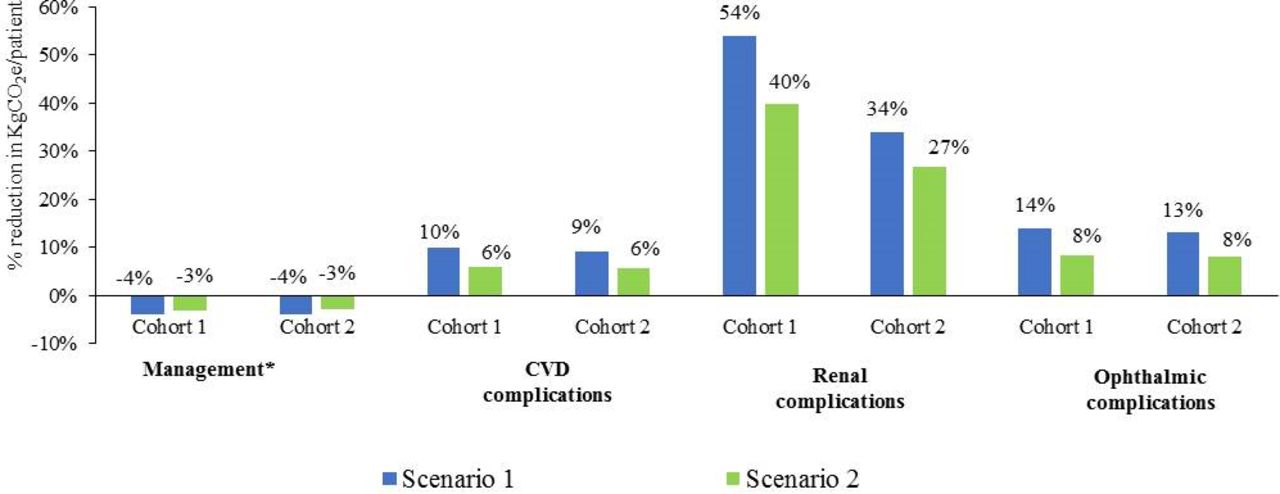
Figure 4 illustrates the contribution of individual T2DM complication management responsible for the overall reduction in kgCO2e/patient in the sensitivity analysis. Similar to the base case, reduction in carbon emission associated with renal complications was the major driver for the overall reduction in CO2e. When HbA1c concentration was maintained at 7.0% (53 mmol/mol), carbon emission related to renal complications reduced by 54% in cohort 1 and 34% in cohort 2, similar to reductions seen in the base case. On reduction of HbA1c concentration by 1.0% (11 mmol/mol), renal complication-related carbon emission reduced by 40% in cohort 1 and 27% in cohort 2 (figure 4).
Factors responsible for reduction in total carbon emission per patient as calculated with inputs from systematic literature review only. *Components of management-related carbon emission include concomitant medication (statins, ACE inhibitors, and so on), screening, and patient management and preventive programs. Baseline: results obtained when the respective cohorts were treated with the comparator (placebo/no therapy); scenario 1: HbA1c concentration maintained at 7% (53 mmol/mol) throughout model simulation; scenario 2: HbA1c permanently reduced by 1% (11 mmol/mol) point from baseline; cohort 1: patients on first-line therapy; cohort 2: patients on third-line therapy. CVD, cardiovascular disease; HbA1c, glycated hemoglobin; kgCO2e, carbon dioxide equivalent.
Clinical discounting rate as a variable
Sensitivity analyses performed on the discount rates of 2.5% and 3.5% showed that the higher the discount rate chosen, the larger the reduction in kgCO2e/LY (online supplementary figure S5 and S6). When discounting was reduced from 5.0% to 3.5%, reduction in CO2e/LY gained decreased by an average of 10%, and when reduced from 5.0% to 2.5% it decreased by an average of 17%. A lower reduction in CO2/LY observed here despite the lower discounting rate was attributed to the CO2 discounting rate being maintained at 0% for both treated as well as untreated individuals (which causes no changes to CO2). This led to an increase only in the denominator at a lower discounting rate, which ultimately led to a lower reduction in CO2e/LY gained.
Discussion
Main findings of this study
This study has addressed the environmental impact that T2DM management has in the UK. Our study has shown that maintaining or improving glycemic control has potential environmental benefits. This study complements an initiative by the NHS Sustainable Development Unit to evaluate the environmental consequences of patient care and to reduce NHS-related greenhouse gas emission by 80%.
What is already known on this topic
While there are a number of data to show that good diabetes control makes a difference to the risk of developing diabetes-related complications, this study shows that in addition to improving outcomes on an individual basis, there are wider population benefits from achieving glycemic targets.
What this study adds
Most of the published work on climate change focuses on the negative impact of greenhouse gas emissions on human health. Kan19 described the contribution of heatwaves to morbidity and mortality from infectious respiratory diseases, while Reacher et al 20 reported a significant increase in the risk of gastroenteritis due to flooding in Southern England. According to the WHO, climate change is expected to cause approximately 250 000 additional deaths per year due to malnutrition, malaria, diarrhea, and heat stress between 2030 and 2050.21 However, unlike most previous work, the current study focuses on the association between healthcare interventions and the environment. A recent study has proposed a method for incorporating the environmental impact into a health economic analysis.22 The current study corroborates the findings of those authors by emphasizing the importance of accounting for the environmental impact of improving glycemic control in the reduction of CO2 emission.
The UK NHS has developed a strategy for minimizing its environmental impact, including a hotspot reference manual for individual health resources used.7 In this study we have applied it in an existing economic model, substituting costs for carbon output in a hypothetical cohort of people with T2DM. All the scenarios analyzed in the study show that maintaining or improving adequate glycemic control in people with T2DM is associated with a reduction in carbon emissions. The highest reduction in CO2e/patient and CO2e/LY was observed in people on first-line therapy whose HbA1c concentration was maintained at 7.0% (53 mmol/mol). Thus, in addition to reducing the likelihood of developing microvascular and macrovascular complications, maintaining good glycemic control maximizes reduction in carbon emission.
In this study, the reduction in renal complication rates was the major contributor to the overall CO2e reduction. Those on first-line therapy showed a greater reduction in renal complications as compared with those on third-line therapy. This can be attributed to a lower incidence of renal complications in those on first-line therapy only.23 Those who maintained lower initial HbA1c concentrations would have a more carbon-efficient outcome compared with less aggressively treated individuals in whom HbA1c became raised, who progressed to renal impairment, or who developed other complications.
The importance of incorporating environmental benefits has also been reinforced by the International Diabetes Federation in its Diabetes and Climate Change Report, which states that ‘inefficient management of diabetes can lead to increased demands on health services and further escalate their already large carbon footprint’.24 In the UK, data from the 2017 National Diabetes Inpatient Audit showed that approximately 18% of all inpatient beds are occupied by someone with diabetes.25 These individuals are most frequently not in hospital due to diabetes but have diabetes in addition to their underlying diagnosis. They are often in hospital for longer than those without diabetes admitted for the same condition and suffer more harm as a result of relatively poor management of their diabetes while in hospital.26 27 Thus, having diabetes as an inpatient, whether as a direct result of diabetes-related complications or not, is energy-intensive and increases greenhouse gas emissions.28 This analysis also acts as a framework for future studies to assess the impact of interventions on glycemic control, resource utilization, and the corresponding carbon emission reduction. Additionally, by considering sustained reductions in HbA1c concentration, future studies can assess the maximum potential of improved patient health on NHS carbon reduction.
Limitations of this study
The results of this study should be interpreted carefully until validated on a wider diabetes population. The current study only quantifies the reduction of carbon emission in the modeled population but does not determine its statistical significance, which is a key limitation. Furthermore the model does not take into account interventions needed to achieve lower HbA1c concentrations in the assessment of carbon emissions. This may have led to the results biasing the benefits of lower HbA1c without also modeling the increased emissions associated with achieving such control. However, we had made an a priori decision to test the novel modeling and not the mode of treatment. For example, specific pharmacy costs were not included directly (because the study was drug agnostic), but drug treatment would have been included in the overall costs per bed day and these then apportioned across all inpatients with diabetes. With these assumptions, there is a possibility that we have overestimated the benefits of lowering HbA1c because it is being accomplished without any carbon emission. This could bias our results, but it is unclear to what magnitude. We accept that the model is not perfect, and we could have potentially limited the time horizon to 10 years, but feel that the current data are a place to start, and as the complexity within the model improves more appropriate considerations can be factored into it.
In addition, our study assumes that once HbA1c concentration is reduced, it will remain at that level. We accept that this is contrary to what is seen in the real-world setting,29 but for the purpose of this modeling exercise we made this assumption. By analyzing two distinct cohorts of people with T2DM, we aimed, in a simple way, to demonstrate the potential carbon emission savings along the treatment pathway. There is also the assumption that by either maintaining glycemic control at 7% (53 mmol/mol) or reducing it by 1% (11 mmo/mol), this will not cause harm. The Action to Control Cardiovascular Risk in Diabetes trial looked to intensify glycemic control in those with a mean age at entry of 62.2 years to below 6.0% (43 mmol/mol) compared with those receiving ‘standard of care’, that is, aiming to achieve an HbA1c of between 7.0% and 7.9% (53–64 mmol/mol).30 This study was stopped early due to the statistically significant 22% increased risk of mortality in the intensive treatment group.30 However, this increased risk has not been shown in other trials.31 32 In addition, there is an argument to be made to run a further analysis to assess the effect of individualization for HbA1c targets, as recommended by the UK National Institute for Health and Care Excellence and the American Diabetes Association.18 33 However, this was not the focus of this work because our aim was to test this approach to find differences in CO2 output reductions according to resource intensity, and not mirror national policies or recommendations.
One observation is that the two methods of generating kgCO2e values for individual complications do not give consistent results. Some values are similar across the two methods (eg, for the cardiovascular events) but some are quite different. This suggests that the quantification of the carbon footprint of individual NHS activities is not yet robust. Wider use of this kind of analysis would benefit from more accurate measurement of the NHS’s current carbon emissions.
Another limitation was the omission of pharmacological therapies from the model. This was done to keep the model as simple as possible. The addition of therapies would have made the model more complicated.
Despite these limitations, the study represents a new robust methodology to ascertain the environmental impact of managing a chronic condition such as diabetes.
This is an important development to adopt in healthcare, since we have shown that for an individual who maintains their HbA1c,using published data on carbon production in car driving, the emissions avoided (955 kgCO2e/patient) equate to not driving 7908 km over a lifetime,34 or 9 months of energy expenditure of the average UK household.35 While we have not scaled this to a national level, an approximation can be made. In UK, 66.5% of 3.5 million people with diabetes have HbA1c <7.5%,36 of whom 90% have T2DM.37 Hence, the UK prevalence for well-controlled T2DM is 2.1 million.
Using published data on carbon production in car driving, the emissions avoided (955 kgCO2e/patient) equate to not driving 4914 miles (7908 km) over a lifetime, or 9 months of energy expenditure of the average UK household. Equating the data on emissions avoided (ie, 7908 km not driven) to the national estimate for people with controlled T2DM, this would imply 2 billion kgCO2e emissions avoided, by not driving 10 billion miles (17 billion km). Data from the UK Department for Transport states that in 2018 there were 808 billion passenger kilometers traveled by 66 million people in the UK, 83% (670 billion km) of which were by car, van or taxi.38 Using this calculation, if glycemic control were to be maintained in the 2.1 million people with T2DM and an HbA1c <7.5% (58 mmol/mol), then almost 21 billion kilometers of motor vehicle travel by people with diabetes could be saved.
Conclusion
This study is novel in its approach because it models one possible outcome (of maintaining appropriate glycemic control) which, if achieved, could potentially reduce carbon emission. Environmental burden analysis is likely to become an integral part of health economic evaluation in the near future. Our findings highlight that effective glycemic control and avoidance of diabetes complications can reduce NHS carbon emission by 10%–20% per life-year gained. These data showcase the potential benefits to the environment of keeping diabetes under control. This approach of estimating carbon emission represents a simple yet important measure to assess the environmental burden attributed to healthcare management. In addition, the study evaluates the impact of effective glycemic management on the environment irrespective of any specific treatment recommendation. This approach could be extended to many other areas to analyze the carbon effectiveness that can be achieved through appropriate disease management.
Acknowledgments
We acknowledge the contribution of S Paranjoy (senior medical writer) for his help in reviewing the manuscript, along with T Merlyn for her help in copyediting the document. Both are employees of IQVIA. We thank Krishnali Parsekar for her help in calculating the mileage saved.
References
Footnotes
Contributors RF, AL, UHP, and MG are the principal investigators of the study who designed, validated, and approved the methodology of the study. RF, Professor of Public Health Economics, led the design of the study and write-up from the University of East Anglia. They also made extensive edits and writing additions to the text of the manuscript, along with KD. KD, Hon Professor of Medicine and Consultant in Diabetes, additionally provided his expert advice on diabetes complication management input, analysis, and interpretation of results from a medical standpoint. RS contributed with her expertise on carbon emission input sources, results, and their interpretation, and additionally commented on the manuscript. MC, MM, and LT analyzed the data and had full access to all data. MM wrote the first draft of the paper. All authors contributed by commenting on data interpretation in the manuscript.
Funding This study was funded by Novo Nordisk and supported in kind by IQVIA and the NHS Sustainable Development Unit. Additionally, the sponsorship helped in convening the expert panel and supported the travel of its members to meetings in London. Novo Nordisk contributed to reviewing the manuscript but in no way influenced the outcome or results of the study.
Competing interests MC, MM, and LT have received personal fees and non-financial support from Novo Nordisk, NHS Sustainable Development Unit and IQVIA. UHP is an employee of Novo Nordisk AS.
Patient consent for publication Not required.
Provenance and peer review Not commissioned; externally peer reviewed.
Data availability statement Data are available upon reasonable request from the corresponding author.