Article Text

Abstract
Objective Observations in real-world settings support and extend findings demonstrated in randomized controlled trials that show flash glucose monitoring improves glycemic control. In this study, Spain-specific relationships between testing frequency and glycemic parameters were investigated under real-world settings.
Research design and methods Deidentified glucose and user scanning data were analyzed and readers were rank ordered into 20 equal sized groups by daily scan frequency. Glucose parameters were calculated for each group: estimated HbA1c, time below range (<70 and ≤54 mg/dL), within range (70–180 mg/dL), and above range (>180 mg/dL). Glycemic variability (GV) metrics were described and data obtained from sensors in Spain and worldwide were compared.
Results Spanish users (n=22 949) collected 37.1 million glucose scans, 250 million automatically recorded glucose readings, and checked glucose values via a mean of 13 scans/day. Estimated HbA1c, time below 70 mg/dL, at or below 54 mg/dL, above 180 mg/dL, and GV metrics were significantly lower in the highest compared with lowest scan rate group (39.6 to 3.9 scans/day). Time-in-range was higher for the highest versus lowest scan rate group at 15.6 vs 11.5 hours/day, respectively. GV metrics correlated positively with time below 70 mg/dL, at or below 54 mg/dL, above 180 mg/dL, and negatively with time-in-range. The relationship between glucose metrics and scan rate was similar in Spain and worldwide. However, time in hypoglycemia in Spain was higher in the groups with lower scan rates.
Conclusions As seen in clinical trials, flash glucose monitoring in real-world settings allows frequent glucose checks. High scan rates are associated with the favorable glycemic markers of increased time-in-range and reduced time in hyperglycemia and hypoglycemia, and GV. The same trends, with unique nuances, are observed in both Spanish and global data.
- blood glucose monitoring
- glycemic control
- hypoglycemia
This is an open access article distributed in accordance with the Creative Commons Attribution Non Commercial (CC BY-NC 4.0) license, which permits others to distribute, remix, adapt, build upon this work non-commercially, and license their derivative works on different terms, provided the original work is properly cited, appropriate credit is given, any changes made indicated, and the use is non-commercial. See: http://creativecommons.org/licenses/by-nc/4.0/.
Statistics from Altmetric.com
Significance of this study
What is already known about this subject?
Flash glucose monitoring improves glycemic control in randomized controlled trials.
What are the new findings?
More frequent flash glucose monitoring is associated with glycemic control and decreases hypoglycemia in a large number of Spanish and global users under real-world conditions. A definite correlation was demonstrated between glycemic variability and time in euglycemia and hypoglycemia.
In Spain (compared with worldwide), greater time in hypoglycemia was observed in the groups with lower scan rates and greater time in hyperglycemia was observed in groups with higher scan rates. Additionally, time-in-range was lower while glycemic variability was higher across all scan rates in Spain.
Glucose scan frequency and improved glycemic markers are strongly correlated; glucose variability, times spent in hypoglycemia and hyperglycemia are reduced while time-in-range is increased with increased scan rates using flash glucose monitoring.
Flash glucose monitoring is a powerful strategy to reduce risk of hypoglycemia by improving glucose variability.
How might these results change the focus of research or clinical practice?
Optimal flash glucose monitoring use includes scanning frequency to improve glycemic markers: increased time-in-range and reduced time in hyperglycemia and hypoglycemia, and glycemic variability. The results underline the importance of glycemic variability reduction as a central mechanism for glucose control improvement by continuous glucose monitoring (CGM) use. As such, time-in-range and glycemic variability glucometrics obtained from CGM can be used as clinical and research variables of glycemic control and acute and chronic complication risk.
Introduction
Diabetes is a chronic disease in which the body’s ability to produce or respond to the hormone insulin is impaired. Consequently, carbohydrate metabolism is abnormal and blood glucose levels are commonly elevated (hyperglycemia). Effective management of hyperglycemia is critical to preventing long-term microvascular complications and macrovascular disease.1–5 Also, treatment of hyperglycemia, particularly in insulin-treated patients, can lead to depressed glucose levels (hypoglycemia). Hypoglycemia is associated with unfavorable clinical outcomes6–10 and frequent glucose monitoring is needed to detect and prevent hypoglycemic crisis.11 12
HbA1c remains the gold standard for monitoring glycemic control and tight HbA1c targets are recommended given the severe effects of both hyperglycemia and hypoglycemia.13 In addition to tight HbA1c control, self-monitoring of blood glucose (SMBG) is critical for safe and effective glycemic therapy adjustments for insulin-treated patients with diabetes.14–16 Frequent glucose testing (greater than eight times/day) is associated with improved glycemic control.17 18 However, repeated daily glucose checks are painful, inconvenient, and can be challenging to maintain long term. A recent UK-based analysis of pharmacy records reported an SMBG test rate of 2.1 tests/day for patients using insulin.19 Meanwhile, rates between 2.5 and 5.5 tests/day were reported for patients using modern blood glucose meters and sophisticated cloud-based analysis software across Europe and North America.20
Flash glucose monitoring, a new approach to glucose monitoring, has emerged as a practical solution to the previous challenges of glucose monitoring.21 In particular, the FreeStyle Libre flash glucose monitor (Abbott Diabetes Care, Witney, UK) enables patients to conveniently access their glucose levels at any time by scanning a sensor for glucose readings. The device does not require calibration, has a long sensor lifetime of 14 days, and is relatively affordable. Taken together, these characteristics have led to an increased frequency of glucose testing by patients with diabetes.
The positive relationship between high-frequency testing and improved glycemic control under real-world conditions was recently demonstrated,22 23 confirming observations previously made in randomized controlled trials.24–27
Information obtained from continuous glucose monitoring (CGM) can guide users’ therapeutic changes to reduce glycemic variability (GV).28 An improvement in GV is a leading contributor to reduced hypoglycemic events, the most worrying acute diabetes complication.29
This study focused on country-specific impacts of flash glucose monitoring in real-world clinical practice in Spain over a period of 52 months. Similarities and differences between the global findings previously observed were also explored.
Materials and methods
Sensors and readers
The FreeStyle Libre system is a continuous glucose monitor with a sensor filament in the subcutaneous tissue that measures interstitial fluid glucose levels for up to 2 weeks. A reader is used to wirelessly scan the sensor at any time to collect the current glucose, glucose trend, and up to 8 hours of glucose readings automatically stored every 15 min. The reader’s 90-day memory is deidentified and uploaded to a database when connected to the reporting software, which includes an agreement that deidentified data will be collected. This database collected uploads from 22 949 readers and 207 386 sensors from Spain between September 2014 and December 2018. Recently, the device was financed in Spain by the public health system only and for use by children under 18 years of age.
Scanning details
Daily scan frequency was determined for each sensor as the sum of scans divided by the full sensor duration of sensor time. Scanning frequency per reader was assessed by calculating mean scans of all its sensors followed by determining cumulative frequency distribution and summary metrics (mean, median and IQR).
Glycemic measures analyzed
Each sensor was required to have at least 120 hours of automatically stored readings (480 readings) to ensure reliable glucose control measures, and data from sensors for each reader were combined. The readers were rank ordered by scan frequency and grouped into equal groups of 1147 readers, each group having 5% of the total readers. Time in euglycemic range (defined as glucose between 70 and 180 mg/dL), time in hyperglycemia (>180 mg/dL) and time in hypoglycemia (<70 and ≤54 mg/dL) were evaluated. Mean glucose was reported as estimated HbA1c by the method30 accepted by international professional diabetes societies, which is highly correlated to the more recent Glucose Management Index.31 GV metrics (SD (mg/dL) and coefficient of variation (CV; %)) are also described, as they are risk indicators, independent of hypoglycemia. Separately, the readers were rank ordered by glucose variability measures and grouped into 20 equal groups for analysis of correlations with estimated HbA1c, time in hypoglycemia, time-in-range (TIR) and time above range.
Spanish versus worldwide data comparison
A comparison between Spanish and worldwide users’ data was also made. Glucometrics were compared between six groups with equivalent scan rates, across the range of scan frequencies observed (5–30 scans/day). The worldwide data were obtained from September 2014 to December 2018, comprising 688 640 readers, 7.33 million sensors, 1.1 billion glucose scans, and 8.55 billion automatically recorded glucose readings worldwide. Ninety-seven percent of the readers came from 29 countries on five continents with at least 2000 readers.
SMBG data
Data from users who used the reader’s SMBG test strip port in parallel to sensor scanning were available and rates of SMBG were determined.
Statistical analysis
Statistical comparisons across the groups were performed by one-way analysis of variance. Glycemic measures and relative changes were reported across the lowest to highest scan rate groups.
Analysis of the database was performed by structured query language routines, KNIME (www.knime.org) and R statistical package (www.r-project.org). Given the large sample size and multiple comparisons, p<0.001 was considered statistically significant. For each scan rate group, the CIs were calculated for the least squares mean of each measure.
Results
User base and glucose testing frequency
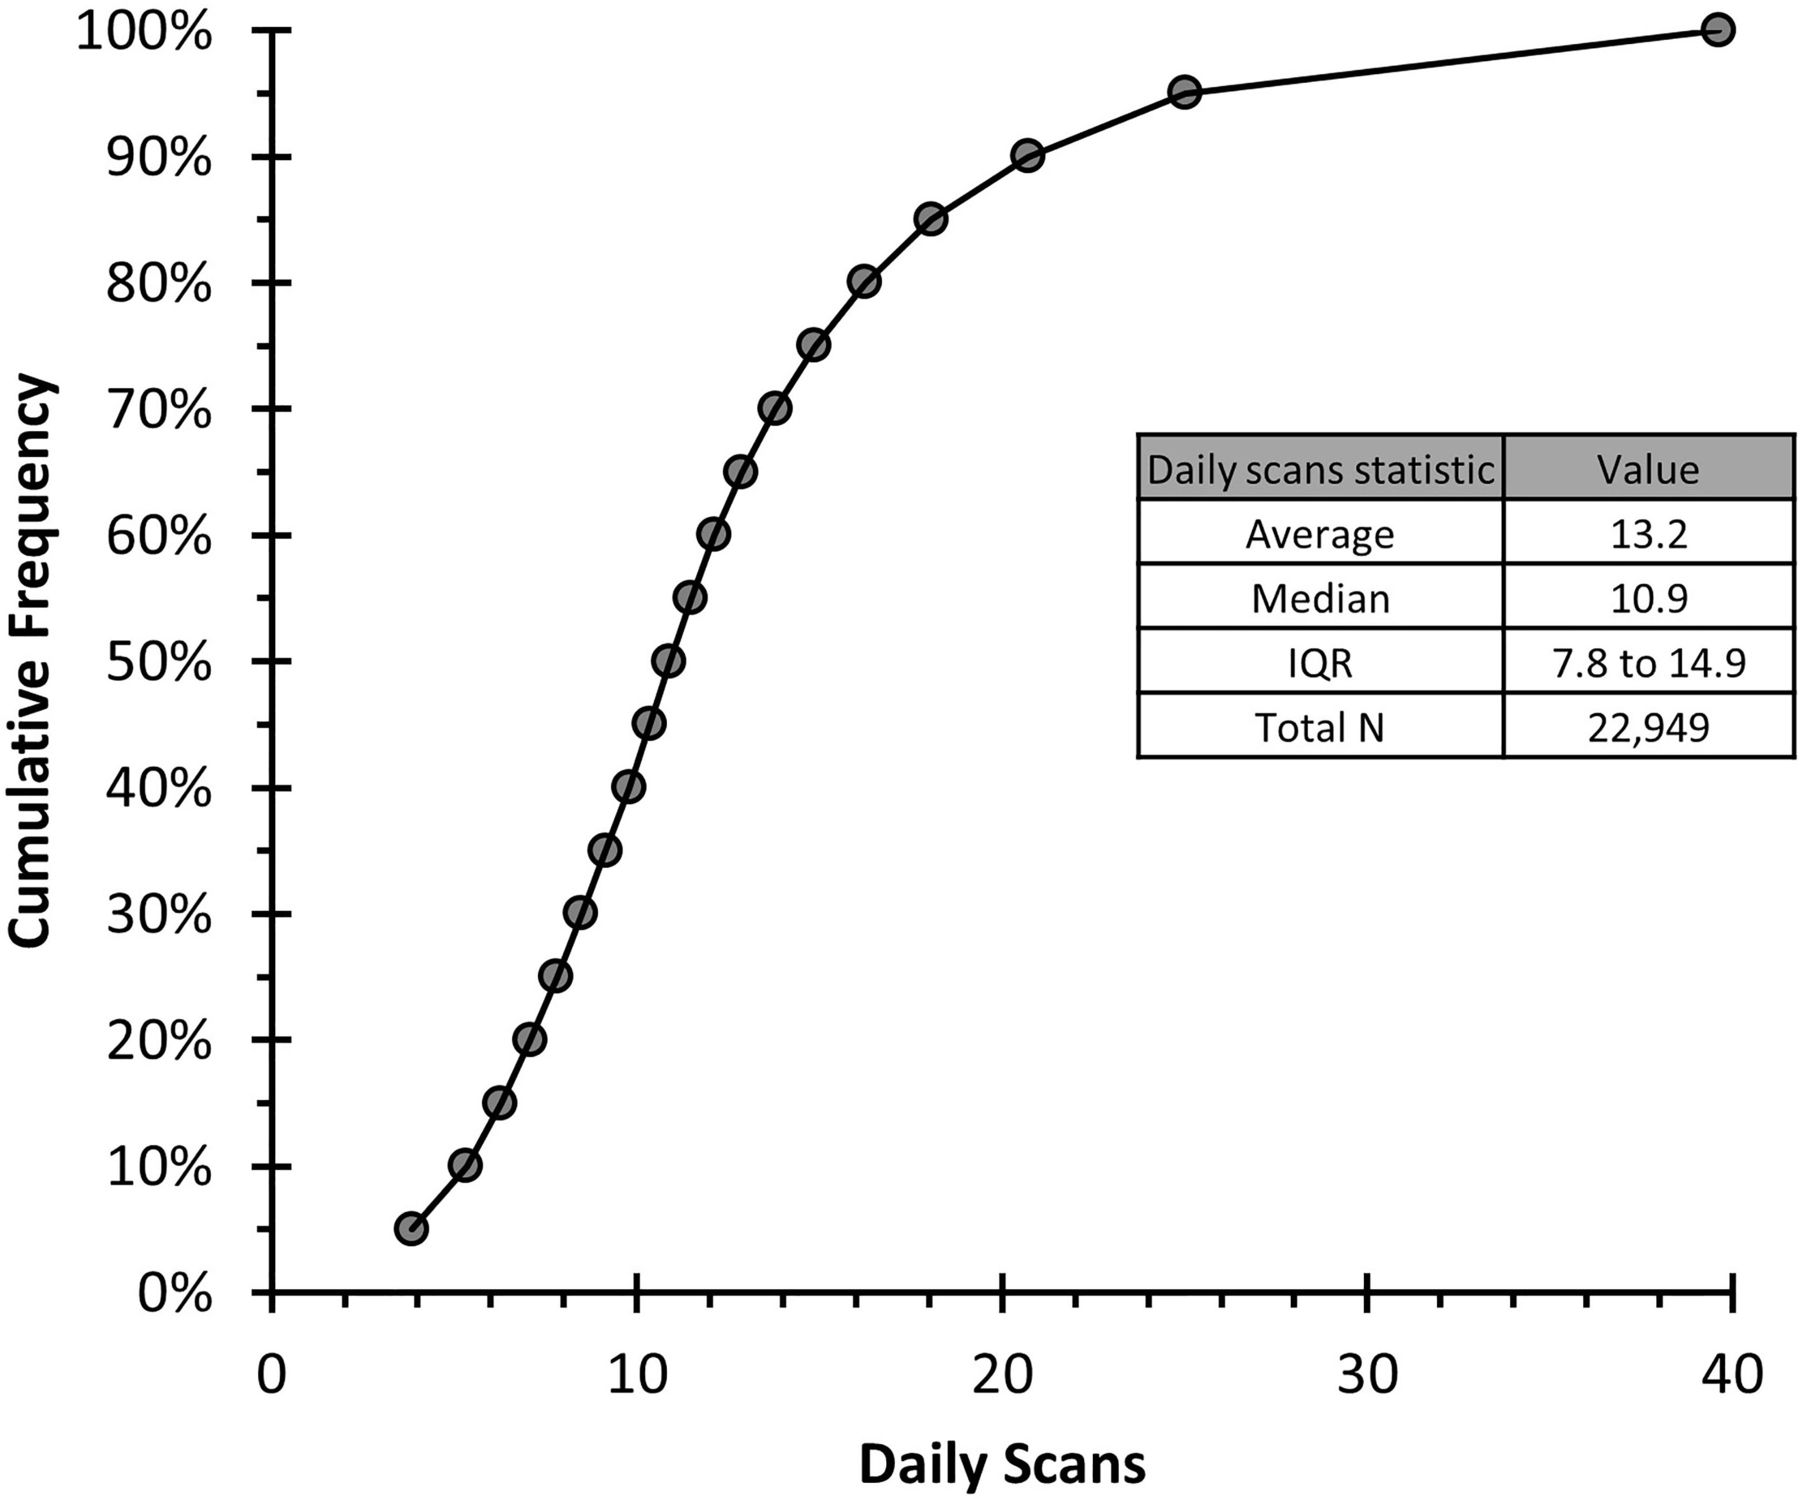
The Spanish data set had 22 949 readers with 207 386 sensors spanning 62.4 million monitoring hours (250 million automatically stored readings) and 37.1 million sensor scans. Reader users performed an average of 13 and a median (IQR) of 11 (8–15) daily glucose scans (figure 1). Scan rate per day, estimated HbA1c (%), time in hypoglycemia (min/day), TIR (hours/day), time in hyperglycemia (hours/day), and GV (SD (mg/dL) and CV (%)) are provided for each scan rate group in table 1.
Glucose control measures by scan rate group

Cumulative distribution of daily scans by readers. Each point represents 1147 or 5% of readers for a total of 37.1 million scans and 62.4 million monitoring hours.
Estimated HbA1c
Estimated HbA1c was significantly lower at 6.9% (95% CI 6.9% to 7.0%) in the highest scan rate group (39.6 scans/day) compared with 8.0% (95% CI 8.0% to 8.1%) in the lowest scan rate group (3.9 scans/day; p<0.001; figure 2A).
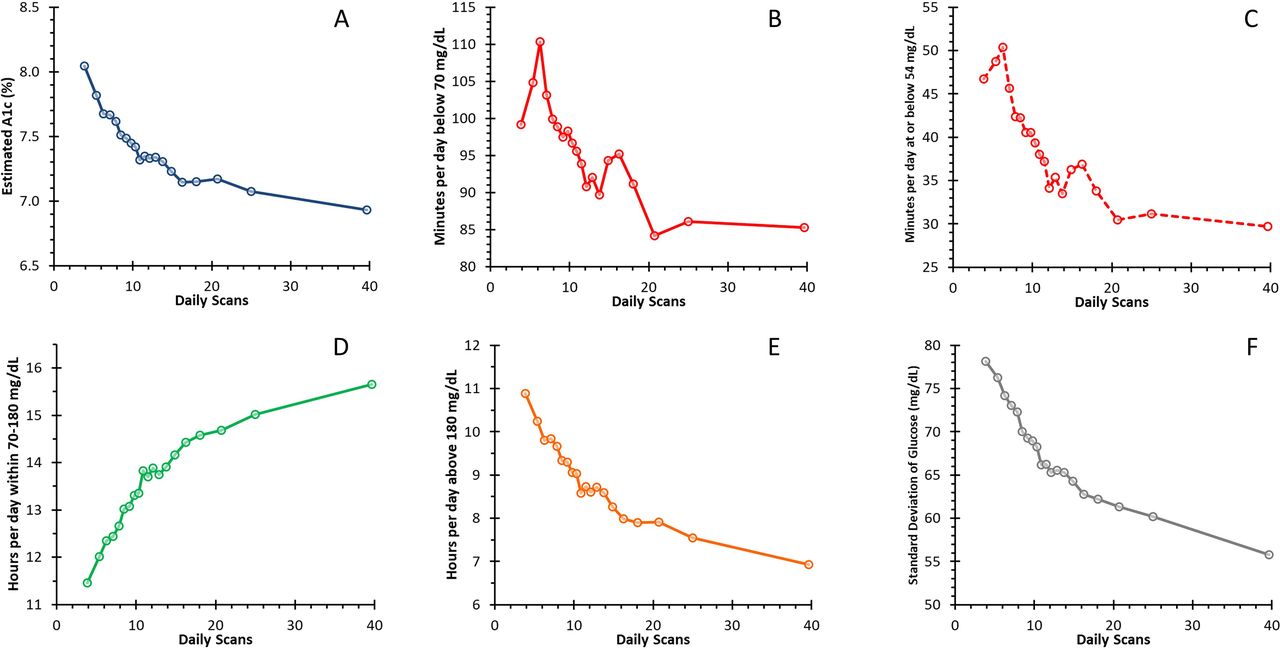
Relationship between frequency of daily scans and glucometrics. Estimated A1c (%, A), time in hypoglycemia (min/day below 70 mg/dL, B), time in hypoglycemia (min/day at or below 54 mg/dL, C), time-in-range (hours/day within 70–180 mg/dL, D), time in hyperglycemia (hours/day above 180 mg/dL, E), glycemic variability (glucose SD in mg/dL, F).
Time spent in hypoglycemia
Time spent in hypoglycemia was evaluated at two levels, <70 and ≤54 mg/dL, in accordance with recent guidance.32 Time in hypoglycemia,<70 mg/dL, decreased by 14% from 99.2 min/day (95% CI 93.9 to 104.4 min/day) in the lowest scan rate group to 85.3 min/day (95% CI 79.3 to 91.2 min/day) in the highest scan rate group (p<0.001, figure 2B).
Time in the more extreme case of hypoglycemia, ≤54 mg/dL, decreased by 37% from 46.8 min/day (95% CI 43.6 to 49.9 min/day) in the lowest scan rate group to 29.7 min/day (95% CI 26.6 to 32.8 min/day) in the highest scan rate group (p<0.001, figure 2C).
For both levels of hypoglycemia (<70 and ≤54 mg/dL), the longest amount of time spent in hypoglycemia was observed in the third lowest scan rate group: 110.4 min/day (95% CI 104.8 to 116.0 min/day) <70 mg/dL and 50.4 min/day (95% CI 46.9 to 53.8 min/day) ≤54 mg/dL. Time in hypoglycemia decreased by 23% (<70 mg/dL) and 41% (≤54 mg/dL) between the third lowest scan rate group and the highest scan rate group (p<0.001, figure 2B,C). There was no change in time spent in hypoglycemia between the three highest scan rate groups (p>0.001).
Time spent in euglycemia
TIR increased by 36% from 11.5 hours/day (95% CI 11.2 to 11.7 hours/day) in the lowest scan rate group to 15.6 hours/day (95% CI 15.4 to 15.9 hours/day) in the highest scan rate group (p<0.001, figure 2D).
Time spent in hyperglycemia
Time above 180 mg/dL decreased by 37% from 10.9 hours/day (95% CI 10.6 to 11.2 hours/day) in the lowest scan rate group to 6.9 hours/day (95% CI 6.7 to 7.2 hours/day) in the highest scan rate group (p<0.001, figure 2E).
Glycemic variability
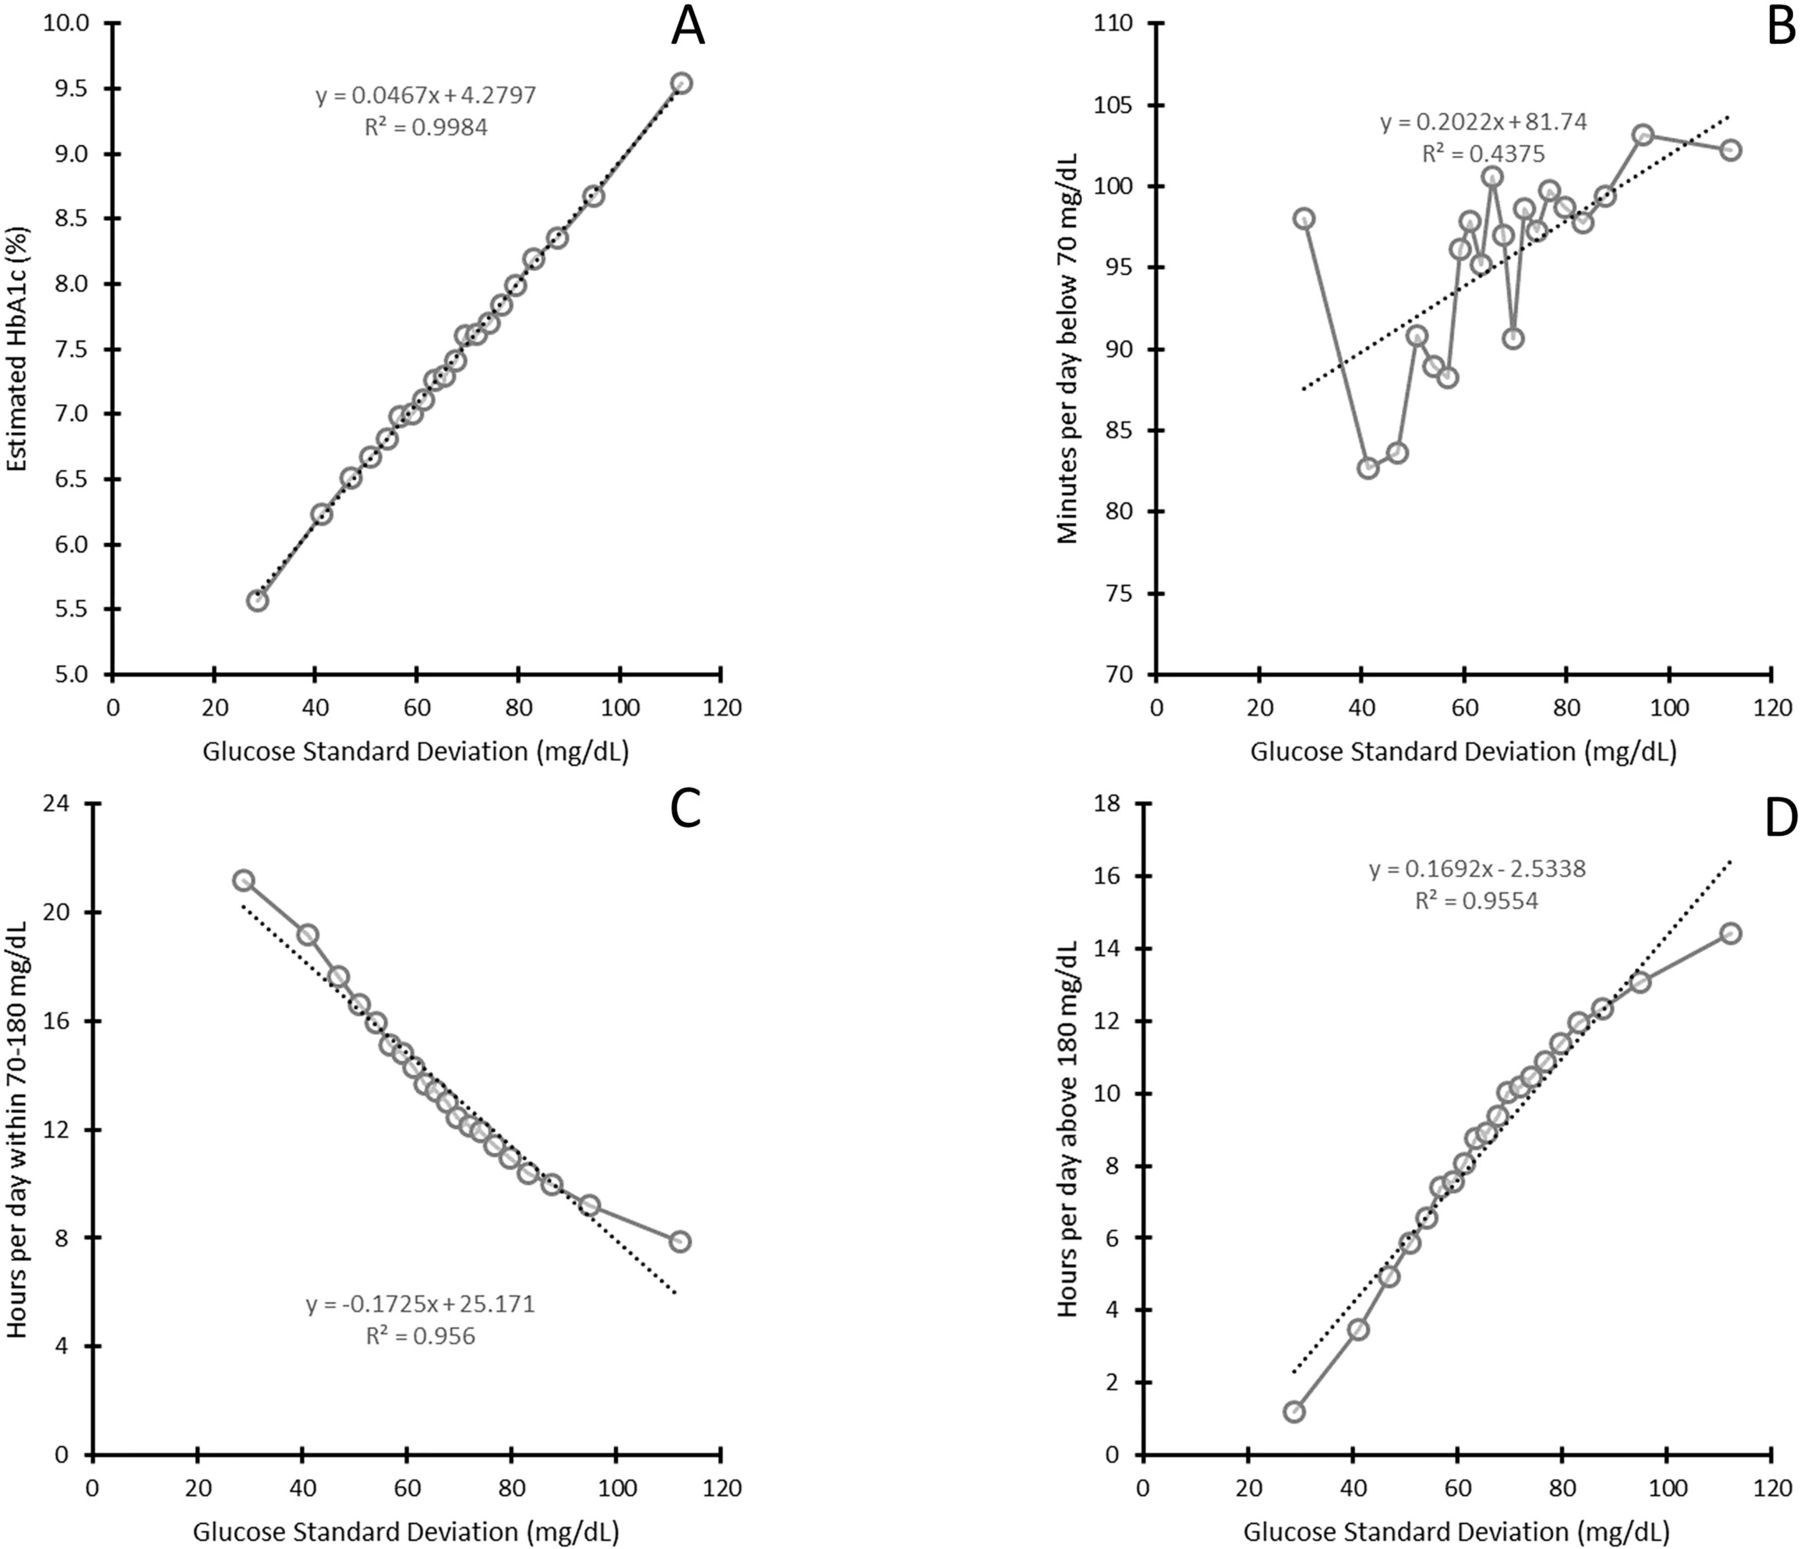
Glucose SD decreased by 28.7% from 78.2 mg/dL in the lowest scan rate group to 55.8 mg/dL in the highest scan rate group (p<0.001, figure 2F). Similarly, CV decreased by 13.5% from 42.2% in the lowest scan rate group to 36.5% in the highest scan rate group (p<0.001, table 1). When grouped by glucose SD, there was a strong positive correlation with estimated HbA1c (figure 3A), time in hypoglycemia (<70 mg/dL, figure 3B), and hyperglycemia (>180 mg/dL, figure 3D), and negative with TIR (figure 3C). Correlations of glucose SD with time in hypoglycemia (≤54 mg/dL) and glucose CV with glucose metrics are described in online supplementary figures 1 and 2, respectively. Similar observations were seen with correlations with glucose CV, however there were distinct non-linearities observed due to CV being a ratio of glucose mean and glucose SD.
Supplemental material

Correlation between glycemic variability (glucose SD) and glucometrics by 5% bins of rank-ordered glucose SD. Estimated HbA1c (%, A), time in hypoglycemia (min/day below 70 mg/dL, B), time-in-range (hours/day within 70–180 mg/dL, C), and time in hyperglycemia (hours/day above 180 mg/dL, D).
SMBG testing
A low average use of 0.66 test strips per day for SMBG, with an IQR of 0.16 (0.04–0.67) SMBG per day, was observed in this data set.
Comparison between Spanish and worldwide users
Figure 4, table 2, and online supplementary figure 3 describe the relationship between Spanish and worldwide glucometrics and scan frequency rate. The relationship was similar in Spain and worldwide. However, in Spain higher time in hypoglycemia was observed in the groups with lower scan rates and higher time in hyperglycemia was observed in the groups with higher scan rates. In addition, TIR was lower and GV was higher across all scan rates in Spain (p<0.001).
Spanish and worldwide scan frequencies and glucometrics

Spanish (solid line) and worldwide (dashed line) glucometric trends versus daily scans. Estimated HbA1c (%, A), time in hypoglycemia (min/day below 70 mg/dL, B), time in hypoglycemia (min/day at or below 54 mg/dL, C), time-in-range (hours/day within 70–180 mg/dL, D), time in hyperglycemia (hours/day above 180 mg/dL, E) and glucose SD (mg/dL, F). Mean values, error bars are 99.9% CIs.
Conclusions
Flash glucose monitoring has been shown to improve glycemic control in both type 1 and type 2 diabetes.24–27 However, the correct use of information offered by these systems is key to maximizing the possible benefits in real-world life conditions. The aim of this study was to establish a Spain-specific relationship between testing frequency and glycemic parameters and to demonstrate flash glucose monitoring associations with glycemic control under real-world settings. A temporal analysis of real-world flash glucose monitoring data has been performed previously.23
The same positive correlation between high-frequency scanning and improved glycemic control was observed in the Spanish and global data sets. Additionally, a clear positive correlation was demonstrated between GV and estimated HbA1c; time in hypoglycemia and hyperglycemia. These results underline the importance of GV reduction as a central mechanism for glucose control improvement by CGM use in a real-world setting.
Although similarly correlated, the magnitude of the relationship between hypoglycemia, TIR, hyperglycemia, GV, and scan rate was unique to the Spanish (vs global) data. Particularly, GV was higher across all scan rates in Spain, and consequently, TIR was lower. Time in hypoglycemia in the lower scan rate groups, and hyperglycemia in the higher scan rate groups as well. These differences in glucometrics at the same scan rate seem to describe a different user profile. From a clinical point of view, the higher GV across all scan rates could explain associations seen in the other glucose metrics, and would indicate a trend towards more complex patients in Spain. The particular characteristics of the market and reimbursement policy in Spain when the data were obtained could be a driver for the selection of users. The flash glucose monitoring system was initially reimbursed during the last months of the period studied, only in some regions, and limited to children with type 1 diabetes under 18 years of age. In contrast, the flash monitoring system during this time had full or partial reimbursement in 33 countries for both adults and children, typically for those requiring multiple daily injections of insulin. We can speculate that in a mostly subsidized market, the majority of paid out-of-pocket use would be by patients with poor blood glucose control or patients at a high risk for hypoglycemia, understanding that hypoglycemia risk reduction can be seen as the most valuable benefit from CGM. The worldwide data were predominantly obtained from countries with broader reimbursed access for a longer period of time. These results, besides the extremely low SMBG use when CGM is initiated, support a broader replacement of SMBG in patients with less complex diabetes mellitus. Patient education may be beneficial in countries like Spain to optimize the advantages of flash glucose monitoring. Additional healthcare resources would be required to robustly provide this support.
Observational studies have demonstrated an association between GV and mortality in patients with diabetes33 and CGM-defined GV has recently been associated with microangiopathic and neuropathic diabetic complications, independent of mean glucose concentrations.34 35 The most strongly supported clinical consequence of GV is increased risk of hypoglycemia36 37 and our results confirm this clinically relevant association. It is very appropriate to remind that HbA1c is not able to describe GV.38 Further, SMBG in real-life conditions has a limited potential to assess GV due to the low number of measurements usually available.19
In agreement with previously published data,22 no further decrease in minutes spent in hypoglycemia after the third highest scan rate group (for both <70 and ≤54 mg/dL) was observed. There was virtually no reduction in time in hypoglycemia and minimal changes in estimated HbA1c and TIR over 20 scans per day. Further research is needed to gain insights on how glucose levels and trends can be integrated into the daily life of patients with diabetes in a safe and non-alienating way. Moreover, this observation can be a call to avoid obsessive use of CGM.
A low average use of 0.66 test strips per day for SMBG was observed in this data set, similar to observations made previously in clinical trials.24–27 This finding supports that flash glucose monitoring is cost-effective for patients in countries like Spain.39
The major strengths of this study include real-life settings, large sample size and unrestricted inclusion criteria. There are also a number of limitations that should be noted. First, basic patient characteristics (eg, age, clinical parameters, diabetes type, disease duration, gender) are not known. Additional characteristics (eg, education, employment, socioeconomic status) are also not known. Details around diabetes management self-efficacy markers and methods, and access to diabetes counseling and behavior support are also unavailable. Thus, data analysis for these pertinent subgroups was not possible. Second, there may be a selection bias towards patients who are more motivated to improve their glycemic control based on unknown factors (eg, age, disease status, education, employment, socioeconomic status) as the flash monitoring device was likely self-funded by most users for the majority of the study. This study did not investigate long-term complications that may be associated with using this monitoring strategy nor did it assess potential health economic impacts. These evaluations are beyond the scope of the study. Lastly, unique features of the device (eg, arrow trend and 8-hour glucose history displayed by the reader) may have contributed to the improved glycemic outcomes observed in this study. Incorporation of these features into diabetes self-care and clinician-guided therapy adjustments warrants further investigation. Despite these limitations, this study offers a detailed analysis of flash glucose monitoring and the significant clinical benefits observed in patients who attend more frequently to their glucose levels in Spain. Future investigations are still required to understand the impact of flash glucose monitoring on changing patient behavior (eg, diet, exercise, adherence to therapy) and improving their ability to make self-management decisions with insulin treatment.
This analysis of Spain-specific flash glucose monitoring in real-world clinical practice over 52 months illustrates a strong correlation between glucose scan frequency and improved glycemic markers. GV, times spent in hypoglycemia and hyperglycemia are reduced while TIR is increased with increased scan rates using the FreeStyle Libre device.
A strong positive correlation between high-frequency scanning and improved glycemic control was observed in the Spanish data, similar to observations made previously in global data. Although similarly correlated, the magnitude of the relationship between hypoglycemia and scan rate was unique to the Spanish (vs global) data. Additionally, the impact of increased scanning on TIR and hyperglycemia in high scan rate groups was unique to the Spanish data. Thus, the FreeStyle Libre device is, under real-world settings, a powerful glucose monitoring strategy to improve glycemia in patients with diabetes.
References
Footnotes
Contributors FGP, TD, KL, YX, and JFMT designed the study. KL, TD and YX performed the data analysis. FGP, TD, KL, YX, and JFMT all critically reviewed the manuscript and provided intellectual content and feedback. All authors reviewed the manuscript before submission. FGP is the guarantor of the study and takes responsibility for the content of the article.
Funding This work was funded by Abbott Diabetes Care.
Competing interests TD and YX are employees of Abbott Diabetes Care. KL is an employee of Abbott Diagnostics. FGP has taken part in advisory panels for Abbott Diabetes, Novartis, AstraZeneca, Sanofi and Novo Nordisk; has participated as principal investigator in clinical trials funded by Sanofi, Novo Nordisk, Boehringer Ingelheim Pharmaceuticals, and Lilly; and has acted as a speaker for Abbott Diabetes, Novartis, Sanofi, Novo Nordisk, Boehringer Ingelheim Pharmaceuticals, AstraZeneca Pharmaceuticals, Bristol-Myers Squibb, and Lilly. JFMT has participated as principal investigator in clinical trials funded by: GlaxoSmithKline, Lilly, Novartis, Novo Nordisk, Pfizer, Sanofi-Aventis, Bristol-Myers Squibb, AstraZeneca; has received conference funding from GlaxoSmithKline, Lilly, Merck-Sharp-Dohme, Novartis, Novo Nordisk, Pfizer, Sanofi-Aventis, Menarini, Janssen, Abbott, Kabi-Fresenius, Nutricia; and has collaborated as a consultant with Abbott, AstraZeneca, Esteve, GlaxoSmithKline, Lilly, Novo Nordisk, Novartis, Merck-Sharp-Dohme, Rovi, and Sanofi-Aventis.
Patient consent for publication Not required.
Provenance and peer review Not commissioned; externally peer reviewed.
Data availability statement Data are available upon reasonable request.