Article Text

Abstract
Objective Medication adherence plays a key role in type 2 diabetes (T2D) care. Identifying patients with high risks of non-compliance helps individualized management, especially for China, where medical resources are relatively insufficient. However, models with good predictive capabilities have not been studied. This study aims to assess multiple machine learning algorithms and screen out a model that can be used to predict patients’ non-adherence risks.
Methods A real-world registration study was conducted at Sichuan Provincial People’s Hospital from 1 April 2018 to 30 March 2019. Data of patients with T2D on demographics, disease and treatment, diet and exercise, mental status, and treatment adherence were obtained by face-to-face questionnaires. The medication possession ratio was used to evaluate patients’ medication adherence status. Fourteen machine learning algorithms were applied for modeling, including Bayesian network, Neural Net, support vector machine, and so on, and balanced sampling, data imputation, binning, and methods of feature selection were evaluated by the area under the receiver operating characteristic curve (AUC). We use two-way cross-validation to ensure the accuracy of model evaluation, and we performed a posteriori test on the sample size based on the trend of AUC as the sample size increase.
Results A total of 401 patients out of 630 candidates were investigated, of which 85 were evaluated as poor adherence (21.20%). A total of 16 variables were selected as potential variables for modeling, and 300 models were built based on 30 machine learning algorithms. Among these algorithms, the AUC of the best capable one was 0.866±0.082. Imputing, oversampling and larger sample size will help improve predictive ability.
Conclusions An accurate and sensitive adherence prediction model based on real-world registration data was established after evaluating data filling, balanced sampling, and so on, which may provide a technical tool for individualized diabetes care.
- adherence
- type 2 diabetes
- prediction and prevention
- personality
This is an open access article distributed in accordance with the Creative Commons Attribution 4.0 Unported (CC BY 4.0) license, which permits others to copy, redistribute, remix, transform and build upon this work for any purpose, provided the original work is properly cited, a link to the licence is given, and indication of whether changes were made. See: https://creativecommons.org/licenses/by/4.0/.
Statistics from Altmetric.com
Significance of this study
What is already known about this subject?
Medication adherence is a key to diabetes care.
Proper care can help improve medication adherence.
What are the new findings?
The newly developed model has a good performance to predict the risk of non-medication adherence in diabetics.
How might these results change the focus of research or clinical practice?
This model can be used to filter patients with high risk of non-medication adherence and precise educational interventions can be conducted.
Introduction
Type 2 diabetes (T2D), one of the most popular disorders all over the world,1 is a chronic condition that requires long-term treatment to improve life quality and reduce the probability of related disability and death.2–4 Studies have confirmed that good medication adherence is important for patients with T2D to improve glycemic control, avoid complications, and reduce overall health expenditure.5 6 Interventions such as integrative health coaching can significantly improve medication adherence.7–9 Considering the large crowd and complex features of patients with T2D, identifying high-risk groups with poor medication adherence and carrying out precise educational interventions are feasible measures to improve the overall disease control.
Studies found that numerous factors may be associated with medication adherence in patients with T2D, including the duration of the disease, mental state, anxiety, depression, irritability, smoking, cost, and so on.5 10 11 These factors vary with study designs and regions. That may be resulted from the differences in the selection of variables, patients’ income levels, education levels, cultural characteristics, living habits, and so on. Therefore, it is necessary to explore the main influencing factors of local patients’ medication compliance and to establish a model that can accurately predict therapeutic compliance in specific regions.12 13 Despite several compliance-related predictive models that have been reported recently in patients with tuberculosis14 and heart failure,15 studies on patients with T2D based on multivariate machine learning algorithms have not been retrieved.
In this study, a rigorous and comprehensive questionnaire survey was conducted and dozens of machine learning-based models were built and assessed. In addition, we also examined the impacts of data preprocessing, modeling methods and different sample sizes on prediction performance.
Research design and methods
Study design, study area, and participants
A survey was conducted in the outpatient clinic of Sichuan Provincial People’s Hospital from April 2018 to March 2019. The hospital mainly serves patients from Sichuan Province, a populous province in southwestern China. A total of 630 patients were approached, and 401 completed the survey. Researchers conducted a face-to-face questionnaire survey and filled out questionnaires according to the answers from the patients who participated in the survey.
Patients with T2D were selected according to the criteria: (1) examined HbA1c on the day of the questionnaire, and (2) willing to take part in the survey and to provide information to the investigators. Patients were eliminated if he or she (1) was a non-T2D patient, (2) did not receive hypoglycemic agency treatment, (3) less than 18 years old, and (4) with a short life expectancy.
Data collection
The data in this study were collected from electronic medical records (EMR) and face-to-face questionnaires. Clinical laboratory results were collected according to EMRs. The results of the previous examination and the duration from the last test were recalled by patients and, if necessary, confirmed by telephone after they returned home.
Questionnaires
The questionnaire consists of five parts. The first part is about basic characteristics, including age, gender, occupation, family history, and so on. The second part is involved in the information related to diabetes, including self-glycemic monitoring, diabetes course, medication regimen, duration of medication regimen, the test results of HbA1c and blood glucose at the time of the questionnaire. The third part is referred to the other clinical information, including the use of Chinese traditional medicine products, surgical histories, comorbidities, and concomitant medications. The fourth part is about exercise, diet, and mental state. The last part is information related to adherence, in which we recorded how many medications should be taken, how many were prescribed and how many were left. The adherence status, the medication possession ratio (the proportion of medication’s available days, higher than 80% is regarded as good medication compliance16 17), was determined as the target variable.
Data blindness
All variable names were encoded to X1–X44 to achieve statistical blindness in this study. Data analysis was performed using the encoded variable names. The variables were unblinded after the model evaluation processes.
Data cleaning
Variables with more than 50% missing or a certain category’s proportion greater than 80% were excluded. The maximum likelihood ratio method was used to assess the correlations between the input variables and the target variable. Variables with p value >0.1 were considered unimportant and were excluded after the likelihood ratio test. Data filling was performed using mean value (for numerical variables), median (for ordinal variables) or mode (for nominal variables).18 Outlier values were modified as the maximum or minimum of normalized values.
Because of the proportional imbalance between good and non-adherence patients, sampling methods, including oversampling (four times for patients with poor compliance) and undersampling (50% for patients with good adherence), were taken to make up the shortage caused by the imbalanced sample size between the different levels of the target variable. Unbalanced data were analyzed simultaneously to evaluate the risk of overfitting on account of balancing dispose.
Data partition
There were two data partitioning processes in this study for two-way cross-validation. The first was conducted before data cleaning. In this process, the original data were randomly divided into two subsets (named set 1 and set 2) in a ratio of 8:2, which would be used for model establishment and verification, respectively. During the second partition, set 1 was divided into a training set and a testing set by 7:3 after data cleaning. The training set would be used to build machine learning models, and the testing set would be used to evaluate the fitting effectiveness of the models.
Variable selection
The forward, backward and stepwise methods of logistic regression were used to screen significant variables. The continuous variables were grouped (or not) according to the IQR, in which process was named binning, aimed to facilitate interpretation.
Model validation
The predictive performances of the models were evaluated by the area under the receiver operating characteristic curve (AUC). AUC of every data set (training set of set 1, testing set of set 1, and set 2) was calculated to examine the sensitivity and specificity of models. Due to oversampling dispose, a number of duplicate records would be generated, which means some records might be used both to build the models and to validate the models, and cause the risk of overly optimistic estimation of the models’ prediction effects. So, AUC of set 2, which was partitioned before oversampling, would be used as the best model evaluation indicator. The overfitting risks of the models were assessed by OF1, which was calculated using the formula: AUCSet 1 training set/AUCSet 1 testing set, and OF2, AUCSet 1 testing set/AUCSet 2. Higher levels of OF1 and OF2 indicate more serious overfitting risks. Tenfold independent repeated values of the above indexes were generated by changing the random seed number in the first data partition process 10 times.
Model building
More than a dozen classification algorithms were applied and assessed in this study. The proposed models included C 5.0 model (marked as $C), logistic regression model (marked as $L), decision list, Bayesian network (marked as $B), discriminant model (marked as $D), KNN algorithm (marked as $KNN), LSVM, random forest, SVM (marked as $S), Tree-AS, CHAID (marked as $R), Quest, C&R Tree (marked as $R), Neural Net (marked as $N), and the ensemble model (marked as $XF). The ensemble models would summarize the output of the best five models (assessed by AUC) and generate their outputs according to the voting principle.
Sample size assessment
The model with the largest AUC was selected, and 10 subsets, 10%–100% in a step of 10% of the total sample size randomly extracted, were used to build models in order to evaluate the influence of different sample sizes on the predictive ability. Every subset was divided into a training set and a testing set by 7:3 and the AUC calculated from the testing set was used for sample size examination. Ten independent replicate results were generated for each model by transforming random sampling seeds.
Statistical description and hypothesis testing
Continuous variables were expressed as mean±SD and counting variables were expressed in terms of frequency. Student’s t-test and signed-rank tests were used to test the difference between paired quantitative data. T-test and general linear models for analysis of variance were used as parameter test approaches. Non-parametric tests were implemented in Wilcoxon rank-sum analysis and Kruskal-Wallis test. If the data were normally distributed and the variances were equal, an appropriate parameter test was used, otherwise, a non-parametric test was used to realize hypothesis testing. Spearman correlation analysis was used as correlation analysis approach between two continuous variables. Multiple linear regression was used for multivariate analysis, and during which process variance inflation factor and standardized estimate (SE) were used to assess the multicollinearity risk and the weight of the affecting to the dependent variable.
Excel 2016 was used to summarize the data. Data cleaning and modeling were completed using IBM SPSS Modeler V.18.0 software. Variable screening, hypothesis testing, and regression analysis were performed using SAS V.9.21 (SAS Institute). The figure in the sample size verification section was plotted using Prism for Windows 6 software (GraphPad Software).
Results
Respondent population
A total of 401 patients out of 630 candidates completed the survey, among which 244 were male and 157 were female. The mean age was 58.9±12.2 years. Eighty-five patients were defined as poor medication adherence (21.20%). For detailed patients’ characteristics see table 1. The rate of data missing was 10.67% and the main reasons were the missing of patients’ memory or that the respondents were not willing to provide certain information.
Demographic and clinical data of participants
Data stream
A process framework of the data flow is shown in figure 1. Data flow through each node according to a predetermined schedule.
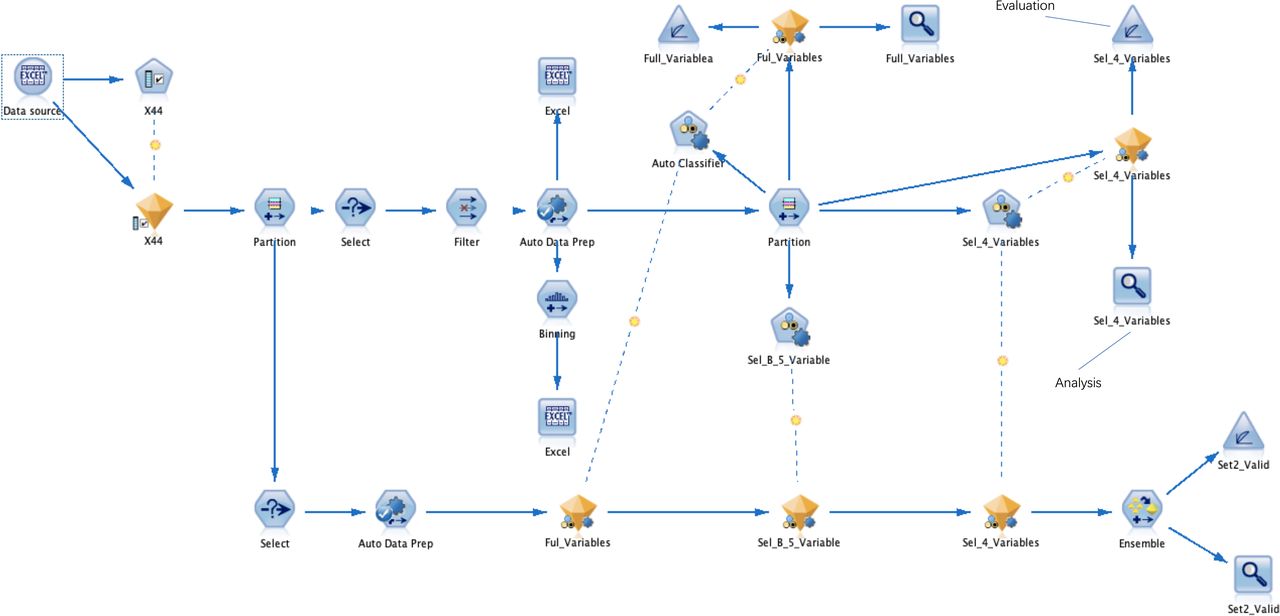
The data flowed into the ‘Partition’ node after feature selection. The ‘Auto Data Prep’ node was used for data filling, the ‘Balance’ node performed a data balanced sampling process, and the ‘Binning’ node was applied for data binning. The ‘Partition’ node divided set 1 into a training set and a testing set, used the ‘Auto Classifier’ node to build various classification models, and used the ‘Analysis’ and ‘Evaluation’ nodes to output the AUC values and curve figure of each model. Use the ‘Select’ node to select the ‘Set 2’ data set. The set 2 set was concatenated with the models established above and the ensemble model of them, and the AUC values and graphs of all models were output using the ‘Analysis’ and ‘Evaluation’ nodes. AUC, area under the receiver operating characteristic curve.
Feature selection
Three variables were excluded due to too many missing values. Four variables were excluded because the proportion of certain categories was too large, and 18 variables were excluded because of the low correlation with the target variable. Thereby, a total of 16 variables were used for modeling, including the last HbA1c value, fasting glucose, age, diet adjustment or not, weight, cost of hypoglycemic drugs, duration of current treatment regimen, body mass index (BMI), working status, the duration since the prior blood glucose test, dyslipidemia, and so on.
Model establishment and evaluation
In this study, 300 machine learning models were developed based on 30 algorithms varying from whether imputing or not, sampling methods (unbalanced, oversampling and undersampling) and variable screening methods (forward, backward and stepwise). By changing the seed value when data partition, each modeling algorithm would be built and tested using 10 separate training and testing data sets, and generate 10 models. Consequently, we got 10 independent duplicates for each modeling algorithm. AUC and overfitting values for 30 machine learning modeling algorithms were shown in table 2. Among 30 modeling algorithms, the minimum and maximum of AUC in set 2 were 0.557 (SD 0.051) and 0.866 (SD 0.082), respectively. The best algorithm was an ensemble one from five models that used oversampling for data balance after data imputing, and without data binning (table 3). Nine variables were used to build this model, which were age, gender, whether the prior fasting blood glucose was under control, duration of the current treatment regimen, diet adjustment or not, the daily cost of medications, fasting blood glucose value, hyperlipidemia and BMI after the backward variable selection process.
AUC and overfitting values for 30 machine learning models
Assessment of models by different algorithms of the selected data governance
Supplemental material
Overfitting risk of the models
OF1 and OF2 were used to evaluate the overfitting risk of the model. The overall OF1 value was 1.028±0.113, and its difference from 1 was statistically significant (Student’s t-test, p<0.0001). The OF2 value was 1.015±0.165, and no significant difference was observed between OF2 and 1 (signed-rank test, p=0.6268). Despite the statistical differences between OF1 and 1, we believe that the overfitting risks of all models were negligible because their mean values were very close to 1, and their differences between 1 were Gaussian distributed and SD values were small (which means few variances).
Impact of modeling methods on predictive performance
The impacts of algorithms on predictive performance are shown in table 4. Data imputing can significantly improve the AUC of set 2 (imputing, 0.770±0.096 vs not imputing, 0.694±0.106). Oversampling and undersampling will help get a better AUC (oversampling, 0.806±0.107 and undersampling, 0.718±0.069 vs not sampling, 0.671±0.097). As the number of variables and samples increases, the prediction performances of the models were significantly improved. In addition, different predictive powers were shown among various methods.
The impact of modeling approaches on predictive indicators
Multilinear regression analysis showed that variable screening methods, algorithms, number of variables and sample size will affect the AUC of set 2 remarkably. The factor ‘sample size’ had the strongest impact on AUC of set 2 according to SE value (see table 3).
Sample size assessment
As the size of sample data incorporated into the model from small to large, the AUC values of the testing sets continued to increase. When the sample size is extremely small (less than or equal to 30%), the SDs of AUC are large, and the values show significant discrete distribution trends. As the sample size increases, the above situation is alleviated.
Discussion
The development of patient’s medication adherence predictive models facilitates individualized diabetes education and care.19 20 In our research, 30 machine learning-based modeling algorithms were developed for adherence prediction, which at most 16 variables were used to build the model. After examining data filling, sampling, binning, and variable screening methods, the best algorithm, whose mean AUC was 0.866±0.082, was selected. The model was validated by sensitivity, specificity, and overfitting risk, and excellent predictive capability was shown to identify non-adherence patients.
Although studies related to medication adherence predictive models are found in tuberculosis14 and heart failure,15 few studies have been retrieved that established and examined the predictive models in patients with type 2 diabetes mellitus (T2DM), for whom medication adherence is a key factor to treatment outcomes.5 21 22 Kumamaru H et al23 established a logistic regression model for the prediction of future drug compliance. In their study, the patient’s current drug dependence characteristic played the role of the main predictor. Data from 90 000 patients were analyzed in the study. However, the AUC of their model was 0.666 (95% CI 0.661 to 0.671), which was smaller than ours (0.866±0.082). That may be because they focused on patients newly initiating statins, used retrospective data and evaluated fewer variables while we focused on a smaller population (patients with T2DM), conducted a prospective study and examined more targeted variables.
The proportion of patients with good adherence in this study is 78.8%, which is comparable to data from Ethiopia24 (70.5%), the USA25 (70.0%) and white patients who were newly prescribed diabetes medications26 (62.5%). A systematic review showed that the rate of adherence to oral hypoglycemic agents ranged from 36%–93% and 62%–64% to insulin in patients with T2DM.27 Twenty-seven percent of Palestine refugees who have diabetes living in Jordan were not adherent to their regimens.28 Many variables are reportedly considered to be related to patient medication compliance such as gender, dyslipidemia, medication, and so on.29 30 To our knowledge, this study is the first to examine the factors and develop predictive models based on the factors such as the duration of the current medication regimen, whether the last fasting blood glucose was under control, and whether a reasonable diet plan had been implemented.
Data filling is an important way to solve data loss problems that frequently appear in real-world studies. Every record needs a value for each variable during the multivariate analysis process in spite of missing data are inevitable in real-world data sets. Deleting the entire patient’s record due to small parts of data missing will result in a large amount of information loss. It could be necessary to delete the variables and records under severe missing circumstances (eg, more than 70% of data missing) to reduce noise in the whole data. However, there is still no consensus about whether the absence of the remaining data should be filled or how to perform effective data padding. Several studies have reported interpolation methods under the situation of data missing.31–33 Specially, multiple imputation (MI) methods are a wonderful approach to handle data missing issues for the consideration of the imputation uncertainty.34 MI generates m data sets, obtains results from each data set and combines m results at the last step. In this study, 300 models were built by using one data set and one algorithm was selected for use. We have not figured out how to combine m×300 models and find one algorithm out. So we used simple imputation here. The results of our study showed that the predictive abilities of moles were significantly improved (p<0.0001) after data filling. Univariate and multivariate analyses also showed that the increase in the available sample size would significantly enhance the models’ predictive performances which maybe also partly due to data imputation.
Undersampling and oversampling are the main methods used to solve the issues that result from sample imbalance which also frequently happen in medical-related research data,35 such as the occurrence of adverse reactions and non-adverse reactions.36 Undersampling reduces the number of samples at the level of more samples while oversampling increases the number of samples at the level of fewer samples. Overestimation of AUC may occur on account of oversampling because of the existence of a large number of duplicate samples and some records are used to test the model after being used to train the model. Therefore, in this study, the data partitioning process was designed twice to produce a non-repeating set of verification samples, which is set 2, in order to ensure the credibility of the results. In addition, this study shows that oversampling is a key measure to improve predictive sensitivity and specificity (p<0.0001).
Strengths and limitations
There are several innovations in this study. First, we are more focused on collecting and evaluating variables that may be relevant to medication compliance in the real-world environment, which may increase the prediction accuracy of the model based on a limited sample size. Second, the model with the best prediction effect was found based on as many as 300 models built according to a variety of data processing methods and ten times randomly partitioning of data. Finally, we have innovatively tried a sample size posterior verification method based on the relative relationship between sample size and AUC, which can provide a reference for sample size analysis of predictive studies. However, limitations also exist in this study. First, in the sample size verification results, there is no inflection point in the AUC curve as the sample size increases, indicating that there is still a need for a further increase in the sample size. The second one is that we need to work with more centers to collect more data to optimize the model and verify the applicability of the model in healthcare facilities. Lastly, although we classified the patients’ last test results to reduce accuracy, for some variables, recall bias still exists.
Conclusion
In Sichuan Province, the southwest region of China, 21.20% of patients with T2D were not adherent to their medication regimens. The duration of the current medication regimen, former blood glucose level, and eating habits can be key factors in predicting patient medication compliance. By performing data padding when the data have a small number of missing values, balanced sampling in the imbalanced data, and model training using a variety of algorithms, the better predictive models will be obtained. After establishing and evaluating a large number of models, we got a predictive model with potential clinical value for preventing non-adherence risks of patients with T2D.
Supplemental material
References
Footnotes
Presented at This article has been displayed in the conference of ISPOR 2019 as a poster presentation, the 2019 Chinese Conference on Pharmacoepidemiology and the 9th International Graduate Student Symposium on Pharmaceutical Sciences as oral presentations. In addition, this article has won the Second Prize of Thesis in the 9th International Graduate Student Symposium on Pharmaceutical Sciences, and the Third Prize of Thesis in the Annual Congress of Chinese Clinical Pharmacy and the 15th Chinese Clinical Pharmacist Forum.
Contributors XWW was involved in the conception, questionnaire design, model design, write-up and editing and approval of the final manuscript. HBY, EWL and RY were involved in face-to-face questionnaire. RST was responsible for revising the research.
Funding This study was funded by the Key Research and Development Program of Science and Technology Department of Sichuan Province (2019YFS0514), the Postgraduate Research and Teaching Reform Project of the University of Electronic Science and Technology of China (JYJG201919) and the Research Subject of Health Commission of Sichuan Province (19PJ262).
Competing interests None declared.
Patient consent for publication Not required.
Ethics approval The study was approved by the Medical Ethics Committee of the Affiliated Hospital of the University of Electronic Science and Technology and Sichuan Provincial People’s Hospital.
Provenance and peer review Not commissioned; externally peer reviewed.
Data availability statement Data are available upon reasonable request. Our data can only be available with the consent of the corresponding author.