Article Text

Abstract
Introduction Hyperglucagonemia is a key pathophysiological driver of type 2 diabetes. Although Roux-en-Y gastric bypass (RYGB) is a highly effective treatment for diabetes, it is presently unclear how surgery alters glucagon physiology. The aim of this study was to characterize the behavior of proglucagon-derived peptide (glucagon, glucagon-like peptide-1 (GLP-1), oxyntomodulin, glicentin) secretion after RYGB surgery.
Research design and methods Prospective study of 19 patients with obesity and pre-diabetes/diabetes undergoing RYGB. We assessed the glucose, insulin, GLP-1, glucose-dependent insulinotropic peptide (GIP), oxyntomodulin, glicentin and glucagon responses to a mixed-meal test (MMT) before and 1, 3 and 12 months after surgery. Glucagon was measured using a Mercodia glucagon ELISA using the ‘Alternative’ improved specificity protocol, which was validated against a reference liquid chromatography combined with mass spectrometry method.
Results After RYGB, there were early improvements in fasting glucose and glucose tolerance and the insulin response to MMT was accelerated and amplified, in parallel to significant increases in postprandial GLP-1, oxyntomodulin and glicentin secretion. There was a significant decrease in fasting glucagon levels at the later time points of 3 and 12 months after surgery. Glucagon was secreted in response to the MMT preoperatively and postoperatively in all patients and there was no significant change in this postprandial secretion. There was no significant change in GIP secretion.
Conclusions There is a clear difference in the dynamics of secretion of proglucagon peptides after RYGB. The reduction in fasting glucagon secretion may be one of the mechanisms driving later improvements in glycemia after RYGB.
Trial registration number NCT01945840.
- glucagon
- glucagon-like peptide-1 (GLP-1)
- obesity
- bariatric surgery
This is an open access article distributed in accordance with the Creative Commons Attribution Non Commercial (CC BY-NC 4.0) license, which permits others to distribute, remix, adapt, build upon this work non-commercially, and license their derivative works on different terms, provided the original work is properly cited, appropriate credit is given, any changes made indicated, and the use is non-commercial. See: http://creativecommons.org/licenses/by-nc/4.0/.
Statistics from Altmetric.com
Significance of this study
What is already known about this subject?
Roux-en-Y gastric bypass (RYGB) is a highly effective treatment for diabetes and obesity.
Diabetes is characterized by hyperglucagonemia and hyperglycemia.
The effects of RYGB on glucagon secretion are not precisely known with contradictory effects seen in previous studies.
The contradictory findings of these previous studies may be due to cross-reaction of the employed glucagon immunoassays with related proglucagon-derived peptides.
What are the new findings?
We validated a sensitive and specific immunoassay for measurement of postprandial glucagon levels in patients who have had RYGB, against a reference mass-spectrometry assay.
We found that fasting glucagon was reduced at 3 and 12 months after RYGB surgery.
The postprandial secretion of glucagon in response to the mixed-meal stimulus was not significantly altered.
This contrasted with the other proglucagon-derived peptides (glucagon-like peptide-1, oxyntomodulin) which exhibited no significant change in fasting levels but marked enhancements of postprandial secretion at earlier time points after surgery.
How might these results change the focus of research or clinical practice?
The reduction of glucagon secretion (glucagonostasis) appears to be related to the continuing improvement in glycemia at later time points after RYGB.
The Mercodia immunoassay, using an Alternative high-stringency protocol to minimize detection of other proglucagon-derived peptides, is suitable for the study of glucagon levels in patients who have had RYGB.
Introduction
Bariatric surgery is currently considered to be the most effective treatment for obesity and type 2 diabetes.1 The beneficial effects of weight loss as well as the improvement in other metabolic parameters are at least partly mediated through postoperative changes of gut hormone secretion.2–4 Roux-en-Y gastric bypass (RYGB) is characterized by enhanced postprandial glucagon-like peptide-1 (GLP-1), oxyntomodulin and peptide YY (PYY) secretion, leading to enhanced insulin secretion, early resolution of diabetes, long-term appetite suppression, reduced caloric intake and weight loss.5–8 Although infusion of GLP-1, oxyntomodulin and PYY to replicate the levels seen after RYGB reduces weight and normalizes blood glucose in subjects with obesity and diabetes, this strategy does not fully replicate all the effects of surgery.9 Hence, additional mechanisms may also act to mediate the metabolic benefits of RYGB. One key hormone that is suspected to be affected by RYGB is glucagon. Hyperglucagonemia is etiologically linked to the hyperglycemia of diabetes.10 11 In contrast to the well-characterized changes in GLP-1, oxyntomodulin and PYY secretion after RYGB,8 there are conflicting data in the literature on the changes in glucagon physiology after bariatric surgery, with various reports of decreases in fasting glucagon5 12 versus no significant change13–17; and increases in the postprandial glucagon response12–15 17 versus no significant change18 or even a reduction.5 One major factor that may be responsible for this inconsistency is differences in the performance of the immunoassays used for the measurement of glucagon, especially the technical issue of cross-reactivity between proglucagon peptide species.19 20 Glucagon, oxyntomodulin and glicentin are derived from post-translational processing of the glucagon precursor, proglucagon: glucagon corresponds to residues 33–61 whereas glicentin maps to residues 1–69 and oxyntomodulin to 33–69.21 Differentiating these proglucagon peptide species is therefore challenging since they share the same antigenic mid-region but also circulate in low levels (0–50 pmol/L) demanding high analytical sensitivity.21–23 Of the various glucagon assays available the Mercodia sandwich ELISA, which detects the N-terminus and C-terminus of the peptide, has proven to be a specific and highly sensitive assay19 but a recent report suggested that other proglucagon peptide species can still interfere with the determination of levels using the Standard protocol.24 This issue is especially challenging in circumstances such as in bypass surgeries where early exposure of neuroendocrine L-cells to ingested nutrients can trigger the exaggerated secretion of other proglucagon-derived peptides such as glicentin and oxyntomodulin. Given the aforementioned limitations of the immunoassays, new analytical methods such as the combination of liquid chromatography combined with mass spectrometry (LC/MS-MS) can be used as reference assays.25 However, the ELISAs are more analytically sensitive and allow for streamlined processing of the multiple samples derived from dynamic testing in larger cohorts. For the foreseeable future, immunoassays will remain the mainstream assay of choice for physiological studies of glucagon. We therefore sought to validate the performance of the Mercodia ELISA assay against our reference LC/MS-MS assay under the circumstance of patients undergoing RYGB, to definitively study the evolution of the fasting and postprandial response of glucagon and other proglucagon peptides to a mixed-meal test (MMT) in a prospectively studied cohort of patients undergoing RYGB.
Materials and methods
Participants
The samples for the comparative assay study were derived from dynamic testing (with a standardized 75 g oral glucose tolerance test (OGTT) or MMT) of patients after RYGB surgery (ref 7 and ISRCTN15283219). Patients in the prospective study (ClinicalTrials.gov) carried a diagnosis of impaired fasting glucose, impaired glucose tolerance or type 2 diabetes according to WHO criteria, and a stable HbA1c of <79 mmol/mol. All patients met the UK National Institute for Clinical Excellence criteria for bariatric surgery. The clinical characteristics of the patients in the prospective study are shown in table 1.
Clinical characteristics of the prospectively studied RYGB surgery patients (n=19)
The study took place at the Imperial National Institute for Health Research Clinical Research Facility at Hammersmith Hospital. RYGB surgery was performed laparoscopically in a single center (Imperial Weight Centre) according to a standardized technique (division of the small bowel 50 cm from the ligament of Treitz to construct the biliopancreatic limb, construction of a 100 cm alimentary limb with a side-to-side entero-enterostomy to the biliopancreatic limb, construction of a 30–40 mL isolated proximal gastric pouch, endostapler anastomosis of the gastric pouch to the alimentary limb) by designated surgeons (ARA and SP).
The participants in the prospective study were assessed with MMTs before the RYGB surgery and at 1, 3 and 12 months postoperatively. At each visit, the volunteers attended at 08:00 after an overnight fast of at least 10 hours, without having taken any antidiabetic medication (if using). The participants were given Ensure Compact (14 g protein, 12.9 g of fat, 39.6 g of carbohydrates, 330 kcal, 137.5 mL; Abbott) and were directed to drink this over 10 min. Blood samples were collected via an indwelling cannula placed in the antecubital fossa for glucose, insulin, GLP-1, glucose-dependent insulinotropic peptide (GIP), oxyntomodulin, glicentin and glucagon levels at baseline and 15, 30, 60, 120 and 180 min after ingestion.
Assays
Plasma samples for glucose were collected in sodium fluoride tubes and serum samples for insulin were collected in clot activator tubes (Becton-Dickinson). These were analyzed by NW London Pathology using an Abbott Architect platform analyzer (Maidenhead, UK; coefficient of variation (CV) <5% and <10%, respectively). Blood samples for gut hormone analysis were collected in lithium heparin collection tubes containing 0.1 mL of aprotinin (1000 KIU/4 mL of blood; Nordic Pharma UK) and a dipeptidyl peptidase 4 inhibitor Diprotin A (20 µg/mL blood; Enzo Life Sciences, UK) and chilled on ice immediately after collection. After centrifugation at 4°C, plasma was separated and stored at −80°C until analysis. For the comparative assay study, plasma glucagon was measured using the Mercodia ELISA, using both the Standard manufacturer’s protocol, and the Alternative protocol (which includes an additional incubation and wash step) as described in Roberts et al.24 This latter protocol was optimized to reduce cross-reactivity with other glucagon-related molecules. The lowest level of quantification (LLOQ) was 1.5 pmol/L and with intra-assay and interassay CV of <10%. Glucagon was also measured by LC/MS-MS using a custom-developed in-house assay. This was based on a published glucagon and GLP-1 method.25 The calibration matrix was also altered from buffer to depleted plasma to more closely match the study samples. The resulting assay gave a glucagon LLOQ of 4.3 pmol/L (15 pg/mL), with relative error less than ±25% and CV less than 25% over six replicates. For the prospective study, active GLP-1 and GIP were measured by a customized Milliplex magnetic bead-based multianalyte human metabolic panel (Millipore HMHEMAG-34K). The intra-assay and interassay CV was <10%, and the LLOQ was 0.8 pmol/L for active GLP-1 and 0.3 pmol/L for GIP. Plasma oxyntomodulin was measured using a specific and sensitive mass-spectrometry validated immunoassay26: the intra-assay and interassay CV for this assay was <10% and the LLOQ was 5 pmol/L. Plasma glicentin was measured using the ELISA from Mercodia with intra-assay and interassay CV of <10%; the LLOQ was 3.1 pmol/L. This assay displays no cross-reactivity to glucagon, oxyntomodulin, GLP-1 and GLP-2. As noted in the results, the Alternative protocol for glucagon was selected for this study.
Statistical analysis
All analyses were carried out using GraphPad Prism V.8.2.1 (GraphPad Software). For the comparison of assay performance, linear regression and Bland-Altman plots were used to compare the two Mercodia protocols versus the reference LC/MS-MS assay. For analysis of the dynamic glucagon levels measured using the two Mercodia protocols and LC/MS-MS during the 75 g OGTT in patients after RYGB, a mixed-model repeated measures analysis was performed, using Tukey’s test to compare the glucagon levels at selected times after the dynamic stimulus was given. For the analysis of the gut hormone data from the MMT in the prospectively studied RYGB cohort, a mixed-model repeated measures analysis was performed, using Dunnett’s multiple comparisons test to compare the presurgery (Pre) data with the postsurgery data at 1, 3 and 12 months. The interactive, 24-variable homeostatic model of assessment in default mode (HOMA2) was used to calculate %B (beta cell function) and %S (insulin sensitivity) using the fasting glucose and insulin values.27
Results
Comparative performance of the Mercodia Standard and Alternative protocols versus LC/MS-MS
To understand the comparative performance of the assays for glucagon we analyzed 110 samples, derived from dynamic testing in patients after RYGB, in parallel using the Mercodia ELISA Standard and Alternative protocols, and the reference LC/MS-MS assay. Figure 1 shows the comparative performance of the ELISA protocols against LC/MS-MS. Linear regression (figure 1A,B) showed that both Standard and Alternative protocols exhibited overall negative proportional systematic biases (−19.3% and −57%, respectively). The Standard protocol exhibited a large positive constant bias (+10.1 pmol/L) whereas the constant bias was much smaller at +1.1 pmol/L for the Alternative protocol. The r2 statistic, as a measure of ‘goodness of fit’, was 0.1550 vs 0.8121, respectively; this difference was reflected in the residual plots which demonstrated far smaller magnitude residuals with Alternative versus Standard (figure 1C,D). Bland-Altman plots (figure 1E,F) showed Standard had a mean bias of +8.1 pmol/L versus a mean bias of −4.6 pmol/L with Alternative. The 95% CI of agreement was much smaller with Alternative (−15.9 to +6.6 pmol/L) versus Standard (−27.2 to +43.5 pmol/L), consistent with the r2 statistic. The Alternative protocol did show a negative proportional systematic bias on the Bland-Altman plot (figure 1F). This suggests that this protocol’s inclusion of the additional wash and incubation step leads to high analytical specificity in comparison to Standard, but there is a reduced recovery of glucagon in comparison with LC/MS-MS at higher values.

Comparative performance of Mercodia ELISA for glucagon using Standard and Alternative protocols versus LC/MS-MS as reference. Linear regression of Standard (A) and Alternative (B) versus LC/MS-MS: solid line shows linear regression line, dotted line of identity. Residuals plot for Standard (C) and Alternative (D) for linear regression. Bland-Altman plot for Standard (E) and Alternative (F): dotted line shows mean bias, gray shading 95% CI for agreement. LC/MS-MS, liquid chromatography combined with mass spectrometry.
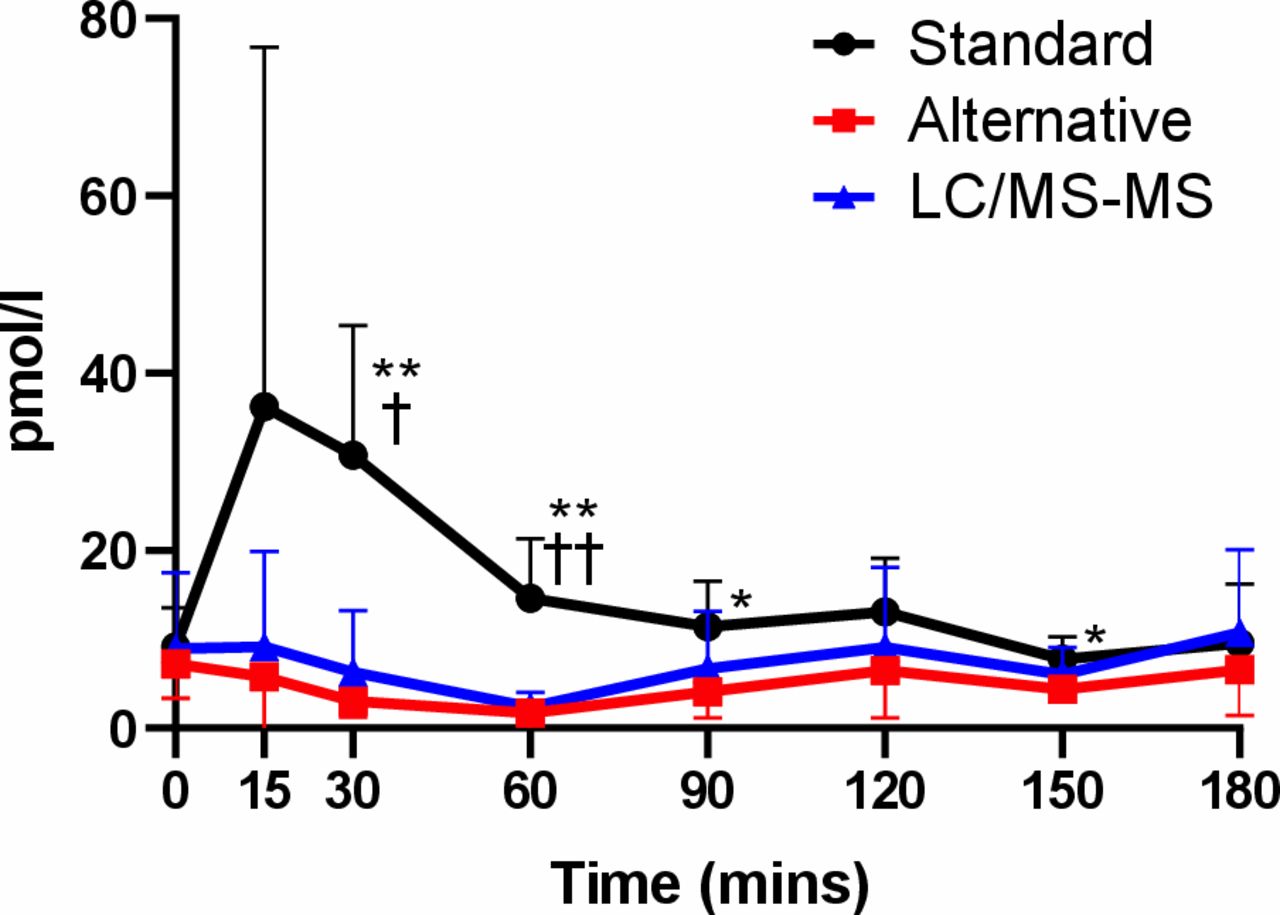
To investigate the reason for the positive bias in the Standard protocol, we examined the comparative data looking at a subset of non-diabetic participants who had undergone an OGTT after RYGB. The results in figure 2 show that all three assays report similar fasting levels at baseline. Using the OGTT stimulus, there is an expectation that glucagon will be suppressed and indeed this is what is seen with the Alternative protocol and the LC/MS-MS assay. However, the Standard protocol exhibits an artifactual post-OGTT rise persisting to 150 min after the glucose stimulus (mean difference (95% CI) vs LC/MS-MS at 30 min: 24.5 pmol/L (5.9 to 43.1), adjusted p=0.013). These post-OGTT samples are largely responsible for the poor fit of the Mercodia Standard protocol values to the LC/MS-MS in figure 1A, C.

Variation in glucagon levels in Roux-en-Y gastric bypass (RYGB) patients during an oral glucose tolerance test (OGTT) as assessed by Mercodia Standard protocol (black), Alternative protocol (red) and LC/MS-MS (blue). Mean and 95% CI plotted. Mixed-effects model analysis with Tukey’s test for multiple comparisons used to study the contrast between the assays at each time point. *Comparison of Standard versus Alternative. †Comparison of Standard versus LC/MS-MS. One symbol: p<0.05, two symbols: p<0.01. LC/MS-MS, liquid chromatography combined with mass spectrometry.
Proglucagon peptide dynamics in response to an MMT before and after RYGB surgery
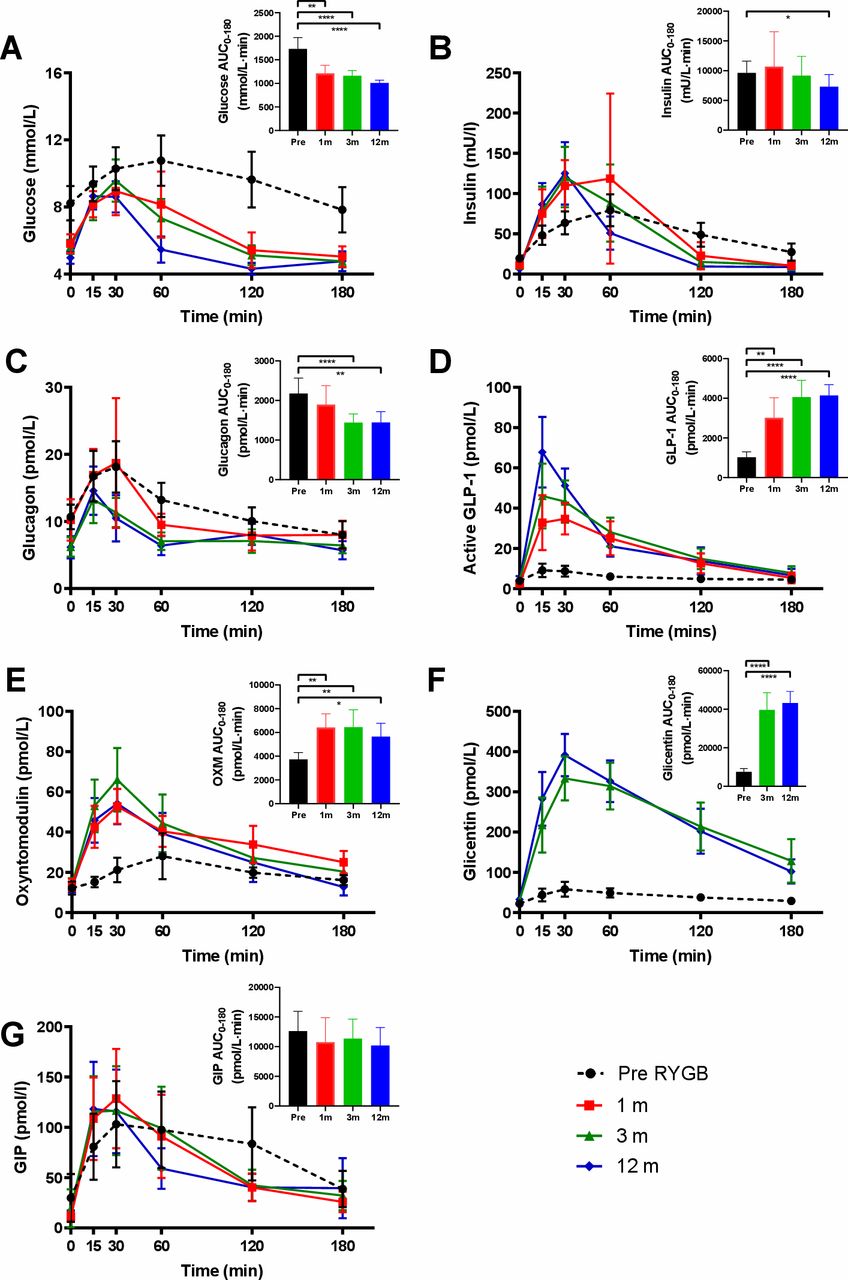
Given its superior analytical specificity in comparison to the Standard protocol and its better analytical sensitivity compared with LC/MS-MS, we selected the Alternative protocol for analysis of glucagon levels from our prospectively studied cohort of patients undergoing RYGB. In line with expectations, fasting glucose levels decreased significantly over time after RYGB surgery (mean difference (95% CI) between Pre vs 1 month: −2.4 mmol/L (−3.8 to –1.0), adjusted p=0.0005; Pre vs 3 months: −2.6 (−3.9 to –1.3), adjusted p=0.0001; Pre vs 12 months: −3.3 (−4.6 to –1.9), p<0.0001). During the MMT, we observed a shift of the peak towards the left with median time to peak (Tmax) for glucose decreasing to 22.5–30 min postoperatively as opposed to 60 min when studied before surgery (table 2). The peak value (Cmax) for glucose was significantly reduced at 3 months after surgery (mean difference −1.5; 95% CI −2.9 to –0.04). There was a significant decrease in glucose area under the curve from 0 to 180 min (AUC0–180min) at 1, 3 and 12 months after surgery (figure 3A, table 2). Fasting insulin levels decreased significantly after surgery (mean difference (95% CI) between Pre vs 1 month: −8.4 mU/L (−14.0 to –2.8), adjusted p=0.0023; Pre vs 3 months: −9.2 (−15.0 to –3.3), adjusted p=0.0014; Pre vs 12 months: −12.9 (−17.7 to –8.1), adjusted p<0.0001).
Summary of changes in glucose, insulin, interactive 24-variable homeostatic model of assessment in default mode (HOMA2) beta cell function (%B) and insulin sensitivity (%S), glucagon, GLP-1, oxyntomodulin, glicentin, GIP during MMT before surgery (Pre), 1 month, 3 months and 12 months after surgery
Glucose (A), insulin (B), glucagon (C), active glucagon-like peptide-1 (GLP-1) (D), oxyntomodulin (E), glicentin (F) and GIP (G) levels during mixed-meal test (MMT). Mean and 95% CI plotted. Inset graphs show area under the curve (AUC) values over 0–180 min. Black, before surgery (Pre); red, 1 month after surgery; green, 3 months; blue, 12 months. Mixed-effects model analysis, Dunnett’s multiple comparisons test for repeated measures used to compare AUC values for Pre versus indicated times after surgery. *P<0.05; **p<0.01; ****p<0.0001. GIP, glucose-dependent insulinotropic peptide; OXM, oxyntomodulin; RYGB, Roux-en-Y gastric bypass.
The HOMA2 analysis, using the fasting glucose and insulin values, showed no significant change in the beta cell function, but a significant and progressive postoperative increase in insulin sensitivity was observed (mean difference (95% CI) between Pre vs 1 month: 45.3% (12.9% to 77.7%), adjusted p=0.0076; Pre vs 3 months: 60% (30.7% to 89.3%), adjusted p=0.0002; Pre vs 12 months: 107% (70.0% to 147.1%), adjusted p<0.0001). The change in shape of the postprandial insulin curve mirrored the one of glucose with a shift to an earlier median Tmax at 30–45 min after RYGB surgery (figure 3B). There was a significant increase in the postprandial Cmax for insulin comparing Pre with 3 and 12 months (mean difference (95% CI) between Pre vs 1 month: 69.5 (−21.1 to 160.2), adjusted p=0.1455; Pre vs 3 months: 55.1 (8.9 to 101.4), adjusted p=0.0181; Pre vs 12 months: 47.7 (14.8 to 80.6), adjusted p=0.0044). There was a significant decrease in insulin AUC0–180min at 12 months after surgery but not at 1 or 3 months (table 2).
The proglucagon-derived peptides showed divergent behavior after RYGB. Fasting glucagon levels were not changed at 1 month but decreased significantly after RYGB surgery at 3 and 12 months (mean difference (95% CI) between Pre vs 1 month: −0.5 pmol/L (−3.5 to 2.6), adjusted p=0.9642; Pre vs 3 months: −4.48 (−6.3 to –2.7), adjusted p<0.0001; Pre vs 12 months: −4.5 (−6.8 to –2.3), adjusted p=0.0004). Postprandially all patients responded to the MMT with an increase in glucagon secretion but we again observed a left shift of the Tmax to a median time of 15 min. There was a significantly reduced Cmax at 3 months compared with presurgery (mean difference (95% CI) between Pre vs 1 month: 1.5 pmol/L (−9.0 to 12.4), adjusted p=0.9642; Pre vs 3 months: −4.7 (−8.4 to –1.0), adjusted p=0.0118; Pre vs 12 months: −4.3 (−9.8 to 1.2), adjusted p=0.1409). There was a significant decrease in glucagon AUC0–180min at 3 and 12 months after surgery. Adjusting for the change in fasting baseline, we calculated the incremental AUC0–180min and there was no significant change in this value after surgery (figure 3C, table 2).
In contrast to glucagon, fasting GLP-1 levels did not show any significant change after surgery whereas postprandial GLP-1 Cmax increased significantly after surgery at 1, 3 and 12 months (mean difference (95% CI) between Pre vs 1 month: 27.7 pmol/L (14.0 to 41.5), adjusted p=0.0006; Pre vs 3 months: 44.9 (27.8 to 61.9), adjusted p<0.0001; Pre vs 12 months: 61.2 (43.5 to 78.9), adjusted p<0.0001). There was a marked, progressive and significant increase in GLP-1 AUC0–180min with time after surgery (figure 3D, table 2). Similar to GLP-1, fasting oxyntomodulin levels were not significantly altered after surgery but postprandial Cmax increased significantly at 3 and 12 months after RYGB (mean difference (95% CI) between Pre vs 1 month: 21.9 pmol/L (−2.3 to 46.1), adjusted p=0.0783; Pre vs 3 months: 38.7 (19.4 to 57.9), adjusted p=0.0002; Pre vs 12 months: 32.2 (13.5 to 50.8), adjusted p=0.0010) with a left shift of Tmax to a median time of 30 min. Commensurately, there was a significant increase in oxyntomodulin AUC0–180min from 1 month onwards (figure 3E, table 2). Fasting glicentin levels remained unchanged after RYGB at 3 and 12 months compared with presurgery. However, after surgery, there was a large increase in Cmax (mean difference (95% CI) between Pre vs 3 months: 287.9 pmol/L (225.2 to 350.6), adjusted p<0.0001; Pre vs 12 months: 341.4 (287.6 to 395.2), adjusted p<0.0001) with an accompanying significant increase in glicentin AUC0–180min (figure 3F, table 2). Of all the proglucagon peptides, glicentin displayed the largest postprandial increase in secretion after RYGB, dwarfing GLP-1 and oxyntomodulin.
There was neither a statistically significant change in fasting, in postprandial GIP levels nor in GIP AUC0–180min (figure 3G, table 2), apart from a reduction in fasting levels at 3 months versus Pre (mean difference (95% CI) −10.3 pmol/L (−19.3 to –1.2), adjusted p=0.0266).
Discussion
The key strengths of this prospective study are that we studied a well-characterized cohort of pre-diabetic/diabetic participants undergoing RYGB in a single center with a standardized technique, and that the immunoassay employed for glucagon was validated against a reference LC/MS-MS assay. We found that for the Mercodia glucagon assay using extra incubation and wash steps (Alternative protocol) as an addition to the Standard protocol improved analytical specificity. Roberts et al have reported similar issues with the Standard protocol although in the context of lean patients who have undergone a total gastrectomy and Roux-en-Y reconstruction for cancer.24 Our data extends and validates this observation in the context of RYGB surgery for obese patients. The Mercodia assay, with Alternative protocol, is suitable for the measurement of glucagon levels in subjects who have undergone RYGB, although with some loss of recovery at higher levels.
Our specific assays allow us to distinguish the divergent behavior of the proglucagon-derived peptides in response to RYGB. Fasting glucagon reduced significantly in our study group after RYGB in alignment with the improvement seen in glucose homeostasis and insulin sensitivity at 3 and 12 months. The MMT elicited an increase in glucagon secretion both preoperatively and postoperatively in response to the protein content of the stimulus,28 unlike the OGTT stimulus. There was an overall reduction of glucagon AUC at 3 and 12 months and a reduction in the glucagon Cmax at 3 months, but the incremental AUC was similar between baseline and the postsurgical time points, suggesting that the magnitude of postprandial stimulation of glucagon secretion after the MMT was similar and the reduced overall glucagon AUC is mainly driven by the lower starting level of glucagon. This reduction in fasting glucagon with unchanged postprandial secretion contrasts with the phenomenon of unchanged fasting levels and enhanced postprandial secretion seen with GLP-1 and oxyntomodulin.5 15
It is unknown what the mechanisms driving this change in glucagon dynamics are. Although GLP-1 is known to suppress glucagon secretion, fasting GLP-1 levels are not altered after surgery and cannot logically be driving a suppression in fasting glucagon levels. Similarly PYY has been shown to suppress glucagon secretion based on experiments in isolated islets,29 but fasting PYY levels are not altered after surgery.30 Notwithstanding the fact that endocrine somatostatin secretion is not altered after early time points following RYGB,31 we speculate that one possible mechanism for the fall in fasting insulin and glucagon secretion after RYGB may be an increase in paracrine somatostatin secretion from islet delta cells.32 As for the postprandial glucagon response, this is unchanged after surgery and compatible with direct amino acid stimulation of glucagon secretion by the MMT, with a left shift in Tmax due to accelerated delivery and digestion of the protein content after RYGB.33
Jorgensen et al, who employed an in-house assay directed to the C-terminus of glucagon, observed a reduced fasting glucagon level at 3 and 12 months after RYGB in concordance with our findings. They observed an enhancement of postprandial glucagon secretion (as judged by incremental glucagon AUC) from 1 week onwards persisting through 3 and 12 months which contrasts with our findings.5 15 Purnell et al showed a reduction in mean fasting glucagon level in diabetics undergoing RYGB and a progressive postsurgical enhancement of the peak glucagon response to an MMT stimulus at follow-up to 24 months, at odds with our findings.12 However, they reported values of glucagon approximately 20-fold observed by us and other research groups, possibly due to a technical issue with their Millipore immunoassay, making their results difficult to interpret. Jorsal et al also used the Mercodia assay and the C-terminal assay to measure the response of glucagon to an MMT stimulus in eight patients undergoing RYGB at 3 months and 1 week prior to surgery, and at 1 week and 3 months after surgery. This study suggested no change in fasting glucagon levels at baseline, a small increase in peak glucagon secretion at 1 week, and, overall, no change in AUC for glucagon secretion after MMT, but the authors acknowledged that the small cohort number limited their statistical power.17 Our study, on the other hand, used a larger cohort with greater statistical power to detect differences.
In contrast to glucagon, fasting oxyntomodulin showed little change after RYGB, but demonstrated marked and progressive increases in postprandial secretion as early as 1 month after RYGB, a pattern observed in other studies.2 7 9 26 As oxyntomodulin combines GLP-1 and glucagon activity34 this may contribute to the marked insulinotropy observed after RYGB in concert with GLP-1 and therefore improved glucose disposal. We found that there was no difference in fasting glicentin after surgery, but massive postprandial increases were measured at 3 and 12 months. It is known that this effect is present from 1 week onwards after surgery.17 Glicentin inhibits gastric acid secretion35 as well as duodenal and jejeunal motility in rats36 and appears to have a mild insulinotropic effect (less than that of glucagon) when infused in high doses into the pancreaticoduodenal artery in dogs.37 The effect of glicentin on metabolism in humans is more uncertain, with no metabolic effects seen in infusion studies,38 but it is likely, from the methodological point of view, that the increase in postprandial glicentin is the main cross-reactive species responsible for the poor performance of the Standard protocol compared with LC/MS-MS in the poststimulus samples.24
In a similar fashion to glucagon, previous studies on the behavior of GIP dynamics have shown discrepant results. Fasting GIP has been shown to fall in patients with diabetes who undergo RYGB39 but others have shown no change.40 In the study of Korner et al, there was no significant difference between RYGB patients and matched obese controls in terms of fasting GIP levels, but there was a marked reduction in postprandial secretion in response to a test meal.41 On the other hand, Laferrère and colleagues showed an increase in GIP secretion in response to an OGTT after RYGB compared with preoperatively.13 Our findings, in a larger cohort than used in these studies, suggest that, overall, there is no decided difference in GIP secretion either fasting or in response to an MMT, and that GIP may not contribute significantly to the increased postprandial insulinotropy and improvement in glycemic control after RYGB.42
In summary, our study shows that, after RYGB, the fasting glucagon decreases but the postprandial glucagon secretion to an MMT stimulus does not significantly change. This change in glucagon dynamics may contribute to the improvement in glycemia after surgery. Future studies on the feasibility of therapeutic strategies replicating the post-RYGB gut hormone milieu (the so-called ‘medical bypass’) may benefit from inclusion of a glucagon antagonist43 to investigate the contribution of glucagonostasis to the benefits of RYGB.
Acknowledgments
We thank the staff at the Imperial NIHR Clinical Research Facility for their support of this research study.
References
Footnotes
BK and TM-MT are joint senior authors.
Twitter @bernardkhoo
KA, JC and JH contributed equally.
Contributors TM-MT, BK and SRB contributed to study design, data collection, statistical analysis, data interpretation, and writing of the manuscript. KA and JC drafted the manuscript. KA, JC, II, AK, GT, PB and PRB contributed to the running of the study, sample analysis, data collection and data interpretation. JH, RW and MF performed LC/MS-MS assay development and analysis for glucagon. ARA and SP were the surgeons of the study. JJH and NJWA contributed to the analysis of samples and data interpretation. All authors contributed to critical review of the manuscript. TM-MT is the guarantor of this work and had full access to all the data in the study; she takes responsibility for the integrity of the data and the accuracy of the data analysis.
Funding This work was supported by a UK Medical Research Council (MRC) Experimental Challenge Grant (MR/K02115X/1) and UK National Institute for Health Research (NIHR) Efficacy and Mechanism Evaluation Grant (13/121/07). This work was also supported by the Imperial NIHR Clinical Research Facility at Imperial College Healthcare NHS Trust. The Department of Metabolism, Digestion and Reproduction is funded by grants from the MRC and Biotechnology and Biological Sciences Research Council and is supported by the NIHR Imperial Biomedical Research Centre (BRC) Funding Scheme. KA is supported by an NIHR Academic Clinical Lectureship and acknowledges support from the NIHR Imperial BRC. TM-MT and SRB are funded by the NIHR Imperial BRC. AK was funded by the NIHR Imperial BRC and a fellowship from the Royal College of Surgeons. II and JC are funded by the NIHR Imperial BRC. JJH is supported by the Novo Nordisk Foundation.
Disclaimer The views expressed are those of the authors and not necessarily those of the above-mentioned funders, the NHS, the NIHR, or the Department of Health.
Competing interests JJH is a member of advisory boards for Novo Nordisk.
Patient consent for publication Not required.
Ethics approval Ethical approval was obtained from the West London National Research Ethics Committee (reference number 13/LO/1510), and the studies were conducted according to the principles of the Declaration of Helsinki.
Provenance and peer review Not commissioned; externally peer reviewed.
Data availability statement Data are available upon reasonable request. The data sets generated during and/or analyzed during the current study are not publicly available but are available from the corresponding author on reasonable request.