Article Text

Abstract
Introduction Body fat distribution is strongly associated with cardiometabolic disease (CMD), but the relative importance of hepatic fat as an underlying driver remains unclear. Here, we applied a systems biology approach to compare the clinical and molecular subnetworks that correlate with hepatic fat, visceral fat, and abdominal subcutaneous fat distribution.
Research design and methods This was a cross-sectional sub-study of 283 children/adolescents (7–19 years) from the Yale Pediatric NAFLD Cohort. Untargeted, high-resolution metabolomics (HRM) was performed on plasma and combined with existing clinical variables including hepatic and abdominal fat measured by MRI. Integrative network analysis was coupled with pathway enrichment analysis and multivariable linear regression (MLR) to examine which metabolites and clinical variables associated with each fat depot.
Results The data divided into four communities of correlated variables (|r|>0.15, p<0.05) after integrative network analysis. In the largest community, hepatic fat was associated with eight clinical biomarkers, including measures of insulin resistance and dyslipidemia, and 878 metabolite features that were enriched predominantly in amino acid (AA) and lipid pathways in pathway enrichment analysis (p<0.05). Key metabolites associated with hepatic fat included branched-chain AAs (valine and isoleucine/leucine), aromatic AAs (tyrosine and tryptophan), serine, glycine, alanine, and pyruvate, as well as several acylcarnitines and glycerophospholipids (all q<0.05 in MLR adjusted for covariates). The other communities detected in integrative network analysis consisted of abdominal visceral, superficial subcutaneous, and deep subcutaneous fats, but no clinical variables, fewer metabolite features (280, 312, and 74, respectively), and limited findings in pathway analysis.
Conclusions These data-driven findings show a stronger association of hepatic fat with key CMD risk factors compared with abdominal fats. The molecular network identified using HRM that associated with hepatic fat provides insight into potential mechanisms underlying the hepatic fat–insulin resistance interface in youth.
- insulin resistance
- NAFLD
- dyslipidemia
- visceral fat
This is an open access article distributed in accordance with the Creative Commons Attribution Non Commercial (CC BY-NC 4.0) license, which permits others to distribute, remix, adapt, build upon this work non-commercially, and license their derivative works on different terms, provided the original work is properly cited, appropriate credit is given, any changes made indicated, and the use is non-commercial. See: http://creativecommons.org/licenses/by-nc/4.0/.
Statistics from Altmetric.com
Significance of this study
What is already known about this subject?
It is well established that the distribution of body fat, and in particular central fat, is a strong risk factor for cardiometabolic dysfunction.
What are the new findings?
Using a data-driven analysis, we showed that, among the central fat depots assessed, hepatic fat is more strongly associated with clinical cardiometabolic disease biomarkers (such as insulin resistance and dyslipidemia) than abdominal fats in a diverse sample of >250 children and adolescents.
Hepatic fat is also associated with molecular markers reflecting systemic disturbances in metabolism measured using high-resolution metabolomics.
These disturbances were predominantly related to amino acid and lipid metabolism; further, several of these disturbances have also been associated with insulin resistance and may reflect shared pathophysiological mechanisms.
How might these results change the focus of research or clinical practice?
These findings support that hepatic fat is strongly correlated with cardiometabolic dysfunction in youth and may serve as an effective screening and/or therapeutic target.
Introduction
The prevalence of childhood obesity has increased dramatically since the 1980s, posing significant health challenges in terms of cardiometabolic disease (CMD) risk.1 Yet not all children with obesity have the same degree of metabolic dysfunction, and this may be attributed to differences in body fat distribution. For several decades, abdominal adiposity, especially as visceral adipose tissue (VAT), has been strongly associated with insulin resistance (IR) and other CMD risk factors in childhood, independent of total body fat.2 More recently, hepatic fat has also gained attention as a key determinant of metabolic dysfunction and has been shown to correlate with IR equally, if not more strongly, than VAT.3 4
High-resolution metabolomics (HRM) is a high-throughput metabolic profiling technique that combines liquid chromatography with ultra-high-resolution mass spectrometry and advanced computational tools for data extraction.5 Prior pediatric studies have assessed metabolome alterations in relation to total adiposity,6 but most have overlooked the influence of body fat distribution, with the exception of a few that examined the metabolome of pediatric non-alcoholic fatty liver disease (NAFLD).7–9 The differential contribution of liver and abdominal fat to these metabolome alterations and subsequent clinical CMD risk factors remains unclear. Studies specifically conducted in children and adolescents warrant further attention given the potential to better understand disease mechanisms early on in the pathogenesis of disease.
Integrative network analysis is a novel, data-driven approach for identifying and visualizing complex interconnections between multiple ‘omics’ and/or clinical phenotypic data sets. Here, using an integrative network analysis coupled with pathway enrichment analysis, we aimed to describe and compare the clinical and molecular subnetworks that correlate with hepatic fat, visceral fat, and abdominal subcutaneous fat distribution in a cross-sectional sample of children and adolescents.
Research design and methods
Yale Pediatric NAFLD Cohort
The sample for this study was recruited from a pediatric obesity clinic in New Haven, Connecticut as part of the ongoing Yale Pediatric NAFLD Cohort (7–19 years). Additional details of the cohort were recently described elsewhere.10 Briefly, exclusion criteria were known hepatic diseases (except for NAFLD), alcohol consumption, and use of medications that alter blood pressure or glucose, lipid, or amino acid (AA) metabolism. Parental informed consent and child assent were obtained from all participants. The initial eligible sample was 359 children and adolescents who agreed to have their fasting plasma samples stored for future use. The subsample used in the present analysis consisted of 283 participants with complete data for all body composition and clinical variables (online supplementary figure S1). In online supplementary table S1, we summarized the demographic and health characteristics of the excluded subsample (n=73 participants), in comparison with the subsample included in this analysis.
Supplemental material
Supplemental material
Metabolic and biochemical assessment
Metabolic studies were done following an overnight fast as previously described,10 Fasting plasma samples were collected in ethylene diaminete traacetic acid (EDTA) tubes from all participants and used for the following biochemical analyses or stored at −80°C for future use. Fasting plasma glucose (FPG) was determined using a glucose analyzer (Beckman Instruments, Brea, California). Plasma insulin was measured by the Linco radioimmunoassay (St Charles, Missouri). Homeostatic model assessment of insulin resistance (HOMA-IR) was calculated as fasting insulin (μU/mL)×FPG (mg/dL)/405.11 Lipid levels were determined with an autoanalyzer (Model 747-200, Roche Diagnostics, Indianapolis, Indiana). Liver enzymes were measured using standard automated kinetic enzymatic assays. An oral glucose tolerance test (OGTT) was also performed (1.75 g/kg body weight, up to 75 g) and used to calculate whole body insulin sensitivity index (WBISI) and the insulinogenic index (IGI) using the Matsuda formula,12 and the oral disposition index (DI) as WBISI×IGI. Type 2 diabetes (FPG ≥126 mg/dL or 2-hour glucose ≥200 mg/dL), impaired fasting glucose (IFG) (FPG 100–125 mg/dL), and/or impaired glucose tolerance (IGT) (2-hour plasma 140–199 mg/dL) were defined based on the American Diabetes Association criteria.13
Anthropometrics and imaging assessment
Weight and height were measured, and age-adjusted and sex-adjusted body mass index (BMI) z-scores were calculated using the 2000 Centers for Disease Control and Prevention growth charts. Abdominal MRI was performed using a Siemens Sonata 1.5 Tesla system (Erlangen, Germany) as previously described.10 Briefly, abdominal VAT and subcutaneous adipose tissue (SAT) were quantified in a single slice at the L4/L5 vertebral disc space, with the fascia superficialis as the division between the deep and superficial SAT. Each abdominal fat was converted to a ratio divided by the sum of VAT+SAT; absolute abdominal fat measures were not used due to the possibility that they may increase or decrease with body size.14 Hepatic fat fraction (HFF) was quantified using MRI and a modified two-point Dixon method.10 NAFLD was defined as MRI-HFF >5.5%.15
High-resolution metabolomics
Prior to analysis, plasma aliquots were removed from storage at −80°C and thawed on ice. HRM by liquid chromatography-mass spectrometry (LC-MS) was then performed on the plasma samples using previously described methods by the Emory Clinical Biomarkers Laboratory.16 17 Briefly, plasma samples were prepared and analyzed in triplicate in batches of 40, with pooled human plasma (Q-standard) at the start, middle, and end of each batch for quality control purposes. Separate hydrophilic interaction liquid chromatography (HILIC) and C18 chromatography columns were coupled with detection by a high-resolution mass spectrometer (Q Exactive HF Orbitrap, Thermo Scientific, San Jose, California) operated in full scan mode at 120 000 resolution and mass to charge ratio (m/z) range 85–1275.
During HILIC chromatography, the electrospray ionization (ESI) source was operated in positive ion mode. Flow rate was maintained at 0.35 mL/min until 1.5 min, increased to 0.4 mL/min at 4 min and held for 1 min. Solvent A was 100% LC-MS grade water, solvent B was 100% LC-MS grade acetonitrile, and solvent C was 2% formic acid (v/v) in LC-MS grade water. Initial mobile phase conditions were 22.5% A, 75% B, and 2.5% C hold for 1.5 min, with linear gradient to 77.5% A, 20% B, and 2.5% C at 4 min, and held for 1 min. The C18 column was operated in parallel with negative ESI. Flow rate was maintained at 0.4 mL/min until 1.5 min, increased to 0.5 mL/min at 2 min, and held for 3 min. Solvent A was 100% LC-MS grade water, solvent B was 100% LC-MS grade acetonitrile, and solvent C was 10 mM ammonium acetate in LC-MS grade water. Initial mobile phase conditions were 60% A, 35% B, and 5% C hold for 0.5 min, with linear gradient to 0% A, 95% B, and 5% C at 1.5 min, and held for 3.5 min. The total analytical run time for both columns was 5 min. Probe temperature, capillary temperature, sweep gas and S-Lens radio frequency levels were maintained at 250°C, 300°C, 1 arbitrary units (AU) and 45 AU, respectively, for both polarities. Positive tune settings for sheath gas, auxiliary gas, sweep gas and spray voltage setting were 45 AU, 25 AU, 1 AU, and 3.5 kV, respectively; negative settings were 45 AU, 5 AU, 1 AU, and −4.0KV.
This dual chromatography platform provides a broad coverage of the metabolome, including approximately 500 endogenous, dietary and environmental chemicals,18 with identities confirmed by co-elution and MS/MS fragmentation spectra matching authentic standards (Liu et al).19 Raw data files were extracted and aligned, batch-corrected, and averaged across triplicates by apLCMS with xMSanalyzer.20 21 The resulting HILIC+ and C18− data consisted of 13 013 and 9054 m/z features, respectively, defined by an accurate mass m/z, retention time, and ion abundance. Only m/z features in >80% of samples were retained and log-transformed. The resulting 5661 m/z features from HILIC+ and 3750 from C18− were entered into downstream analyses.
Data analysis
All variables were evaluated for normality and the following were log-transformed to reduce skewness: VAT ratio, superficial SAT ratio, deep SAT ratio, fasting insulin, fasting glucose, WBISI, IGI, DI, and triglycerides. HFF was square root-transformed due to zero values. Descriptive statistics were used to assess the characteristics of the sample using counts and frequencies for categorical variables and mean and SD for continuous variables.
Integrative network analysis and pathway enrichment
Plasma metabolomics (HILIC+ and C18−) and clinical biomarkers data were integrated with hepatic and abdominal fat deposition data using a data integration software, xMWAS (V.0.55).22 In xMWAS, partial least squares (PLS) regression was used to conduct pairwise association analyses between the metabolomics and clinical biomarkers data sets with the hepatic and abdominal fat deposition data set (the reference). Associations were selected based on association scores (r>|0.15|) and significance (p<0.05 by Student’s t-test). Network visualization and community detection were performed based on the resulting association matrix using a multilevel algorithm designed to identify hierarchical community structures consisting of tightly connected nodes.23 HRM features within the detected communities were entered into pathway enrichment analysis using Mummichog (V.1.0.10).24 Pathways were considered significantly enriched based on p<0.05 in permutation-based testing and an overlap size ≥5 m/z features.
Multivariable linear regression
The associations between the metabolomics and clinical variables and the body fat variables from integrative network analysis were further evaluated using more traditional multivariable linear regression (MLR) models adjusting for age, sex, race/ethnicity, and BMI z-score, and all other MRI-based body fat deposition variables. Specifically, for the models examining associations of each clinical biomarker, we applied a Bonferroni adjustment to control for multiple testing.25 For models examining associations of each m/z feature, a false discovery rate (FDR) threshold of q<0.05 was applied using the Benjamini-Hochberg method.26 A summary of the full analytical framework is in figure 1.

Summary of the data analysis workflow. (1) High-resolution metabolomics was performed on stored plasma EDTA samples; (2) an integrative network analysis of the body fat deposition, clinical biomarkers, and plasma metabolomics data sets was performed in xMWAS; (3) the m/z features in each community detected in the integrative network analysis were entered into untargeted pathway analysis using Mummichog; (4) associations selected in the integrative network analysis between the clinical and metabolomics variables and the body fat variables were further examined using multiple linear regression adjusted for potential confounders. BMI, body mass index; EDTA, ethylene diaminete traacetic acid; m/z, mass to charge ratio; PLS, partial least squares.
Metabolite annotation
All significant m/z features from MLR were annotated using a multistep process. First, detected m/z and retention times were compared with an internal database of metabolites previously confirmed by comparing ion dissociation patterns and elution time with authentic standards,27 and these matches were considered level 1 ‘confirmed’ per the Metabolomics Standards Initiative (MSI).28 The remaining m/z features were computationally annotated using xMSannotator,29 which performs accurate mass matching to common positive and negative mode adducts in the Human Metabolome Database with an m/z tolerance of ±7 parts per million (ppm) and retention time tolerance of 10 s. xMSannotator matches were scored from 0 (accurate mass match only) to 3 (high confidence based on four orthogonal criteria) using the accurate mass match and an algorithm based on adduct/isotope patterns, elemental or abundance ratio checks, and pathway information. Among these annotations, m/z features with medium or high confidence scores (≥2) in xMSannotator were considered level 2 ‘annotated’ matches based on the MSI criteria. The remaining m/z features with low confidence scores (≤1) in xMSannotator were level 4 ‘unknown’ matches based on the MSI criteria. MS/MS analysis of a random subset of these features showed that approximately half had ion dissociation spectra matching database spectra.29
Results
The characteristics of the study population are shown in table 1. The mean age was 13.3±3.0 years, and 46% were male. The race/ethnicity distribution was 24% non-Hispanic white, 37% African–American, 35% Hispanic, and 5% other. The mean HFF was 7.1%±9.8%, and 35% of the sample were defined as having NAFLD. Additionally, 3% had type 2 diabetes mellitus, 16% had IGT, 6% had IFG and 2% had both IGT and IFG.
Demographic and health characteristics of the subsample of 283 children and adolescents (7–19 years) from the Yale Pediatric NAFLD Cohort
Integrative network analysis
The full results from pairwise association analyses in xMWAS are reported in online supplementary tables S2 and S3, which summarize the association scores generated from PLS between each m/z feature and each clinical variable, respectively, with each body fat variable. The resulting network generated in xMWAS based on these associations, which consisted of four distinct communities detected from the community detection algorithm, is shown in figure 2. Each community corresponded to a different body fat variable, either HFF, VAT ratio, deep SAT ratio, or superficial SAT ratio. Additional analyses were next performed to examine the clinical and metabolomics variables within each community (figure 2).
Supplemental material
Supplemental material
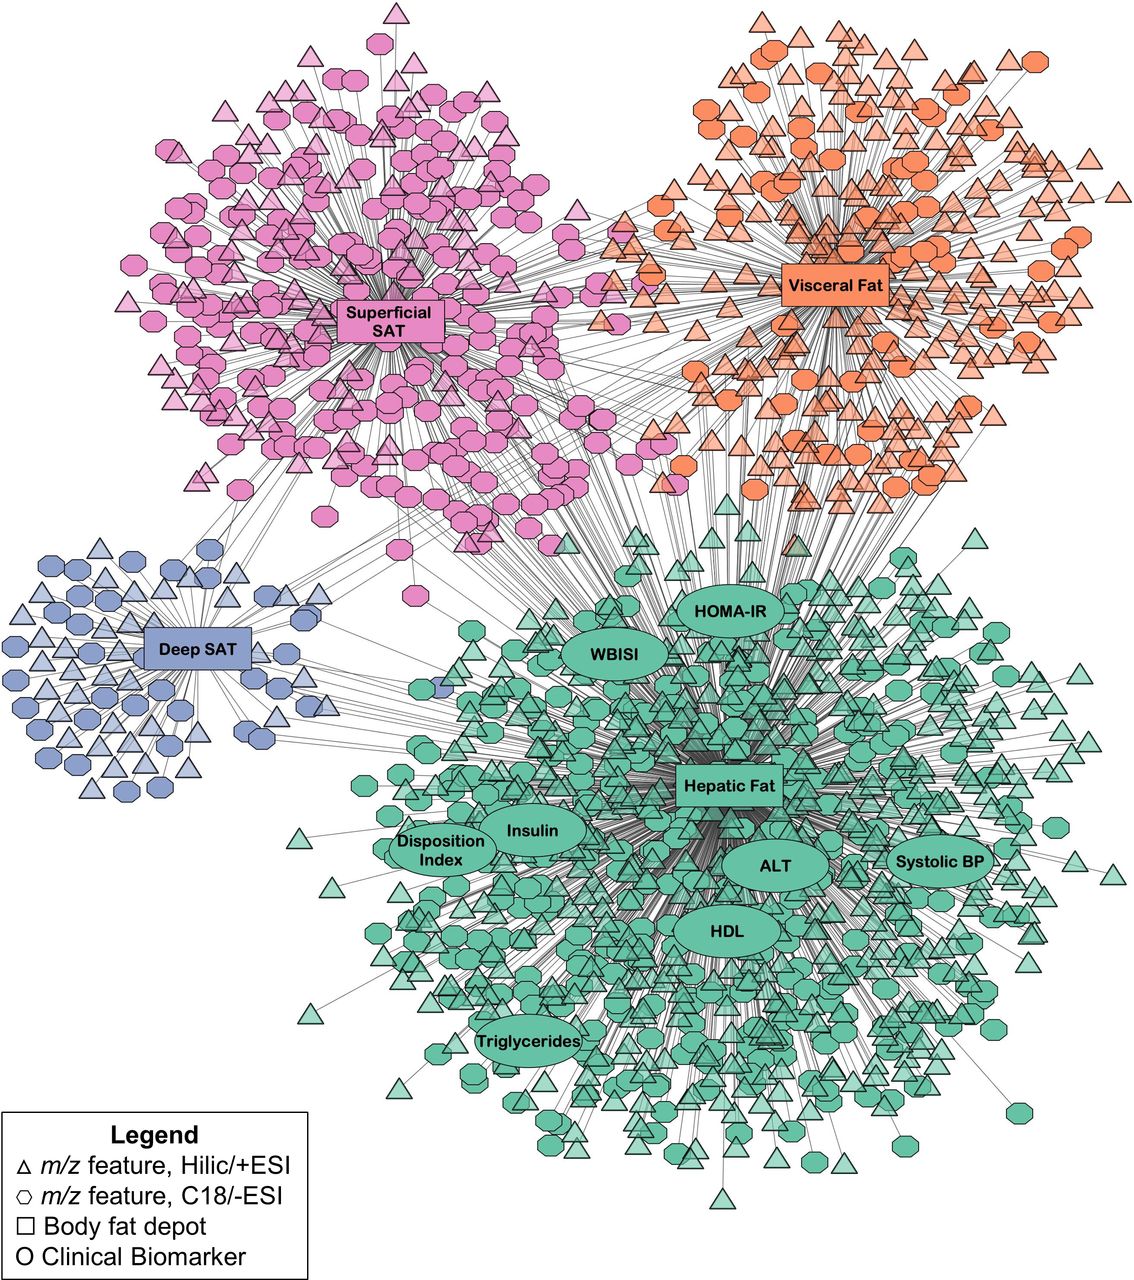
Results from the integrative network analysis of hepatic fat and abdominal fat deposition, clinical biomarkers, and plasma metabolomics data in 283 children and adolescents in the Yale Pediatric NAFLD Cohort. Communities detected by the multilevel community detection algorithm are indicated by different colors. Associations were selected by partial least squares regression based on thresholds of r|>0.15 and p<0.05. ALT, alanine aminotransferase; BP, blood pressure; ESI, electrospray ionization; HDL, high-density lipoprotein; HILIC, hydrophilic liquid interaction chromatography; HOMA-IR, homeostatic model assessment of insulin resistance; m/z, mass to charge ratio; NAFLD, non-alcoholic fatty liver disease; SAT, subcutaneous adipose tissue; WBISI, whole body insulin sensitivity index.
Hepatic fat community: additional analyses
The first community featured hepatic fat and eight clinical biomarkers: WBISI, HOMA-IR, DI, fasting insulin, high-density lipoprotein, triglycerides, alanine aminotransferase (ALT), and systolic blood pressure. MLR was used to examine whether these biomarkers were associated with square root-transformed HFF after adjusting for age, sex, race/ethnicity, BMI z-score, and the other body fat deposition variables (VAT ratio, deep SAT ratio, and superficial SAT ratio). This showed that fasting insulin, HOMA-IR, WBISI, ALT, and blood triglycerides were associated with HFF after adjusting for covariates (all Bonferroni-corrected p<0.00625), as shown in table 2.
Results from multiple linear regression of clinical biomarkers in the hepatic fat community with hepatic fat fraction
A total of 878 m/z features (539 HILIC+ and 339 C18−) also associated with hepatic fat in this community. In the pathway analysis, these features were found to be significantly enriched in a variety of AA and lipid-related pathways, as well as carnitine shuttle and purine and pyrimidine metabolism (all p<0.05; figure 3). The associations between the 878 m/z features in this community and HFF were next evaluated in MLR adjusted for the same covariates as above and, among these, a total of 703 (410 HILIC+ and 293 C18−) remained significantly associated with square root-transformed HFF (FDR-adjusted q<0.05). Subsequently, 185 were annotated or confirmed (level 2 or level 1, respectively, based on MSI criteria) to chemical matches. Online supplementary table S4 shows the B-coefficients and p-values from MLR for these annotated or confirmed m/z features.
Supplemental material

Results from pathway analysis in Mummichog of the m/z features in the hepatic fat community. Dotted vertical lines indicate p<0.05. All pathways shown in the figure were significantly enriched based on p<0.05 based on permutation testing and consisted of at least five overlapping features. There were no significantly enriched pathways meeting these predetermined thresholds for the other abdominal fat communities. ESI, electrospray ionization; HILIC, hydrophilic liquid interaction chromatography; m/z, mass to charge ratio; TCA, tricarboxylic acid.
Scatterplots visualizing the relationship between selected m/z features and HFF are also shown in figure 4. HFF was positively associated with levels of the branched-chain amino acids (BCAAs) leucine/isoleucine (M+H) and valine (M-H), the BCAA-derived C3 and C5 acylcarnitines (both M+H), the aromatic amino acids (AAAs) tyrosine and tryptophan (both M+H), alanine (M-H), and pyruvate (M-H), and negatively associated with glycine (M+2Na-H), serine (M-H) and C18 and C20 acylcarnitines (both M+H). Other key m/z features associated with hepatic fat in MLR included the tryptophan metabolite 3-hydroxyanthranilic acid (M+H, β=0.132), lactate (M-H, β=0.039), and the purine and pyrimidine metabolites uric acid (M-H, β=0.038) and dihydrothymine (M+H, β=−0.165) (all q<0.05; online supplementary table S4). Several tryptophan-related indoles, such as indoleacrylic acid (M+H) and indolelactic acid (M-H), and several phosphatidylcholines (PCs) and phosphatidylethanolamines (PEs) were also associated with hepatic fat in MLR (online supplementary table S4). Caution should be exercised in interpreting the lipid annotations due to potential isomeric/isobaric compounds.

Scatterplots with regression lines for selected m/z features associated with hepatic fat fraction in integrative network analysis and multiple linear regression. The x-axis is square root-transformed hepatic fat fraction, and the y-axis is log-transformed ion abundance of each m/z feature. All m/z features shown were annotated or identified at level 2 or level 1, respectively, based on the Metabolomics Standards Initiative criteria, to the adduct listed in parentheses. Reported β-coefficients and their p values were calculated using multivariable linear regression of hepatic fat fraction with each m/z feature adjusted for age, sex, race/ethnicity, body mass index z-score, and abdominal fats. m/z, mass to charge ratio.
To evaluate the degree to which IR may confound associations between metabolites and HFF, we added WBISI as an additional covariate in MLR, and the results are shown in online supplementary table S4. Of the 707 m/z features associated with HFF in initial MLR, 536 (294 HILIC+ and 242 C18−) remained associated with HFF with adjustment for WBISI (FDR-adjusted q<0.05), including the majority of the metabolites listed above except pyruvate, the acylcarnitines, and a subset of the indole derivatives and glycerophospholipids.
Abdominal fat communities: additional analyses
The other three communities had fewer metabolite associations. The second largest community consisted of superficial SAT ratio and 312 m/z features (97 HILIC+ and 215 C18−), the third community consisted of VAT ratio and 280 m/z features (217 HILIC+ and 63 C18−), and the fourth community consisted of deep SAT ratio and 74 m/z features (38 HILIC+ and 36 C18−). No clinical biomarkers were associated with these communities based on the predetermined thresholds and community detection algorithm. In the pathway analysis of the m/z features in these communities, there were no significantly enriched pathways with at least five overlapping features. It is possible the sparse pathway enrichment for these communities is due to their smaller size compared to the hepatic fat community. MLR analysis was performed on the m/z features in each abdominal fat community, and 225, 84, and 14 were significantly associated with log-transformed superficial SAT, VAT, and deep SAT, respectively (FDR-adjusted q<0.05). Among these discriminating features, 26 were annotated or confirmed, as summarized in online supplementary table S5. Due to the limited findings from pathway analysis and metabolite annotation for these communities, we did not attempt to interpret their metabolomic profiles further.
Supplemental material
Discussion
It is well established that individuals prone to type 2 diabetes and cardiovascular disease tend to exhibit a central obesity phenotype; however, multiple fat depots are present centrally (visceral, subcutaneous and ectopic fats). In this study, we found that key clinical biomarkers, including measures of IR and dyslipidemia, correlated more strongly with hepatic fat compared with abdominal VAT and SAT distribution. Furthermore, these associations remained significant after adjusting for confounders, including BMI z-score, underscoring the potential importance of hepatic fat as a correlate of metabolic dysfunction independent of weight status. Using HRM, we also were able to assess the systemic molecular alterations associated with hepatic and abdominal fat distribution. Aligning with the strong correlations of hepatic fat with clinical biomarkers, we found that key underlying metabolic pathways related to AA and lipid metabolism were enriched with metabolites associated with hepatic fat, offering insight into biological processes underlying hepatic fat-related metabolic dysfunction.
Differentiating the metabolic effects of hepatic and abdominal fat, especially VAT, has been challenging due to their correlated nature, but recent investigations have attempted to circumvent this using a matched case–control design. Studies in both adults3 and children4 have shown that, among participants matched on level of VAT, those with high hepatic fat have greater metabolic dysfunction, including higher IR, compared with those with low hepatic fat.3 Similarly, among adults in the Framingham Heart, hepatic fat was associated with risk of diabetes, hypertension, and dyslipidemia, even after adjusting for VAT as a covariate.30 Thus, while we cannot conclude that abdominal VAT and SAT depots are metabolically ‘benign’, the findings of our study provide validation for this prior work and support that the lipotoxic effects of hepatic fat may be more strongly and/or directly linked to IR and dyslipidemia than other central fats. This has important implications in a clinical setting, both for identifying children most at risk for early-onset metabolic dysfunction, as well as for developing disease prevention and treatment interventions.
By performing plasma HRM, we also elucidated the systemic molecular alterations that correlate with hepatic and abdominal fat distribution. Similar to the findings above, the metabolite features that correlated more strongly with hepatic fat were found to be enriched in several key metabolic pathways. Notably, higher hepatic fat was associated with a BCAA-related pattern that has been consistently reported in IR and obesity,6 31 as well as NAFLD.7 9 Several reasons may explain this finding, but recent evidence supports a disturbance in mitochondrial BCAA catabolism, versus excess intake.32 It has been shown that BCAA catabolic enzymes, such as the rate-limiting branched-chain keto-acid dehydrogenase (BCKDH), are downregulated in IR and obesity, especially in adipose tissue, and this may contribute to a rise in BCAAs, as well as AAAs, which compete for the same AA transporter.33 As proposed by others, this may result in increased BCAA oxidative flux through other tissues, such as skeletal muscle. Consistent with this, we found that hepatic fat was also associated with the BCAA-derived C3 and C5 acylcarnitines, as well as alanine, pyruvate, and lactate, which may reflect alterations in tricarboxylic acid (TCA) cycle anaplerosis/cataplerosis and gluconeogenesis secondary to substrate overload and mitochondrial stress.34
In addition, we found inverse associations glycine and serine with hepatic fat, which have also been reported with elevations in BCAAs, and may be due to glycine’s ability to conjugate acyl groups for excretion.35 Both AAs are also involved in the biosynthesis of glutathione, a key antioxidant. In adults with NAFLD, more severe disease has been associated with serine deficiency36 and a higher glutamate-serine-glycine index (glutamate/[serine+glycine]).37 Thus, altered glutathione homeostasis, which has been reported in pediatric NAFLD,38 may be an alternate explanation. Future studies will be needed to elucidate whether there is a causal relationship between these BCAA-related alterations and higher hepatic fat levels.
Several of our lipid-related findings may also be related to BCAA catabolism. For example, it has been shown that an imbalance in the kinase/phosphatase enzyme pair that regulates BCKDH can also activate ATP-citrate lyase, a key enzyme in hepatic lipid metabolism, resulting in increased malonyl coenzyme A.39 Malonyl coenzyme A is known to promote de novo lipogenesis while blocking fatty acid oxidation; therefore, this biological alteration may also explain our finding of decreased long-chain acylcarnitines with higher hepatic fat. Another lipid pathway that was enriched with metabolites associated with hepatic fat was glycerophospholipid metabolism, especially with regard to PCs and PEs. A decreased hepatic PC to PE ratio may impair cell membrane integrity,40 and was associated with NAFLD severity in adults41; whether the plasma alterations we found reflect this hepatic ratio warrants further investigation. The mammalian target of rapamycin complex 1 (mTORC1)—a downstream mediator of insulin signaling—has also been shown to regulate hepatic PC synthesis by activating cytidine triphosphate:phosphocholine cytidylyltransferase-α, the rate-limiting enzyme in the cytidine-diphosphocholine (CDP-choline) pathway for PC synthesis.42 It is possible that disrupted insulin signaling, such as with hepatic IR, could affect this pathway and impact circulating glycerophospholipid levels. Future studies using more targeted lipidomics analyses are needed to confirm these associations.
There are weaknesses and strengths to this research. As a cross-sectional study, we are unable to assess causality, and longitudinal and/or interventional studies are needed. In order to avoid the loss of potentially relevant m/z features and protect against type II error, a more lenient threshold (raw p<0.05) was used to select initial associations in the integrative network analysis.5 This may result in false positives, although we did apply an FDR adjustment in subsequent MLR in order to minimize this risk. With untargeted metabolomics, there remains a ‘bottleneck’ at the step of metabolite identification, and not all m/z features were identified. We used only one ‘omics’ platform in the present study, and complementary ‘omics’ data should be incorporated to frame these metabolic alterations within a broader systems biology context. This includes, but is not limited to, microbiomics, as the metabolite alterations we found, such as with AAAs and BCAAs,43 may be due to microbial activity. Another limitation is that we were unable to control for lifestyle factors, such as diet and physical activity, or pubertal stage. Future studies are needed to evaluate these potential confounding variables and/or effect modifiers.
This study is strengthened by the diversity of the sample, including both males and females, across different ages and racial/ethnic groups. Although independent validation studies will be needed, this diversity increases our confidence in the generalizability of the findings. There were extensive clinical assessments performed on participants, including gold standard hepatic and abdominal fat quantification by MRI and an OGTT to assess postprandial glucose and insulin metabolism, in addition to the other anthropometric and fasting laboratory assessments. The plasma metabolomics data used in this study were obtained from an optimized, high-throughput assay that included a dual chromatography system. This enabled us to perform a comprehensive assessment of the metabolome and capture a broad spectrum of metabolites. We also took several steps to minimize the risk of false annotations, including the use of a computational annotation software (xMSannotator) that employs a multilevel clustering procedure to assign confidence levels to all matches, allowing us to prioritize high-confidence putative annotations. Lastly, by using an untargeted, data-driven analytical approach, this enabled us to assess potentially novel metabolite–body fat deposition associations without a priori hypothesis, in addition to expected associations.
In summary, the findings of this study show that hepatic fat is more strongly associated with several key clinical biomarkers of CMD risk compared to abdominal fat distribution in youth, confirming several prior reports. Further, we were able to evaluate the systemic molecular pathway abnormalities, assessed by HRM, associated with hepatic fat accumulation, helping to distinguish the metabolic phenotype associated with NAFLD versus abdominal fat. These data also provided insight into potential underlying mechanisms linking hepatic fat with early-onset metabolic dysfunction. Additional studies are needed to test the directionality of these associations, as this would provide vital insights into future therapeutic targets for disease prevention and treatment, and to test whether the clinical and/or metabolomics variables we identified may be used to develop screening and/or diagnostic panels for predicting CMD risk.
References
Footnotes
Presented at This work was presented at the American Diabetes Association’s 79th Annual Scientific Sessions in 2019.
Contributors CEC conducted the metabolomics analyses and wrote the manuscript. NS and SC provided data from the parent study, and BP performed hepatic and abdominal fat calculations. VT performed the untargeted high-resolution metabolomics assay, and KL and KMM-S assisted with metabolite annotation and interpretation. KU, TY, and DPJ provided guidance on the analysis and interpretation of the metabolomics data. JAA and MPB reviewed the body composition and metabolomics methods and assisted with the interpretation of findings. MBV and NS guided the overall design of the study and provided funding for this substudy and the parent study, respectively. All authors reviewed and contributed scientific expertise to the final manuscript. CEC and MBV are the guarantors of this work and as such had full access to all the data in the study and take responsibility for the integrity of the data and the accuracy of the data analysis.
Funding This manuscript was in part supported by the National Institutes of Health’s National Institute of Environmental Health Sciences (NIEHS) (award/grant numbers P30-ES019776 and U2C-ES026560), the National Institute of Diabetes and Digestive and Kidney Disease (NIDDK) (award/grant numbers R01-DK111038, R01-DK114504, and P30DK111024), the NIH Eunice Kennedy Shriver National Institute of Child Health and Human Development (award/grant numbers R01-HD028016 and R21-HD089056), and the National Institutes of Health Office of the Director (S10 OD018006).
Competing interests MBV has consulting arrangements with Boehringer Ingelheim, Bristol Myers Squibb, Intercept, Mallinckrodt, Novo Nordisk, and Target Pharmasolutions, and research funding from Target Pharmasolutions and Bristol Myers Squibb, which are all outside of the submitted work.
Patient consent for publication Not required.
Ethics approval The parent study was approved by Yale University IRB (IRB# 1112009408), and the secondary analysis performed in this study was determined to be exempt from IRB review and approved by Emory University IRB (IRB# 00091260).
Provenance and peer review Not commissioned; externally peer reviewed.
Data availability statement The data that support the findings of this study are available from the corresponding author, upon reasonable request.