Article Text

Abstract
Objective We aimed to estimate genetic correlation, identify shared loci and test causality between leptin levels and type 2 diabetes (T2D).
Research design and methods Our study consists of three parts. First, we calculated the genetic correlation of leptin levels and T2D or glycemic traits by using linkage disequilibrium score regression analysis. Second, we conducted a large-scale genome-wide cross-trait meta-analysis using cross-phenotype association to identify shared loci between trait pairs that showed significant genetic correlations in the first part. In the end, we carried out a bidirectional MR analysis to find out whether there is a causal relationship between leptin levels and T2D or glycemic traits.
Results We found positive genetic correlations between leptin levels and T2D (Rg=0.3165, p=0.0227), fasting insulin (FI) (Rg=0.517, p=0.0076), homeostasis model assessment-insulin resistance (HOMA-IR) (Rg=0.4785, p=0.0196), as well as surrogate estimates of β-cell function (HOMA-β) (Rg=0.4456, p=0.0214). We identified 12 shared loci between leptin levels and T2D, 1 locus between leptin levels and FI, 1 locus between leptin levels and HOMA-IR, and 1 locus between leptin levels and HOMA-β. We newly identified eight loci that did not achieve genome-wide significance in trait-specific genome-wide association studies. These shared genes were enriched in pancreas, thyroid gland, skeletal muscle, placenta, liver and cerebral cortex. In addition, we found that 1-SD increase in HOMA-IR was causally associated with a 0.329 ng/mL increase in leptin levels (β=0.329, p=0.001).
Conclusions Our results have shown the shared genetic architecture between leptin levels and T2D and found causality of HOMA-IR on leptin levels, shedding light on the molecular mechanisms underlying the association between leptin levels and T2D.
- type 2 diabetes
- leptin
- genetic epidemiology
- genetic association
This is an open access article distributed in accordance with the Creative Commons Attribution Non Commercial (CC BY-NC 4.0) license, which permits others to distribute, remix, adapt, build upon this work non-commercially, and license their derivative works on different terms, provided the original work is properly cited, appropriate credit is given, any changes made indicated, and the use is non-commercial. See: http://creativecommons.org/licenses/by-nc/4.0/.
Statistics from Altmetric.com
Significance of this study
What is already known about this subject?
Both leptin levels and type 2 diabetes (T2D) are strongly associated with glycemic homeostasis.
Previous observational and genetic studies have found a strong association between leptin levels and T2D.
However, the exact mechanism of the association remains unclear.
What are the new findings?
We identified several previously unreported genetic loci that influence both leptin levels and T2D or glycemic traits.
Our MR analysis found a causal relationship between homeostasis model assessment-insulin resistance and leptin levels, suggesting that the association between leptin levels and T2D or glycemic traits may be due to both the common genetic architecture and causal effect.
A series of post-genome wide association studies functional analysis provided biologic insights into the shared genes between leptin levels and T2D or glycemic traits and found the tissues and biologic processes in which these shared genes were significantly expressed.
Transcriptome-wide association analysis (TWAS) further assessed the association of gene expression in specific tissue between leptin levels and T2D or glycemic traits and found the gene–tissue pair that was overlapped between TWAS for both leptin levels and T2D or glycemic traits.
How might these results change the focus of research or clinical practice?
Our results further elucidate the specific mechanism of the association between leptin levels and T2D or glycemic traits, suggesting that the association between leptin levels and T2D or glycemic traits may be due to both the common genetic architecture and causal effect.
The discovery of shared genes provided new predictors for identification of susceptible people.
The results of tissue analysis suggested that clinical workers should pay more attention to the complications of these tissues in T2D patients with abnormal leptin levels.
Introduction
Type 2 diabetes (T2D) is a complex and serious global disease,1 which reduces life expectancy of patients and imposes huge economic burdens on patients as well as the whole society.2 3 However, its etiology is not fully understood.
Previous convincing observational studies have reported that there was a positive association between leptin levels and T2D.4–6 More persuasive meta-analyses showed similar results. Interestingly,7–9 genome-wide association studies (GWAS) have reported some single nucleotide polymorphisms (SNPs) have effects on both leptin levels and T2D,10–12 leading us to wonder whether the association between leptin levels and T2D is due to a common genetic etiology. Besides, leptin levels and T2D may also have common risk factors that are controlled by same genes or pathways. However, no genetic study has explored the common genetic architecture between leptin levels and T2D.
Therefore, we conducted this large-scale genome-wide cross-trait meta-analysis among 254 263 participants to identify shared genetic architecture between leptin levels and T2D or glycemic traits, providing more knowledge about shared molecular mechanism of them. Furthermore, we explored the potential causality between leptin levels with T2D or glycemic traits by using bidirectional Mendelian randomization (MR) analysis.
Research design and methods
Study design
To identify the shared genetic architecture between leptin levels and T2D or glycemic traits, we conducted a large-scale genome-wide cross-trait meta-analysis. Our study consists of three parts. First, we calculated the genetic correlation of leptin levels and T2D or glycemic traits, including fasting glucose (FG), fasting insulin (FI), insulin resistance derived from fasting variables by homeostasis model assessment (HOMA-IR) and surrogate estimates of β-cell function (HOMA-β) by using linkage disequilibrium (LD) score regression analysis (LDSC). Second, we conducted a large-scale genome-wide cross-trait meta-analysis using cross-phenotype association (CPASSOC) to identify shared loci between trait pairs that showed significant genetic correlations in the first part. In the end, we carried out a bidirectional MR analysis to find out whether there is a causal relationship between leptin levels and T2D or glycemic traits.
Data sources
The GWAS summary statistics for leptin levels from Tuomas O Kilpeläinen’s study was used.13 This study performed a meta-analysis of 23 GWAS for body mass index adjusted circulating levels of leptin with 32 161 participants in total. The GWAS for T2D came from a large-scale meta-analysis including the DIAbetes Genetics Replication And Meta-analysis (DIAGRAM) Consortium (12 171 cases and 56 862 controls), the Asian Genetic Epidemiology Network Type 2 Diabetes (AGEN-T2D) Consortium (6952 cases and 11 865 controls), the South Asian Type 2 Diabetes (SAT2D) Consortium (5561 cases and 14 458 controls) and the Mexican American Type 2 Diabetes (MAT2D) Consortium (1804 cases and 779 controls).14 The GWAS summary statistics for FG, FI, HOMA-IR and HOMA-β were from the Meta-Analyses of Glucose and Insulin-related traits Consortium.12 This meta-analysis included up to 46 186 non-diabetic participants of European descent informative for FG, and up to 38 238 non-diabetic individuals informative for FI, as well as HOMA-β and HOMA-IR. More detailed information about these researches can be seen in the original publications.12–14
Statistical analysis
LD score regression analysis
LDSC was used to compute the genetic correlation between leptin levels and T2D or glycemic traits in our genome-wide genetic correlation analysis.15 This method believes that the GWAS effect size estimate for a given SNP is related to the effects of all SNPs in LD with that SNP. Thus, SNPs with higher LD scores will have higher test statistics as well.
Partitioned genetic correlation
By using partitioned LDSC,16 we further estimated the partitioned genetic correlation between leptin levels and T2D or glycemic traits in 11 functional categories, including DNase I digital genomic foot printing region, DNase I hypersensitivity sites (DHSs), fetal DHS, intron, super-enhancer, transcription factor-binding sites, transcribed regions and histone marks H3K4me1, H3K27ac, H3K4me3 and H3K9ac. This method partitions SNPs into different functional categories and calculates LD score for a given SNP to that category.
Cross-trait meta-analysis
We conducted a genome-wide cross-trait meta-analysis to identify shared loci between leptin levels and T2D or glycemic traits using CPASSOC.17 This method can integrate association evidence from summary statistics of multiple traits, either correlated, independent, continuous or binary traits, which might come from the same or different studies.17 It allows for trait heterogeneity effects, population structure and cryptic relatedness.17 Two statistics SHet and SHom were calculated by this method. Considering the heterogeneity of different traits in our study, we chose SHet as the main statistics. SNPs with PSHet <5×10⁻⁸ and trait specific p<0.05 were thought to have effects on both traits.
Tissue enrichment analysis
We used Tissue Enrich package to calculate the tissue-specific gene enrichment and find out tissue of enriched expression of shared genes between leptin levels and T2D or glycemic traits.18 The hypergeometric test is used to determine if the tissue-specific genes are enriched among the shared genes in this method. Tissue-specific genes are defined by processing RNA-Seq data from the Human Protein Atlas (HPA) and GTEx using the algorithm from the HPA.19 20
Transcriptome-wide association analysis (TWAS)
We conducted a TWAS to identify gene expression in specific tissues for each trait by using FUSION software package based on 48 GTEx (version 7) tissue expression reference weights.21 We used false discovery rate (FDR) Benjamin-Hochberg procedure to correct the p value, and FDR <0.05 was considered significant.
Over-representation enrichment analysis
We used PANTHER tool to assess over-represented enrichment of the shared genes in reactome pathways and gene ontology (GO) biologic process.22–25 False discovery rate Benjamini-Hochberg procedure was used on p values to account for multiple testing (FDR<0.05).
Fine-mapping credible set analysis
In order to make the identified regions more precise, we conducted fine-mapping credible set analysis.26–28 We extracted variants that were highly linked (r2 >0.4) with index SNP among SNPs that were closed to index SNP within 500 kb in every locus. With this method, we identified credible sets of SNPs that were 99% likely, based on posterior probability, to contain the causal disease-associated SNPs.
Colocalization analysis
We performed a genetic colocalization analysis of two potentially related phenotypes to know more about whether they share common genetic variants in a given region by coloc package,29–31and SNPs within 500 kb of the index SNP were selected for this analysis.
MR analysis
In the end, to explore the causal relationship between leptin levels and T2D or glycemic traits, we conducted a bidirectional MR analysis using two-sample MR package.32–35 MR analysis used genetic variation as the instrumental variable to explore the causal effect between two traits.36 Three basic assumptions must be met in MR analysis: (1) the genetic instruments used must be associated with the exposure of interest, (2) the genetic instruments used must not be the confounders between the examined exposure and outcome, and (3) the genetic instruments must be conditionally independent of the outcome given the exposure.36 In practice, we extracted SNPs with p<1×10⁻⁵ from the GWAS summary statistics for interested exposure as the genetic instruments to satisfy the first assumption, conducted a horizontal pleiotropy analysis to test the second assumption, and selected independent genetic instruments (r2 <0.2) to avoid violating the third assumption.
In this study, we conducted a bidirectional MR analysis. First, we tested the causal effect of T2D or glycemic traits on leptin levels. Second, we explored the causal effect of leptin levels on T2D or glycemic traits. We used four approaches to calculate the causal effect, including simple median method, weighted median method, inverse variance-weighted (IVW) method, and MR-Egger method, and chose IVW as the primary approach. Bonferroni correction was used for the p value.37 We also conducted a series of sensitivity analysis, using MR-Egger regression for horizontal pleiotropy test, Wald ratio for single SNP MR analysis, and IVW for left-one-out analysis to test the robustness of our results.35 37
Results
Genetic correlation
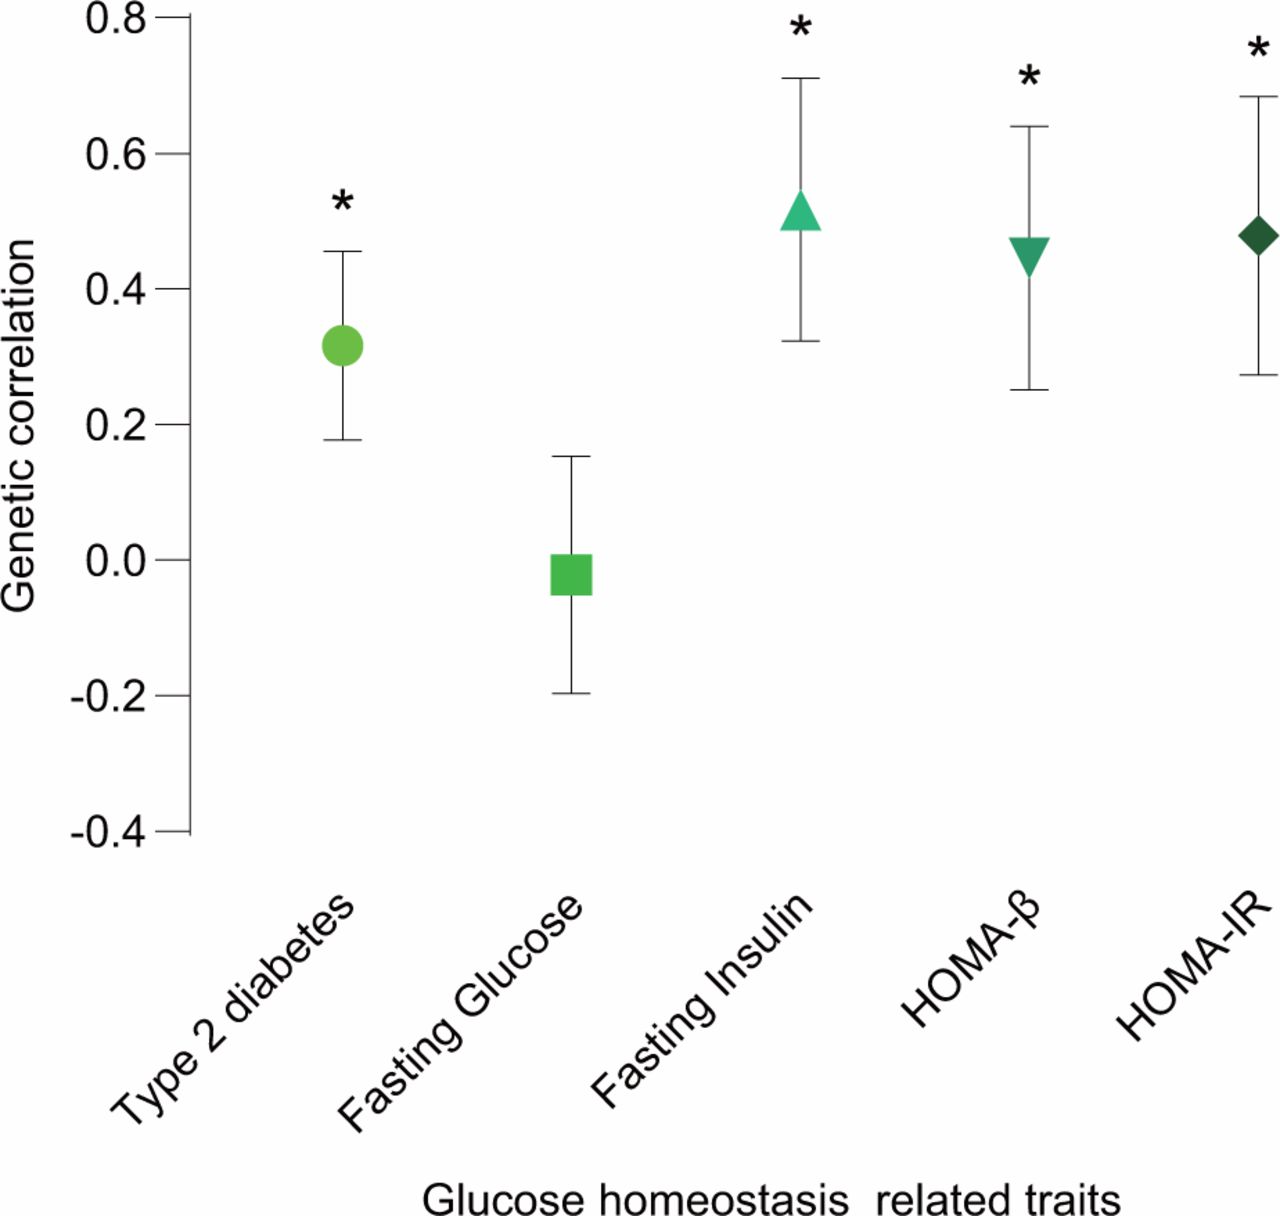
We evaluated the genetic correlation between leptin levels and T2D or glycemic traits using cross-trait LDSC. Four of the five traits showed strong and significant genetic correlations with leptin levels (figure 1 and online supplementary table 1). The strongest and most significant genetic correlation with leptin levels was found in FI (Rg=0.517, p=0.0076). HOMA-IR and HOMA-β had similar magnitude and significance genetic correlations with leptin levels (Rg=0.4785, p=0.0196 and Rg=0.4456, p=0.0214, respectively). In addition, positive genetic correlation with leptin levels was also found in T2D (Rg=0.3165, p=0.0227). However, the genetic correlation of FG and leptin levels was not significant and was close to zero.
Supplemental material

Genetic correlation of leptin levels and T2D or glycemic traits. The vertical axis represents the genetic correlation estimate; the horizontal axis represents T2D or glycemic traits. The asterisk represents significance (p<0.05); error bars represent the SE of genetic correlation estimates. HOMA-β, β-cell function; HOMA-IR, homeostasis model assessment-insulin resistance; T2D, type 2 diabetes.
Partitioned genetic correlation
In addition to the DNA sequence that directly encodes functional proteins, there are a number of regions in chromatin that play important roles in regulating gene expression. In fact, most of the significant loci found in GWAS are located in non-protein-coding regions. Thus, a better understanding of these regions may help us understand the specific mechanisms underlying the genetic association between leptin levels and T2D or glycemic traits. In order to explore the genetic correlation between leptin levels and T2D or glycemic traits in these regions, we conducted partitioned genetic correlation analysis for the trait pairs that showed significant genetic correlations above using partitioned LDSC.
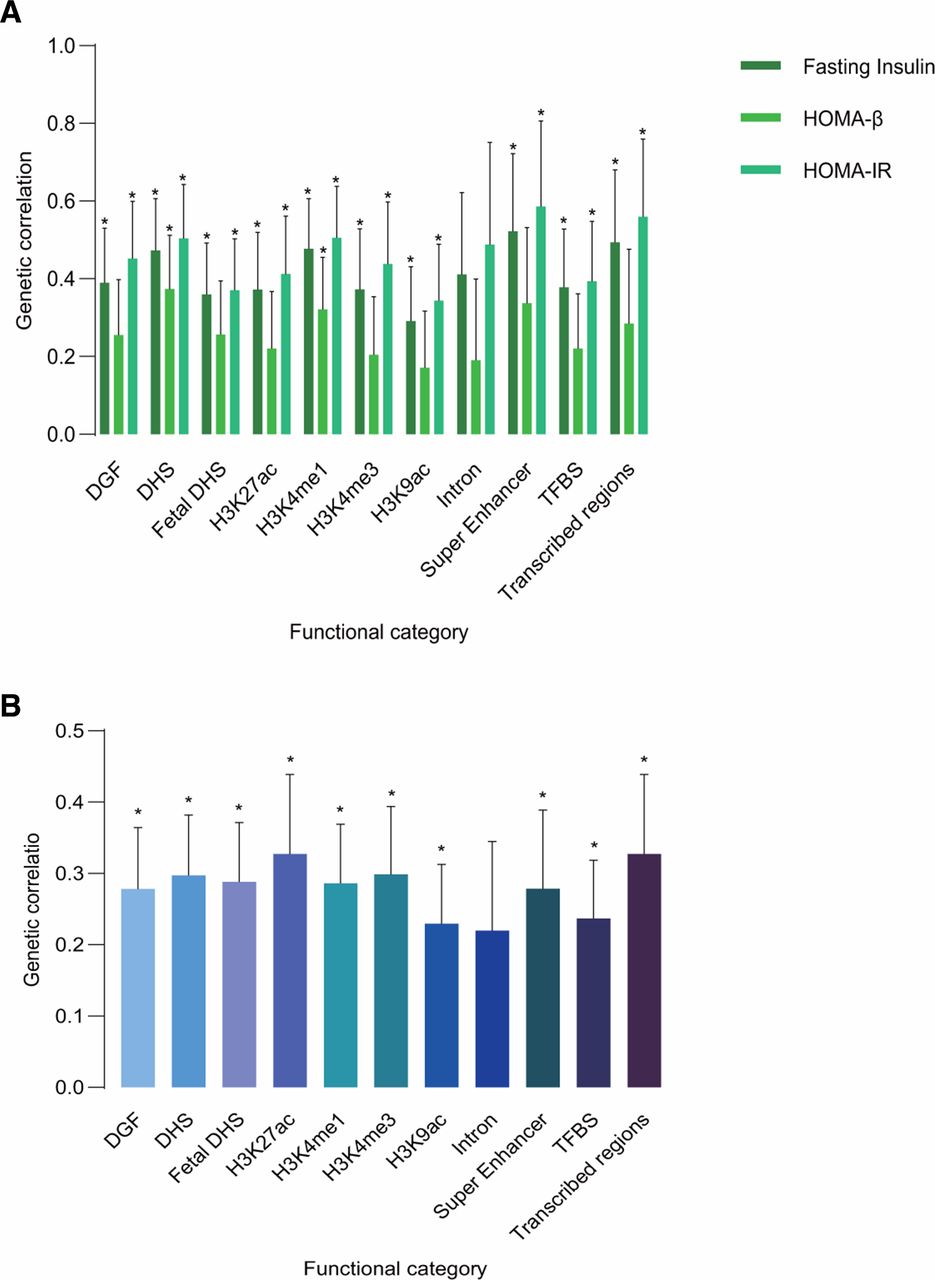
Overwhelming majority of 11 functional categories had shown significant genetic correlations, and the partitioned genetic correlations of different trait pairs showed similar patterns (figure 2 and online supplementary table 2-5). All these partitioned genetic correlations were positive. The strongest genetic correlations between leptin levels and T2D were in H3K27ac (Rg=0.3272, p=0.0034) and transcribed regions (Rg=0.3272, p=0.0034). In genetic correlation between leptin levels and FI, the strongest was found in super-enhancer (Rg=0.5217, p=0.0092), so was leptin levels and HOMA-IR (Rg=0.586, p=0.0001). Super-enhancers are large clusters of transcriptional enhancers that drive expression of genes that define cell identity.38 The highest magnitude genetic correlation between leptin levels and HOMA-β was found in DHS (Rg=0.3734, p=0.007). These observations encourage further investigations on common pathophysiology between leptin levels and T2D or glycemic traits in these specific functional categories.

Partitioned genetic correlation of leptin levels and T2D or glycemic traits. (A) Partitioned genetic correlations of leptin levels and FI, HOMA-IR and HOMA-β; (B) partitioned genetic correlation of leptin levels and T2D. The vertical axis represents the genetic correlation estimate; the horizontal axis represents functional categories. The asterisk represents significance (p<0.05); error bars represent the SE of genetic correlation estimate. DGF, DNase I digital genomic footprinting region; DHS, DNase I hypersensitivity sites; FI, fasting insulin; HOMA-β, β-cell function; HOMA-IR, homeostasis model assessment-insulin resistance; T2D, type 2 diabetes; TFBS, transcription factor-binding sites.
Cross-trait meta-analysis
Considering the strong genetic correlation between leptin levels and T2D or glycemic traits (FI, HOMA-IR and HOMA-β), we conducted genome-wide cross-trait meta-analysis to improve our power to identify shared genetic loci between them. We selected SNPs with Pmeta <5×10⁻⁸ and trait specific p<0.05 as the SNPs that had effects on both leptin levels and T2D or glycemic traits. By these standards, we identified 15 independent loci totally, of which eight loci were not genome-wide significant in trait specific GWAS for both leptin levels and T2D or glycemic traits (table 1).
Summary of the 15 genomic loci associated with leptin levels and T2D or glycemic traits in cross-trait meta-analysis
We found one overlapped locus (index SNP: rs780094). It was associated with both leptin levels and FI at the genome-wide significance level in the cross-trait meta-analysis (Pmeta=2.27×10⁻⁹) and was also identified in the genome-wide cross-trait meta-analysis of leptin/HOMA-IR (Pmeta=9.01×10⁻¹²) and leptin/T2D (Pmeta=4.37×10⁻⁸). This locus was close to gene GCKR, which encodes for a regulatory protein that inhibits glucokinase in liver and pancreatic islet cells by binding non-covalently to form an inactive complex with the enzyme.39
In addition to rs780094, we identified another 11 loci that were associated with both leptin levels and T2D. The strongest association signal was observed near to gene HHEX (index SNP: rs2488075, Pmeta=2.15×10⁻¹⁵) on chromosome 2. Gene HHEX was a typical risk factor for T2D,40 but there has been no study that shows its association with leptin levels. The second strongest locus was rs2972144 (Pmeta=1.77×10⁻¹²), located near to the IRS1 locus, which is the one of the most important representatives of the IRS protein family and critical nodes in insulin/IGF1 signaling.39
In the genome-wide cross-trait meta-analysis of leptin levels and HOMA-β, we found one locus (index SNP: rs1402837, Pmeta=1.33×10⁻¹⁵) close to gene G6PC2 was shared between both traits. This gene encodes an enzyme belonging to the glucose-6-phosphatase catalytic subunit family. These enzymes are part of a multicomponent integral membrane system that catalyzes the hydrolysis of glucose-6-phosphate, allowing the release of glucose into the bloodstream.41
In summary, our cross-trait results suggest that the overall strong positive genetic correlation between leptin levels and T2D or glycemic traits is driven by these identified shared genetic loci.
Tissue enrichment analysis
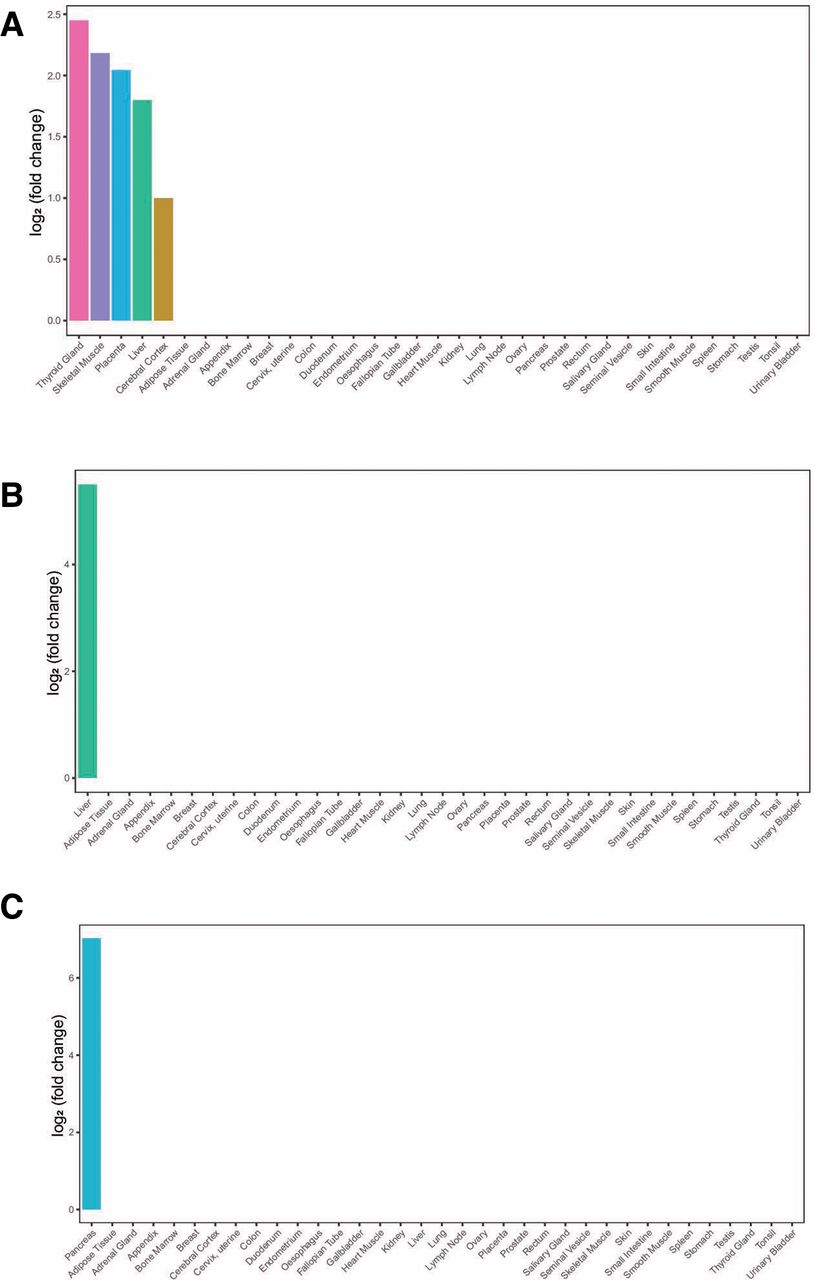
To test whether the identified shared genes between leptin levels and T2D or glycemic traits are over-represented by enriched expression in the disease-relevant tissue, we calculated the tissue-specific gene enrichment using tissue-specific genes from RNA-Seq data of the HPA and GTEx.19 20We found that shared genes of leptin levels and T2D had five enriched tissues, including thyroid gland, skeletal muscle, placenta, liver and cerebral cortex. Shared gene of leptin levels and FI was enriched in liver, so as leptin levels and HOMA-IR, and shared genes of leptin levels and HOMA-β were enriched in pancreas (figure 3).
Tissue enrichment analysis. (A) Tissue enrichment analysis result of shared genes between leptin levels and T2D; (B) tissue enrichment analysis result of shared genes between leptin levels and FI/HOMA-IR; (C) tissue enrichment analysis result of shared genes between leptin levels and HOMA-β. The vertical axis illustrates the logarithm of tissue expression enrichment fold change based on two. The horizontal axis illustrates 35 independent tissue types. FI, fasting insulin; HOMA-β, β-cell function; HOMA-IR, homeostasis model assessment-insulin resistance; T2D, type 2 diabetes.
Transcriptome-wide association analysis
In order to assess the association of gene expression in specific tissue between leptin levels and T2D or glycemic traits, we conducted TWAS analysis. A total of 19 gene–tissue pairs were significantly associated with leptin levels after Benjamini-Hochberg correction, in addition to 254 gene–tissue pairs with T2D, 14 gene–tissue pairs with FI, 6 gene–tissue pairs with HOMA-IR and 13 gene–tissue pairs with HOMA-β (online supplementary tables 6-10). Most associations were found in nerve, brain, and testis. Of them, AARSD1-Esophagus Mucosa gene–tissue pair was overlapped between TWAS for both leptin levels and HOMA-β.
Over-representation enrichment analysis
To understand the biologic insights of the shared loci, we conducted an analysis of GO biologic process and Reactome pathway. Shared genes between leptin levels and T2D were significantly enriched in carbohydrate homeostasis, negative regulation of peptide hormone secretion, regulation of insulin secretion biologic processes (online supplementary table 11), in addition to defective ABCC8 causing hypoglycemias and hyperglycemias, ATP sensitive potassium channels pathways (online supplementary table 12). However, there was no significant enriched biologic process and Reactome pathways shared between leptin/FI, leptin/HOMA-IR and leptin/HOMA-β because of the small numbers of shared genes.
Fine-mapping and colocalization analysis
In order to make the identified shared regions more precise and assess whether leptin levels and T2D or glycemic traits share common genetic variants in given regions, we conducted fine-mapping and colocalization analysis. A list of a credible set of SNPs that were 99% likely to contain the causal disease-associated SNPs for each of the 15 shared loci is shown in online supplementary table 13. A colocalization analysis showed that one locus (index SNP: rs780094) contained shared causal variant of leptin levels and T2D, in addition to one locus (index SNP: rs780094) for leptin/HOMA-IR and one locus (index SNP: rs1402837) for leptin/HOMA-β (online supplementary table 14).
Mendelian randomization
We conducted a bidirectional MR analysis to investigate the causal relationship between leptin levels and T2D or glycemic traits (FG, FI, HOMA-IR, and HOMA-β) (table 2). In the exploration of the causal effect of T2D or glycemic traits on leptin levels, 121, 66, 12, 14 and 27 genetic variants were used as instruments for T2D, FG, FI, HOMA-IR and HOMA-β, respectively (online supplementary tables 15-19). In the detection of the causal effect of leptin levels on T2D or glycemic traits, we used 22 genetic variants for leptin (online supplementary tables 20-24). MR-Egger regression analysis showed that all the results we obtained were not affected by horizontal pleiotropy.
The bidirectional MR analysis of leptin levels and T2D or glycemic traits
We found that 1-SD increase in HOMA-IR was causally associated with a 0.329 ng/mL increase in leptin levels (β=0.329, p=0.001), and a 1 pmol/L increase in FI was causally associated with a 0.187 ng/mL increase in leptin levels (β=0.187, p=0.017), but this significance disappeared after Bonferroni correction. However, T2D, FG, and HOMA-β had no causal effect on leptin levels. Besides, we did not observe any significant causal effect in the detection of the causal effect of leptin levels on T2D or glycemic traits. Sensitivity analysis showed that our results were reliable and were not affected by horizontal pleiotropy or outliers (table 2, online supplementary figure 1-4).
Discussion
To our knowledge, this is the first study to identify shared genetic architecture and casual relationship between leptin levels and T2D or glycemic traits in non-diabetic subjects. We used six well-powered GWAS summary statistics and found strong genetic correlations between leptin levels and T2D, FI, HOMA-IR, and HOMA-β, indicating the phenotypic association between leptin levels and T2D or these glycemic traits may be due to common genetic architecture. Partitioned genetic correlation analysis showed similar results, and different trait pairs had similar patterns, emphasizing the role of these non-protein coding functional categories in the genetic correlation between leptin levels and T2D or glycemic traits.
We identified 12 shared loci between leptin levels and T2D, 1 shared locus between leptin levels and FI, 1 shared locus between leptin levels and HOMA-IR, and 1 shared locus between leptin levels and HOMA-β through our large-scale genome-wide cross-trait meta-analysis. The detection of these shared genetic loci can be used as a predictor of abnormal leptin levels as well as the occurrence of T2D or abnormal glycemic traits. Among them, we newly identified eight loci that did not achieve genome-wide significance in trait-specific GWAS summary statistics, demonstrating the great power of our cross-trait meta-analysis.
Our study showed the significance of several genes rarely reported in previous GWAS for leptin levels or T2D or glycemic traits, including SPC25, G6PC2, NCR3LG1, SYN2, and ABCC8. Gene SPC25 and G6PC2 were mapped by the same locus (index SNP: rs1402837), which had a great probability (95%) of having shared causal variants of leptin levels and HOMA-β. Gene G6PC2 is enriched in pancreas and acts as a negative regulator of basal glucose-stimulated insulin secretion by hydrolyzing G6P and thereby opposing the action of the glucose sensor, glucokinase.42 However, little has been reported about the association ofG6PC2 and leptin levels. It may affect leptin levels by raising blood glucose and increasing fat content or by some function-unknown transcriptome,42 43 which deserves in-depth study. Gene NCR3LG1 (index SNP: rs5215), also known as B7H6, was the third strongest shared gene of leptin levels and T2D. It plays an important role in Natural Killer (NK) cells mediated immune responses and is thought to be involved in tumor progression of various types of human cancers.44–46 Our results indicate that patients with low leptin levels and T2D should be paid more attention to their immune system.
In addition, our results also highlighted the importance of gene GCKR (index SNP: rs780094), which was identified by the cross-trait meta-analysis of three traits pairs (leptin/FI, leptin/HOMA-IR, and leptin/T2D), to both leptin levels and T2D or glycemic traits. Our colocation analysis also showed that the probability of this locus containing shared causal variants of leptin levels and HOMA-IR was up to 95%. Gene GCKR encodes a regulatory protein that inhibits glucokinase in liver and pancreatic islet cells by binding non-covalently to form an inactive complex with the enzyme.39
Our post-GWAS functional analysis provided biologic insights into the shared genes between leptin levels and T2D or glycemic traits. Tissue enrichment analysis showed shared genes were enriched in several tissues, including pancreas, thyroid gland, skeletal muscle, placenta, liver and cerebral cortex. These findings provide some clues for the study of leptin production and signal transduction in the peripheral tissues47 48 and also suggest that clinicians need to pay more attention to the pathological changes in these tissues in diabetic patients with low leptin levels.
Our TWAS analysis identified 19 gene–tissue pairs associated with leptin levels (after Benjamini-Hochberg correction), in addition to 254 gene–tissue pairs with T2D, 14 gene–tissue pairs with FI, 6 gene–tissue pairs with HOMA-IR, and 13 gene–tissue pairs with HOMA-β. Of them, AARSD1-Esophagus Mucosa gene–tissue pair was overlapped between leptin levels and HOMA-β. Previous studies have shown that leptin levels are associated with Barrett’s esophagus significantly.49–51 However, little is understood about the biologic mechanisms between leptin and the carcinogenic pathway of esophageal adenocarcinoma.52 Our TWAS results indicated that the association between leptin and Barrett’s esophagus might be mediated bythe function of gene AARSD1 and COQ7 on esophageal mucosa, and this process might also affect the function of β cells. Patients with congenital low leptin level and β-cell dysfunction should properly increase their esophageal examination.
Our exploratory bidirectional MR analysis found significant causal effect of HOMA-IR on leptin levels (since few SNPs achieved genome-wide significance in the original GWAS study, in order to obtain valid and reliable instrumental variables for MR analysis, we set the p value threshold to 1×10⁻⁵, which has been widely used in previous MR studies). This suggests that the genetic correlation between leptin levels and HOMA-IR may be due to both pleiotropy and causality. However, we did not find significant causal effect between leptin levels and T2D or HOMA-β, indicating that their association is largely due to a common genetic architecture.
In addition to the common genetic architecture between leptin levels and T2D or glycemic traits, environmental and behavioral factors also play important role in their comorbidity. Studies have confirmed that neonatal nicotine exposure and overfeeding can cause insulin and leptin resistance rapidly.53 54 However, fish oil konjac mannan oligosaccharides was able to improve insulin and leptin resistance.55
Our study has many strengths. First, this is the first study to identify shared genetic architecture between leptin levels and T2D or glycemic traits. We used six well-powered GWAS results with 300 449 participants in total and found strong positive genetic correlation between leptin levels and T2D or glycemic traits. Moreover, we identified 15 shared loci, taking more clear insights into the shared genetic architecture between leptin levels and T2D or glycemic traits. Second, our enrichment analysis found shared genes were enriched in several tissues and biologic processes. This is helpful to further understand the role of leptin in the peripheral tissues and its association with T2D or glycemic traits, which have not been very clear until now. In addition to enrichment analysis, we conducted TWAS to integrate GWAS and gene expression datasets to identify gene–trait associations. The overlapped gene–tissue pairs gave more suggestions to possible shared mechanism. Last but not least, we used CPASSOC package to conduct cross-trait meta-analysis. This method is quite general and can be applied to a wide range of data and study designs compared with a fixed or random effect meta-analysis, the cross-phenotype meta-analysis, the linear combination of univariate test statistics, the trait-based association test, the scaled marginal model and so on.17 In contrast to the subset-based meta-analysis, CPASSOC is computationally much faster and can also allow us to see whether the association evidence is contributed by only a subset of the traits.17
Of course, our study also has some limitations. Our GWAS summary statistics came from meta-analysis studies that brings higher power with reduced homogeneity. The genomic control were 1.046 for leptin levels, 1.05 for T2D, 1.041 for FI, 1.04 for HOMA-IR, 1.046 for HOMA-β, and 1.05 for FG.12–14 However, simulations have confirmed that our cross-trait meta-analysis method CPASSOC can control population structure and cryptic relatedness very well.17 Second, the sample size of the original trait specific GWAS limited our study power. More samples are needed for more powerful results. To overcome this shortcoming and take advantage of the benefits of each method, we used different methods to analyze the shared genetic architecture at both SNP level and gene level. Third, in addition to FI and FG, we used HOMA-IR and HOMA-β to assess insulin resistance and β-cell function. Compared with other measures, these two indicators are less powerful. However, studies have shown a strong significant correlation between these two measures and other better performed measures,56 57 and these two methods are simpler to operate and are more suitable for large-scale epidemiological studies. Besides,we do not have proper data for replication analysis. We will conduct replication analysis in the future, if appropriate GWAS summary statistics are available.
In the present study, we found strong positive genetic correlation and identified 15 shared loci between leptin levels and T2D or glycemic traits (FI, HOMA-IR, and HOMA-β), taking clear insights into the shared genetic architecture between them. A series of post-GWAS analysis showed us possible mechanisms by which shared genes affect leptin levels and T2D or glycemic traits and suggested the possible lesions in some tissues in T2D patients with abnormal leptin levels. MR analysis also detected casual effect of HOMA-IR on leptin levels. All these findings help us understand the association between leptin levels and T2D or glycemic traits more clearly. This will deepen our knowledge of human blood glucose regulatory network and contribute to further laboratory investigation and clinical studies.
References
Footnotes
Contributors All authors designed the study. XW performed the statistical analysis. XW wrote the manuscript. All authors helped interpret the data, reviewed and edited the final paper and approved the submission.
Funding The study was supported by grants from the Peking University Start-up Grant (BMU2018YJ002), High-performance Computing Platform of Peking University and Beijing Technology and Business University Grant: 88 442Y0033.
Disclaimer The funding organization had no role in the preparation of the manuscript.
Competing interests None declared.
Patient consent for publication Not required.
Provenance and peer review Not commissioned; externally peer reviewed.
Data availability statement Data are available in a public, open access repository. All data relevant to the study can be found in references and supplementary information.