Article Text

Abstract
Introduction Hepatic insulin clearance (HIC) is an important pathophysiology of type 2 diabetes. HIC was reported to decrease in patients with type 2 diabetes and metabolic syndrome. However, hyperglycemia was suggested to enhance HIC, and it is not known whether poorly controlled diabetes increases HIC in patients with type 2 diabetes. We investigated whether HIC was increased in patients with poorly controlled diabetes, and whether HIC was associated with insulin resistance and incretins.
Research design and methods We performed a meal tolerance test and the hyperinsulinemic–euglycemic clamp in 21 patients with type 2 diabetes. We calculated the postprandial C-peptide area under the curve (AUC)-to-insulin AUC ratio as the HIC; measured fasting and postprandial glucagon-like peptide-1 (GLP-1), glucose-dependent insulinotropic polypeptide (GIP) and glucagon levels and analyzed serum adiponectin and zinc transporter-8 (ZnT8) gene polymorphism.
Results The HIC significantly correlated with glycated hemoglobin (HbA1c) (r_S=0.58, p<0.01). In patients with high HIC above the median of 6.5, the mean HbA1c was significantly higher compared with low HIC below the median. Homeostatic model assessment (HOMA)-beta (r_S=−0.77, p<0.01) and HOMA-IR (r_S=−0.66, p<0.005) were correlated with HIC. The M/I value in the clamp study was correlated with HIC. GLP-1-AUC and GIP-AUC were not correlated with HIC. Glucagon-AUC was negatively correlated with HIC, but there were no significant differences between the high and low HIC groups. Adiponectin was positively correlated with HIC. The ZnT8 gene polymorphism did not affect HIC.
Conclusions These results suggest that HIC was increased in patients with high HbA1c type 2 diabetes, low insulin secretion, low insulin resistance and high adiponectin conditions.
- insulin
- clearance and action
- type 2 diabetes
- insulin clamp
This is an open access article distributed in accordance with the Creative Commons Attribution Non Commercial (CC BY-NC 4.0) license, which permits others to distribute, remix, adapt, build upon this work non-commercially, and license their derivative works on different terms, provided the original work is properly cited, appropriate credit is given, any changes made indicated, and the use is non-commercial. See: http://creativecommons.org/licenses/by-nc/4.0/.
Statistics from Altmetric.com
Significance of this study
What is already known about this subject?
Hepatic insulin clearance (HIC) was reported to decrease in patients with type 2 diabetes and metabolic syndrome; however, hyperglycemia was suggested to enhance HIC, and it is not known whether poorly controlled diabetes increases HIC in patients with type 2 diabetes.
What are the new findings?
Hepatic insulin clearance was increased in patients with high glycated hemoglobin type 2 diabetes.
Hepatic insulin clearance was increased in patients with low insulin secretion condition.
Hepatic insulin clearance was increased in patients with low insulin resistance condition.
Hepatic insulin clearance was increased in patients with high adiponectin condition.
How might these results change the focus of research or clinical practice?
Postprandial insulin levels in patients with poorly controlled type 2 diabetes should be interpreted with caution.
We suggest that postprandial C-peptide levels should be measured in patients with poorly controlled type 2 diabetes to determine their ability to secrete insulin.
Introduction
The pathophysiology of type 2 diabetes is decreased insulin secretion and insulin resistance in various tissues.1 Hepatic insulin clearance (HIC) is a new and important pathophysiology of hyperinsulinemia, metabolic syndrome and type 2 diabetes.2 Some studies reported that HIC was decreased in patients with type 2 diabetes.3 However, this study was performed in subjects with an impaired glucose tolerance level, and it is not known whether poorly controlled diabetes increases HIC in patients with type 2 diabetes.
Another study suggested that hyperglycemia enhances HIC.4 This study showed that the humans with the solute carrier family 30-member 8 (SLC30A8) risk allele and zinc transporter-8 (ZnT8) knockout mice have increased HIC, which was assessed using the C-peptide-to-insulin ratio, and postprandial hyperglycemia.4 The SLC30A8 gene is a disease susceptibility gene in patients with type 2 diabetes.5 SLC30A8 encodes ZnT8, which delivers zinc ions from the cytoplasm into insulin granules.6 These results suggested that the SLC30A8 gene is important for HIC. ZnT8 expression is downregulated in the early stage of diabetes in mice.7 These results suggest that many patients with diabetes with hyperglycemia have dysregulated insulin clearance.
Moreover, another study reported that glucagon-like peptide-1 (GLP-1) protects HIC in mice,8 but it is not known whether GLP-1 protects HIC in patients with poorly controlled type 2 diabetes.
We investigated whether HIC was increased in patients with poorly controlled diabetes, and evaluated whether HIC was associated with insulin resistance using the glucose clamp test. We also analyzed postprandial GLP-1, glucose-dependent insulinotropic polypeptide (GIP), glucagon and adiponectin levels and SLC30A8 gene polymorphism.
Materials and methods
Subjects
Twenty-one patients with type 2 diabetes participated in this study at Tottori University Hospital between 2013 and 2017. Type 2 diabetes was diagnosed using the WHO criteria.9 Patients with pancreatic disease, viral hepatitis, liver cirrhosis, renal failure or those taking diabetogenic medications such as corticosteroids were excluded from this study. All participants were on diet therapy alone, and all were of Japanese ethnicity. This study had a cross-sectional design. The sample size was planned to be over 20 subjects, and the subjects were divided into the following two groups with 10 subjects in each group: high or low HIC.
Meal tolerance test
The participants attended our hospital after fasting overnight for at least 12 hours. The participants ate a test meal that was devised by the Japan Diabetes Society (460 kcal/1882 kJ; 50% carbohydrate, 15% protein, 35% fat and 1.6 g salt).10 We measured plasma glucose, serum insulin and serum C-peptide at 0, 30, 60 and 120 min after the test meal. We measured plasma glucose using the glucose oxidase method, and serum insulin and C-peptide levels using chemiluminescent immunoassays (human insulin and C-peptide chemiluminescent immunoassay kits; Kyowa Medix, Tokyo, Japan). We measured HbA1c using high-performance liquid chromatography. In accordance with the Japanese Clinical Practice Guidelines for Diabetes that were created by Japan Diabetes Society, we considered HbA1c >8% to represent poor glycemic control.11 We converted HbA1c percentage values into the International Federation of Clinical Chemistry values (mmol/mol) using the HbA1c converter from the National Institutes of Diabetes and Digestive and Kidney Diseases.12
Insulin resistance was calculated as follows: homeostatic model assessment insulin resistance (HOMA-IR)13=[fasting plasma glucose (FPG) (mmol/L)]×[fasting plasma insulin (pmol/L)]/135.
HOMA of beta cell function (HOMA-beta)={20×[fasting plasma insulin (pmol/L)]}/{[FPG (mmol/L)]−3.5}.13
HOMA-IR did not show a normal distribution, so we also calculated log HOMA-IR.
Insulinogenic index={[insulin (pmol/L) at 30 min]−[insulin (pmol/L) at 0 min]}/{[glucose (mmol/L) at 30 min]−[glucose (mmol/L) at 0 min]}.14
HIC was calculated as follows: ratio of the incremental areas under the meal tolerance test (MTT) curve (area under the curve (AUC)) C-peptide 0–120 min/AUC insulin 0–120 min).14 The AUC was calculated using the trapezoidal method.
Early phase C-peptide secretion was calculated from the C-peptide-AUC0–30 (AUC C-peptide 0–30 min).15–17 We also calculated C-peptide-AUC0–120 (AUC C-peptide 0–120 min).
An ELISA kit was used to measure plasma adiponectin levels (human adiponectin ELISA kit, 410614, Otsuka, Tokyo, Japan).
GLP-1, GIP and glucagon assays
The serum samples were obtained using a blood collection tube containing dipeptidyl peptidase-4 inhibitor (BD P800, BD Japan, Tokyo, Japan). Ethanol and solid-phase extractions were performed,18 and intact GLP-1 levels were measured using a GLP-1 (active) ELISA (Catalog Number EGLP-35K; Merck Millipore, Darmstadt, Germany). The active GIP was measured using the Human GIP, Active form Assay Kit (Catalog Number 27201, IBL, Gunma, Japan). Glucagon levels were measured using a glucagon ELISA (Catalog Number 10-1271-01 Mercodia, Uppsala, Sweden).
Hyperinsulinemic–euglycemic clamp
We performed the glucose clamp test as previously reported.19 Briefly, the hyperinsulinemic–euglycemic clamp was performed using an artificial endocrine pancreas (STG 55; Nikkiso, Shizuoka, Japan) to evaluate insulin sensitivity. We used the protocol involving a primed constant infusion of insulin (100 mU/m2/min) and maintained the plasma glucose levels at 5.2 mmol/L (95 mg/dL). Based on previous studies, this method achieved a steady-state plasma insulin level of 1200 pmol/L in patients with type 2 diabetes.20 The steady-state glucose infusion rate (GIR) from 90 to 120 min was measured; the mean GIR during this time was defined as the glucose disposal rate (GDR), which is used as a marker of peripheral insulin sensitivity. We also calculated the M/I ratio as a measure of the quantity of glucose metabolized per unit of plasma insulin concentration, and we defined the M value as the GDR and the I value as the steady state insulin concentration.21 For convenience of data expression, we multiplied the M/I ratio by 1200.
Zn34 gene analysis
The SLC30A8 risk allele, rs13266634, was assessed using the PCR single-strand conformation polymorphism method after DNA sequencing.22 We divided the patients into non-risk allele (T/C and T/T, n=13) and risk allele (C/C, n=8) groups.4
Genomic DNA was obtained from peripheral blood leukocytes using proteinase K digestion and phenol/chloroform extraction. The PCR mixture contained genomic DNA as a template, each primer, dNTPs, AmpliTaq Gold (PE Biosystems, Tokyo, Japan) and supplemented buffer. PCR was performed under the following conditions: 5 min at 95°C and then amplification for 35 cycles of 1 min at 95°C, 1 min at 60°C and 1 min at 72°C in a thermal cycler. The products were separated on 2% agarose gel to confirm their size.
DNA sequencing
A direct sequence reaction was performed using an ABI PRISM BigDye Terminator Cycle Sequencing Kit, and the sequencing samples were analyzed using an ABI PRISM 310 Genetic Analyzer (PE Biosystems). Sequence data were analyzed using the software package ALF (Pharmacia, Tokyo, Japan) and GENETYXMAC software (Software Development, Tokyo, Japan).
Statistical analysis
Data are expressed as the mean±SD. We determined correlations between parametric clinical variables and HIC using Spearman’s correlation analysis. We defined the threshold of high or low HIC as the median HIC value. We conducted a power analysis to compare the low HIC and high HIC groups using an EZR calculator.23 We assessed differences in the mean value of clinical parameters between high HIC and low HIC participants using the Mann-Whitney U test. The χ2 test was used for categorical comparisons of sex data.
Values of p<0.05 were considered to be statistically significant. SPSS software V.26.0 (SPSS, Chicago, Illinois, USA) was used for all analyses.
Results
Participant characteristics are shown in table 1. The mean HIC was 7.7±3.4.
Participant characteristics
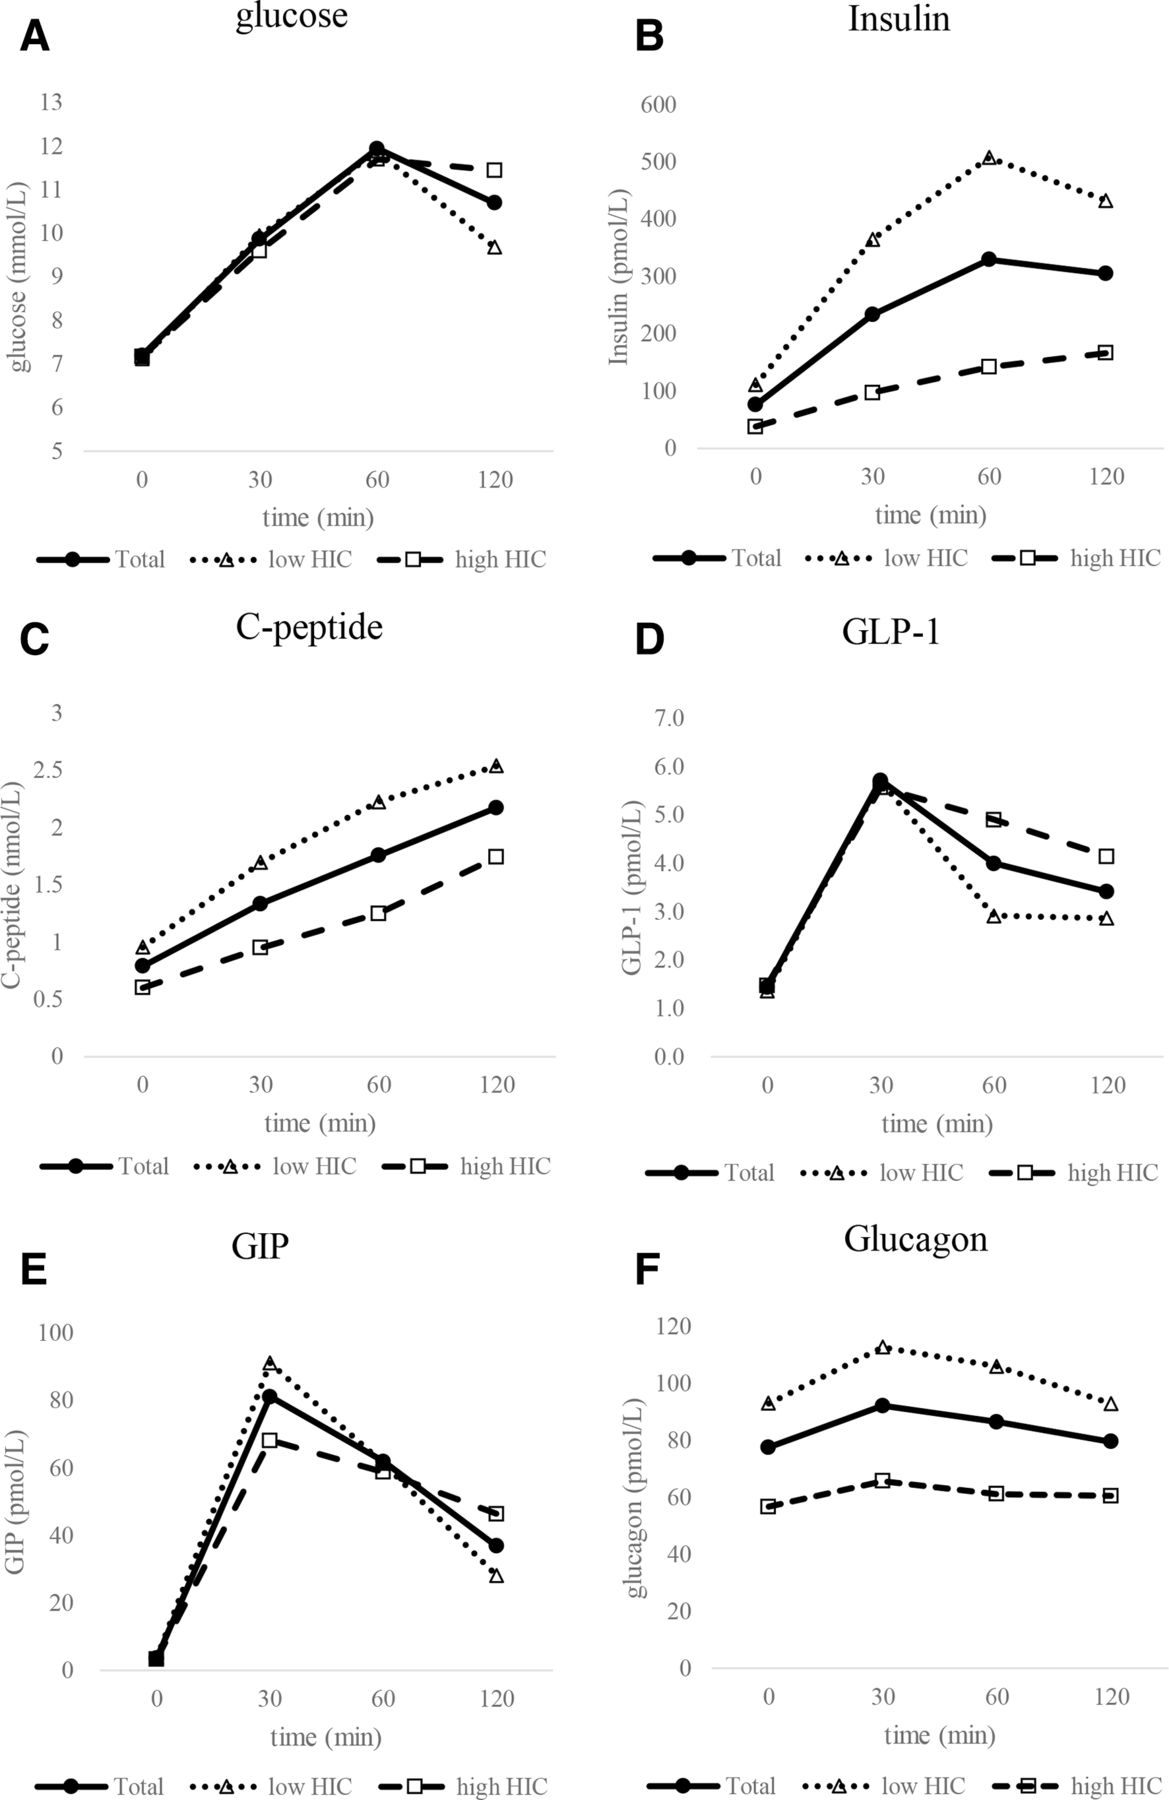
The MTT results are shown in figure 1. The HIC was significantly correlated with HbA1c (r_S=0.58, p<0.01; table 2).
The meal tolerance test (MTT) results. (A) Glucose levels after the MTT, (B) insulin, (C) C-peptide, (D) glucagon-like peptide-1 (GLP-1), (E) glucose-dependent insulinotropic polypeptide (GIP) and (F) glucagon. Black circles represent the data for all subjects, white triangles indicate low hepatic insulin clearance (HIC) subjects, and white squares indicate high HIC subjects.
Correlation coefficients between the hepatic insulin clearance and clinical parameters
The BMI was also correlated with HIC. Age, FPG, postprandial glucose (PPG) 2 hours, aspartate aminotransferase and alanine aminotransferase were not correlated with HIC, but gamma-GTP was correlated with HIC. HOMA-beta was significantly correlated with HIC (r_S=−0.77, p<0.01), and the insulinogenic index was correlated with HIC (r_S=−0.70, p<0.001). C-peptide-AUC0–30 and C-peptide-AUC0–120 were correlated with HIC (r_S=−0.49, p<0.05; r_S=−0.52, p<0.05, respectively). HOMA-IR was correlated with HIC (r_S =−0.66, p<0.005). Log HOMA-IR showed an equal correlation compared with HOMA-IR. The GDR was not correlated with HIC in the clamp study (r_S=0.27, p=0.23), but the M/I value was significantly correlated with HIC (r_S=0.46, p<0.05). GLP-1-AUC and GIP-AUC were not correlated with HIC, but glucagon-AUC was correlated with HIC. Adiponectin was significantly correlated with HIC.
The overall median HIC value was 6.5. The mean HIC in the low HIC group was 5.20±1.05, and the mean HIC in the high HIC group was 10.75±3.35. The difference between the mean HIC in the low and high HIC groups was 5.75±2.29. We conducted a power analysis of the statistical test that was used to compare the low and high HIC groups. Assuming that the difference in the means was 5.75 and the SD was 2.29, the estimated power was >99.9%. In patients with a high HIC above the median, the mean HbA1c was significantly higher compared with patients with a low HIC below the median (8.10% vs 7.10%, p<0.01; table 3).
Comparison between low and high hepatic insulin clearance
The mean BMI, gamma-GTP, HOMA-beta, insulinogenic index, C-peptide-AUC0–30, C-peptide-AUC0–120 and HOMA-IR in the low HIC group were significantly higher, and the M/I value and adiponectin were significantly lower, compared with those of the high HIC group (table 3). The mean PPG in low HIC group was nearly significantly lower compared with that of high HIC group (p=0.06). The mean glucagon AUC in low HIC group was also nearly significantly higher compared with that of high HIC group (p=0.09). There was no significant sex and duration difference between high and low HIC groups.
Seven subjects had a drinking habit, and 14 subjects did not have a drinking habit. We compared the mean gamma-GTP level of each group, and there was no significant difference between each group. However, the non-drinker group had higher gamma-GTP levels compared with the drinker group (drinker 42.6±24.2 vs non-drinker 60.3±59.6, p=0.42).
There were three subjects with the SLC30A8 risk allele in the low HIC group and three of these subjects in the high HIC group. There was no significant difference in the mean HIC between the SLC30A8, rs13266634 risk group and the low-risk group (8.24 vs 8.15, p=0.96).
Discussion
This study showed that HIC was increased in patients with high HbA1c type 2 diabetes, especially in patients with HbA1c >8%. The HIC was significantly correlated with HbA1c. The mean HbA1c of the high HIC group was significantly higher compared with that of the low HIC group below the median. Previous studies reported that HIC was decreased in patients with type 2 diabetes and metabolic syndrome. However, the glucose levels in these studies were mild, with fasting plasma glucose levels of 4.9±0.1 mmol/L2 and 5.3±0.5 mmol/L.3 HIC was shown to increase in animals with hyperglycemia, and insulin becomes unstable in the hyperglycemic condition because the zinc ion is important for insulin crystal; however, zinc ion regulation is disturbed in the hyperglycemic condition.4 These results suggest that HIC is decreased in patients with mild hyperglycemia, but HIC was increased in patients with severe hyperglycemia. Therefore, postprandial insulin levels in patients with poorly controlled type 2 diabetes should be interpreted with caution. We suggest that postprandial C-peptide levels should be measured in patients with poorly controlled type 2 diabetes to determine their ability to secrete insulin. However, there are no other clinical results or animal study results in the poorly controlled diabetes condition. Further research is required.
The insulin secretion index HOMA-beta and the insulinogenic index are significantly correlated with HIC. We also analyzed C-peptide-based insulin secretion ability because the insulin-based insulin secretion index is affected by insulin clearance. C-peptide-AUC0–30 and C-peptide-AUC0–120 were also significantly correlated with HIC. These correlations were weaker compared with HOMA-beta and the insulinogenic index. However, these results suggested that insulin secretion is important for insulin clearance. Because insulin use is a saturable process, the higher HIC values may result from reduced insulinemia rather than from a mechanism that is related to stronger glucose intolerance. Figure 1 shows that during the MTT, insulin is much higher in the low clearance group. Thus, the lower clearance may be strongly related to saturation mechanisms, rather than to homeostasis mechanisms. Further studies including investigation of the insulin secretion ability, such as using the hyperglycemic clamp, are required.
In this study, gamma-GTP in the low HIC group was significantly higher compared with the high HIC group. A similar result was reported by a previous study, where increased gamma-GTP and ALT were observed in healthy individuals with a high hepatic insulin resistance and decreased HIC.24 We compared the mean gamma-GTP level in the alcohol drinker and non-drinker groups, and while there was no significant differences between the groups, the non-drinker group showed a higher gamma-GTP level. We suspect that this means that a drinking habit did not have a large influence in this study. Moreover, HOMA-IR was strongly correlated with HIC, and the M/I value was associated with HIC, but the GDR was not associated with HIC. HOMA-IR is mainly associated with hepatic insulin resistance, and GDR is mainly associated with muscle insulin resistance.25 Therefore, these results suggest that hepatic insulin resistance is associated more with HIC than with muscle insulin resistance.
The previous report also showed a positive correlation between ALT and fasting glucagon levels in type 2 diabetes.24 In our study, the glucagon AUC was significantly and negatively correlated with HIC. Another study reported that postmenopausal white women had lower glucagon concentrations and higher HIC compared with black women.26 These results suggest that glucagon levels are associated with HIC and hepatic insulin resistance. However, there were no significant differences in the glucagon AUC between the high and low HIC groups in our study. Further studies are required.
One study reported that a cannabinoid receptor 1 antagonist increases HIC in fat-fed dogs, which likely occurred via upregulation of liver adiponectin receptors.27 In our study, adiponectin was significantly correlated with HIC. These results suggest that adiponectin is associated with HIC.
Another study reported that injection of GLP-1 reduces endogenous insulin clearance in mice, and thus, it may affect insulin levels by increasing prehepatic insulin secretion and reducing insulin clearance.8 However, the AUC of postprandial GLP-1 was not correlated with HIC in our study. These results suggest that the GLP-1 physiological range may not affect the HIC, but high GLP-1 levels reduce the HIC. However, another study reported that a reduction in HIC after oral glucose ingestion is not mediated by GLP-1 or by GIP in humans.28 The effects of GLP-1 on HIC may be different between humans and mice. This article and our results suggested that the effect of GLP-1 on HIC is not as strong in humans. Further studies are required to determine the effects of GLP-1 administration on HIC.
There was also no significant difference in the mean HIC between the SLC30A8 high-risk and low-risk groups. This suggests that HIC is associated more with hyperglycemia than with the patient’s genetic background.
Our study had several limitations. The relatively small number of participants indicates that our results require confirmation with a larger study. Therefore, we added ‘A Preliminary Report’ to the title. Because we recruited patients with diabetes who had no previous insulin intervention, it is possible that we failed to recruit subjects with low insulin sensitivity who had decreased insulin secretion. However, the glucose clamp test is a complicated technique, and it is difficult to recruit patients with poorly controlled diabetes who are not taking medication. We are currently conducting a larger study, and we will publish the results in the future. Because hepatic clearance exists independently from the test that is used to quantify it, there are differences between consuming a test meal and administering a pure glucose load, which also affects glucose and insulin levels. The MTT was used in our study because it is best to avoid OGTTs in patients with severe diabetes because of the risk of hyperglycemia. However, some studies used the HIC that was obtained from MTT, we consider that our study was acceptable.26 Although we would like to investigate HIC, data about insulin clearance using a glucose clamp are also important.29 Unfortunately, we did not measure the C-peptide levels at steady state during the glucose clamp in this study. However, it is possible that the ratio of AUCs for C-peptide and insulin reflects the endogenous clearance rather than hepatic clearance. Figure 1 and another article show that 120 min is a very short time interval in which to use AUCs, considering the very different kinetics of insulin and C-peptide because the dynamics of both variables at 120 min is mostly incomplete.30 We would like to investigate insulin clearance using the glucose clamp data in a future study. We also excluded patients with serum creatinine >1.3 mg/dL based on an earlier report, because C-peptide levels are strongly affected by renal function.31 Care must be taken when calculating the HIC using C-peptide in patients with renal insufficiency. We also did not evaluate hepatic insulin resistance, because we cannot use tritium-glucose in Japan. Despite these limitations, we believe that our study contributes to our daily clinical work.
In conclusion, these results suggested that HIC was increased in patients with high HbA1c type 2 diabetes, low insulin secretion, low insulin resistance and high adiponectin conditions.
Acknowledgments
The authors would like to thank Ms Megumi Endo and Ms Yoshiko Oda for their excellent technical assistance. The authors would like to thank Jodi Smith, PhD, from Edanz Group (www.edanzediting.com/ac) for editing a draft of this manuscript. This work was performed at the Tottori University Faculty of Medicine, Tottori, Japan. TO is the guarantor of this work and takes responsibility for the integrity of the data and the accuracy of the data analyses.
References
Footnotes
Contributors TO participated in the design of the study and performed the statistical analysis. YF, RN, MA, YI, SK, KMatsumoto, KyS, KeS, KMatsuzawa, SI, HO and EU collected the data. HN helped with the statistical analysis. MK, TI, S-IT and KY conceived the study, participated in its design and coordination and helped to draft the manuscript. All authors read and approved the final manuscript.
Funding This work was supported by a JSPS KAKENHI Grant-in-Aid for Scientific Research (C) Grant Number 16K08935 (2016–2018), a JSPS KAKENHI Grant-in-Aid for Young Scientists (B) Grant Number 26870373 (2014–2015) and grants for young researchers from the Japan Association for Diabetes Education and Care (2014).
Competing interests None declared.
Patient consent for publication Not required.
Ethics approval This study was conducted in accordance with the principles of the Declaration of Helsinki. This study was approved by the Ethics Committee of the Faculty of Medicine, Tottori University (approval number G161). Informed consent was obtained from all of the participants using a procedure that was approved by the Ethics Committee.
Provenance and peer review Not commissioned; externally peer reviewed.
Data availability statement All data relevant to the study are included in the article.