Article Text

Abstract
Objective Variability in estimated glomerular filtration rate (eGFR) has been associated with adverse outcomes in patients with diabetes or chronic kidney disease (CKD). However, no previous study has explored the relationship between eGFR variability and type 2 diabetes incidence.
Research design and methods In this nationwide, longitudinal, cohort study, we investigated the association between eGFR variability and type 2 diabetes risk using the Korean National Health Insurance Service datasets from 2002 to 2017. eGFR variability was calculated using the variability independent of the mean (eGFR-VIM), coefficient of variation (eGFR-CV), standard deviation (eGFR-SD) and average real variability (eGFR-ARV).
Results Within 7 673 905.58 person-years of follow-up (mean follow-up: 3.19 years; n=2 402 668), 11 981 cases of incident type 2 diabetes were reported. The HRs and 95% CIs for incident type 2 diabetes increased according to advance in quartiles of eGFR-VIM (HR (95% CI): Q2, 1.068 (1.009 to 1.130); Q3, 1.077 (1.018 to 1.138); Q4, 1.203 (1.139 to 1.270)) even after adjusting for confounding factors including mean eGFR and mean fasting plasma glucose levels. The subgroup analyses according to risk factors as well as analyses using eGFR-CV, eGFR-SD and eGFR-ARV showed consistent results. The association between increased eGFR variability and type 2 diabetes risk was more prominent in men, individuals with dyslipidemia and those with CKD as shown in the subgroup analysis (p for interaction <0.001).
Conclusions Increased eGFR variability may be an independent predictor of type 2 diabetes and might be useful for risk stratification of individuals without diabetes.
- GFR
- chronic kidney disease
- type 2 diabetes
This is an open access article distributed in accordance with the Creative Commons Attribution Non Commercial (CC BY-NC 4.0) license, which permits others to distribute, remix, adapt, build upon this work non-commercially, and license their derivative works on different terms, provided the original work is properly cited, appropriate credit is given, any changes made indicated, and the use is non-commercial. See: http://creativecommons.org/licenses/by-nc/4.0/.
Statistics from Altmetric.com
Significance of this study
What is already known about this subject?
Intraindividual variability in estimated glomerular filtration rate (eGFR) has been linked to the progression of chronic kidney disease (CKD) and diabetic retinopathy in individuals with diabetes and associated with the risk of progression to end-stage renal disease, acute coronary syndrome and mortality in individuals with CKD.
However, no previous study has examined the relationship between eGFR variability and incident type 2 diabetes risk in general populations without diabetes.
What are the new findings?
In this nationwide, longitudinal, population-based, cohort study including 2 402 668 subjects, greater visit-to-visit eGFR variability, assessed using various indices including variability independent of the mean, standard deviation, coefficient of variation and average real variability, was independently associated with increased risk of type 2 diabetes, even after adjusting for mean eGFR and mean fasting plasma glucose levels during health examinations and other various risk factors for type 2 diabetes.
Consistent results were found in subgroup analyses stratified by per cent change in eGFR, age, sex, presence of hypertension, dyslipidemia, CKD, current smoking and body mass index, although more prominent associations were observed in men, individuals with dyslipidemia and those with CKD.
How might these results change the focus of research or clinical practice?
These results suggest that eGFR variability is an independent predictor of incident type 2 diabetes and may provide additional prognostic information beyond eGFR level at a single point of time or mean eGFR levels during the follow-up period.
Therefore, eGFR variability might be used for risk stratification of future type 2 diabetes.
Introduction
The longitudinal intraindividual variability in physiological measures has emerged as a novel predictor for various adverse health outcomes. Historically, it had been hypothesized that loss of physiological homeostasis is linked to variability in physiological measures, ultimately leading to unhealthy states such as disease.1 A growing body of evidence suggests that variability in blood pressure (BP), plasma glucose and cholesterol concentrations is independently associated with increased risk of cardiovascular events and mortality.2–5 Studies have explored the implications of variability in physiological indices as a marker to predict the risk of incident type 2 diabetes. Fluctuation in body weight6 and total cholesterol levels7 has been linked to the risk of type 2 diabetes. Yano et al reported that higher visit-to-visit BP variability was associated with increased risk of new-onset diabetes and chronic kidney disease (CKD), independent of mean BP and clinical variables.8 Recently, we found that increased variability in fasting plasma glucose is independently associated with the development of type 2 diabetes in 131 744 Korean men and women without diabetes.9
Only limited studies have evaluated the association between variability in estimated glomerular filtration rate (eGFR) and adverse outcomes. Longitudinal eGFR variability provides additional information for predicting prognosis beyond cross-sectional eGFR data.10 The significance of eGFR variability has been confirmed as a predictor for renal allograft outcomes in kidney transplanted patients11 and as a marker of increased risk of adverse renal outcomes in individuals with diabetes12 or CKD.13 Furthermore, there have been reports that eGFR variability is also associated with acute coronary syndrome and mortality risk in patients with CKD.13 14 Recently, the implication of eGFR variability was extended as a marker of diabetic retinopathy among patients with type 2 diabetes.15
However, to the best of our knowledge, no previous study has evaluated the relationship between eGFR variability and type 2 diabetes incidence. Therefore, to examine the usefulness of visit-to-visit eGFR variability as a novel predictor of the risk of type 2 diabetes, we compared the relative risk of type 2 diabetes after adjusting for other risk factors and intraindividual means of eGFR among individuals grouped according to eGFR variability using the Korean National Health Insurance Service (KNHIS) database.
Research design and methods
Data sources
The KNHIS datasets of claims and preventive health examinations in Korea from January 2002 to December 2017 were used for analysis. As a single-payer organization, the KNHIS by Korean government covers almost all residents in Korea. The KNHIS claims datasets include anonymous identification numbers, demographics, monthly income, primary and secondary diagnoses classified according to the International Classification of Diseases-10th Revision (ICD-10), prescriptions, procedures and dates of hospital visits of all enrollees. The KNHIS recommends standardized preventive health examinations at least every 2 years for its enrollees. The results of these examinations are recorded into the datasets of preventive health examinations, which include information on smoking history, alcohol consumption, physical activity, BP, anthropometric measurements and laboratory data, such as fasting plasma glucose level, lipid profiles and serum creatinine. Details on this database are described in a previous study.16
Study cohort, outcomes and follow-up
In this nationwide, longitudinal, population-based study, individuals aged ≥20 years at baseline who satisfied both of the following criteria were included: (1) having undergone at least one health examination between January 2014 and December 2015 and (2) ≥2 additional health examinations during the previous 2 years. The time point of the last examination between 2014 and 2015 was set as the baseline. Among these, individuals with missing data for at least one variable, those who had prescriptions for antidiabetic medications or claims under the codes for any diabetes (ICD-10 codes E10–14) at or before baseline and those who had fasting plasma glucose levels ≥100 mg/dL (patients with any diabetes or impaired fasting glucose) at baseline were excluded (online supplementary figure S1).
Supplemental material
The end point of this study was newly developed type 2 diabetes. Type 2 diabetes was determined as the presence of ≥1 claims per year for the prescription of antidiabetic medication under ICD-10 codes E11–14 or a fasting plasma glucose concentration ≥126 mg/dL, according to previous studies. 17 The study population was followed from baseline to the date of death, diagnosis of type 2 diabetes or 31 December 2017, whichever came first.
Measurements and definitions
Data on smoking status (never, past or current), alcohol consumption and regular exercise were obtained using questionnaires. An average alcohol intake ≥30 g/day was considered as heavy alcohol consumption. Regular exercise was defined as a moderate-intensity physical activity accompanied by a substantial shortness of breath for >30 min per session, ≥5 days per week and/or high-intensity physical activity causing an extreme shortness of breath for >20 min per session, ≥3 days per week. A low-income status was regarded as being registered in the Medical Aid program for the lowest income population or being among the lowest 20% for the rest of the population in the KNHIS, based on the monthly household income. Body mass index (BMI) was calculated as body weight in kilograms divided by height in meters squared (kg/m2). eGFR was calculated using the Modification of Diet in Renal Disease (MDRD) equation.18 The plasma glucose level and lipid profiles were measured from venous samples drawn after an overnight fast. These health examinations were conducted only at hospitals certified by the KNHIS. According to the Basic Act on National Health Examination in Korea, regular quality assessments at least every 3 years are applied to the all health examination institutions for the components of health examinations. The presence of hypertension was defined as ≥1 claim per year under ICD-10 codes I10–13 or I15 and at least 1 claim per year for the prescription of antihypertensive agents or systolic/diastolic BP ≥140/90 mm Hg. The presence of dyslipidemia was determined using the definition from a previous study.4 CKD was defined as an eGFR of <60 mL/min/1.73 m2.
eGFR variability was defined as intraindividual variability in eGFR values assessed 2 years prior to baseline and at baseline. It was calculated using four indices of variability: variability independent of the mean (eGFR-VIM), standard deviation (eGFR-SD), coefficient of variation (eGFR-CV) and average real variability (eGFR-ARV).4 19 The per cent change in eGFR was calculated according to the following formula: 100 (%)×(baseline eGFR (mL/min/1.73 m2)−initial eGFR (mL/min/1.73 m2))/(initial eGFR (mL/min/1.73 m2)). Initial eGFR was defined as the eGFR evaluated at the first health examination within the 2-year period before the baseline.
Statistical analyses
Statistical analyses were carried out using SAS software (V.9.3, SAS Institute, Cary, North Carolina, USA). Two-sided p values <0.05 were considered to be statistically significant. The baseline characteristics of the study population were analyzed according to quartiles of eGFR variability. Continuous variables with normal distributions are expressed as mean±SD, whereas continuous variables with non-normal distributions are presented as median and IQR. Categorical variables are shown as frequencies and percentages.
The incidence rate of the type 2 diabetes was calculated as the number of incident cases divided by the follow-up duration (person-years). The cumulative incidence of type 2 diabetes according to quartile of eGFR variability was evaluated using Kaplan-Meier curves; the differences among the groups were assessed using log-rank test. Multivariate Cox regression analyses were performed to calculate the HRs and 95% CIs for the outcome (type 2 diabetes) incidence according to quartile groups of eGFR variability. Model 1 was adjusted for age and sex. Model 2 was further adjusted for smoking history, alcohol consumption, regular exercise, low-income status and BMI. Model 3 was adjusted for hypertension, dyslipidemia and mean eGFR during the repeated health examinations, in addition to potential confounders reflected in model 2. Model 4 was adjusted for the mean fasting plasma glucose level during the health examinations and the potential confounders reflected in model 3. Sensitivity analyses were also performed, excluding individuals with any malignancy, who received major organ (kidney, liver, heart or lung) transplantation, with prescriptions for ACE inhibitors or aldosterone receptor blockers (ARBs), or who received renal replacement therapies (hemodialysis, peritoneal dialysis or kidney transplantation). To exclude the potential effect of glomerulonephritis or steroid treatment, we conducted additional sensitivity analyses after excluding individuals with glomerular disease, or with prescriptions for steroids. Furthermore, sensitivity analysis using the eGFR value calculated from the Chronic Kidney Disease Epidemiology Collaboration (CKD-EPI) equation20 21 instead of the MDRD equation was also performed.
Additionally, the HRs (95% CIs) for type 2 diabetes incidence were calculated according to the groups categorized by the per cent change in eGFR to examine the association of increasing and decreasing eGFR trends with hazards of incident type 2 diabetes. Next, the potential effect modification by per cent change in eGFR, age, sex, presence of hypertension, dyslipidemia, CKD, current smoking and BMI was evaluated by performing a stratified analysis, and p for interaction was calculated. In these subgroup analyses, the HRs (95% CIs) for the outcome incidence rate of the highest quartile of eGFR variability group were compared with those of the three lower quartile groups (reference group).
Results
Baseline characteristics and study population
The study population consisted of a total of 2 402 668 participants (online supplementary figure S1). The baseline characteristics of the study population are expressed according to quartile group of eGFR variability (table 1). The mean fasting plasma glucose showed similar values ranging from 88.54 to 88.69 mg/dL throughout the quartile groups of eGFR variability. Participants in higher quartiles of eGFR variability had a higher prevalence of CKD. Those in the highest quartile of eGFR variability showed the highest proportion with low-income status, hypertension and dyslipidemia.
Baseline characteristics of participants according to quartiles of variability in eGFR†
eGFR variability and incident type 2 diabetes
During a mean follow-up of 3.19±0.50 years (7 673,905.58 person-years), 11 981 individuals were diagnosed with incident type 2 diabetes. The cumulative incidence of type 2 diabetes is presented according to quartiles of eGFR-VIM using Kaplan-Meier curves (figure 1). The cumulative incidence of type 2 diabetes was highest in the highest quartile group (Q4) and lowest in the lowest quartile (Q1) (figure 1, table 2). The HRs (95% CIs) for incident type 2 diabetes were calculated according to quartiles of eGFR-VIM (table 2). In all models (models 1–4) adjusted for possible confounders, the risk of type 2 diabetes increased significantly in higher quartile groups (HR (95% CI): Q2, 1.068 (1.009 to 1.130); Q3, 1.077 (1.018 to 1.138); Q4, 1.203 (1.139 to 1.270) in the fully adjusted model 4). Statistical significance was maintained even after adjusting for mean eGFR and mean fasting plasma glucose during the repeated health examinations in model 3 and 4. These findings remained unchanged when the eGFR-VIM was replaced by eGFR-SD, eGFR-CV or eGFR-ARV as measures of eGFR variability (online supplementary tables S1–S3). In sensitivity analyses, consistent results were observed when individuals with any malignancy, who underwent major organ transplantation, with prescriptions for ACE inhibitors or ARBs, who received renal replacement therapies, with glomerular disease, or with prescriptions for steroids were excluded (online supplementary tables S4–S9). Sensitivity analysis using the eGFR value calculated from the CKD-EPI equation instead of the MDRD equation also showed results consistent with those from the main analysis (online supplementary table S10). Furthermore, increasing and decreasing trends in eGFR assessed by the per cent change were associated with increased hazards of incident type 2 diabetes when the group with the minimum absolute value of per cent change in eGFR (−5% ≤per cent change in eGFR <5%) was set as a reference (online supplementary table S11).
Supplemental material
HRs and 95% CIs for the incidence of type 2 diabetes according to quartiles of eGFR variability (VIM)*

Cumulative incidence of type 2 diabetes according to quartiles of estimated glomerular filtration rate (eGFR) variability. The Modification of Diet in Renal Disease equation was used to calculate the eGFR, while the variability independent of the mean (VIM) was used to assess variability. Range of eGFR variability (VIM): Q1 (0.10≤VIM<6.11), Q2 (6.11≤VIM<8.81), Q3 (8.81≤VIM<13.95), Q4 (13.95≤VIM≤542.29).
Subgroup analysis
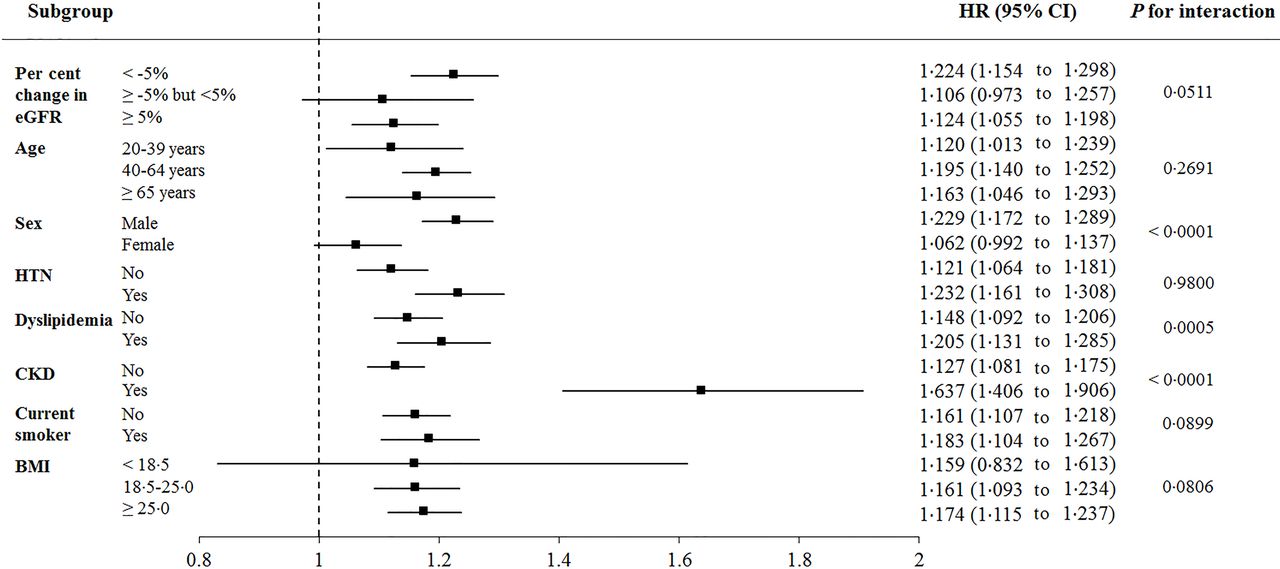
An analysis stratified by per cent change in eGFR, age, sex, presence of hypertension, dyslipidemia, CKD, current smoking and BMI was performed (figure 2). The highest quartile (Q4) group of eGFR variability was associated with a significantly higher risk for type 2 diabetes compared with the three lower quartile (Q1–Q3) groups in all subgroups except for individuals with the minimum absolute value of per cent change in eGFR (−5% ≤per cent change in eGFR <5%), women and underweight participants (BMI<18.5 kg/m2), although the HRs in the highest quartile group (Q4) showed a non-significant increase compared with those in the three subgroups (Q1–Q3). The associations were more prominent in men, individuals with dyslipidemia and those with CKD and were attenuated in women, those without dyslipidemia, and those without CKD (p for interaction <0.001). No significant effect modification was observed according to per cent change in eGFR, age group, presence of hypertension, current smoking and BMI. Although statistical significance was not met, the HR tended to be numerically higher in the subgroup with negative per cent change in eGFR (per cent change in eGFR <−5%) than in other subgroups stratified by per cent change in eGFR (p for interaction 0.0511).
Adjusted HRs and 95% CIs for the incidence of type 2 diabetes in the highest quartile vs the three quartiles of estimated glomerular filtration rate (eGFR) variability. Adjusted for age, sex, smoking history, alcohol consumption, regular exercise, low-income status, body mass index (BMI), hypertension, dyslipidemia and mean eGFR during the health examinations. The Modification of Diet in Renal Disease equation was used to calculate the eGFR, while the variability independent of the mean (VIM) was used to assess variability. CKD was defined as eGFR <60 mL/min/1.73 m2. CKD, chronic kidney disease; HTN, hypertension.
Conclusions
To the best of our knowledge, this large-scale longitudinal study including 2 402 668 subjects is the first to explore the risk of type 2 diabetes according to eGFR variability. In the current study, high visit-to-visit eGFR variability was independently associated with a greater risk of type 2 diabetes, even after adjusting for mean eGFR and mean fasting plasma glucose levels during health examinations and other various risk factors for type 2 diabetes. These findings were consistent regardless of the used measures of variability including eGFR-VIM, eGFR-SD, eGFR-CV and eGFR-ARV. In addition, a tendency for increased type 2 diabetes risk was consistently observed in sensitivity analyses and subgroup analyses stratified by per cent change in eGFR, age, sex, presence of hypertension, dyslipidemia, CKD, current smoking and BMI. These results suggest that eGFR variability may capture additional prognostic information beyond eGFR level at a single point of time or mean eGFR levels during the follow-up period.
Only a few studies have evaluated the association between eGFR variability and adverse clinical outcomes.11–15 22 For example, greater eGFR variability over the first year after kidney transplantation has been associated with poor renal allograft outcomes.11 Furthermore, increased eGFR variability has been found to be associated with the risk of CKD progression in individuals with diabetes12 and related to the risk of progression to end-stage renal disease, acute coronary syndrome and mortality among patients with CKD.1314 In addition, Zhang et al15 demonstrated an independent association of eGFR variability with the presence and severity of diabetic retinopathy among patients with type 2 diabetes. However, most of the previous studies that explored the relationship between eGFR variability and adverse outcomes were conducted in recipients of kidney transplantation or individuals with CKD or diabetes. To our knowledge, no previous study has evaluated the association of eGFR variability with incident type 2 diabetes risk in general populations without diabetes. Our results based on the database that covers the almost entire Korean population demonstrated that long-term eGFR variability may also serve as a novel predictor of type 2 diabetes risk.
Although the exact underlying mechanism cannot be clarified in the current study, several possible explanations support the association between eGFR variability and incident type 2 diabetes. First, insults throughout the body including hemodynamic abnormalities may affect both the renal vascular bed and the microvasculature of pancreas islet through shared substrates. eGFR variability may represent maladaptation to changes in renal hemodynamics in individuals with reduced nephron mass and limited autoregulatory reserve.14 15 23Abnormal hemodynamics may also cause injury to the islet microvasculature of susceptible individuals, leading to increased risk of diabetes. This possibility is supported by results from in vivo and in vitro experiments that demonstrated the disruption of the endothelial architecture in the islet microvasculature before the onset of hyperglycemia.24 Larger eGFR variability may reflect decreased kidney resilience to external or internal stimuli, which is considered as a potential risk factor for adverse health outcomes.12 Second, variability may be a marker of changes in renal blood flow affected by intravascular volume, atherosclerosis and endothelial dysfunction.14 The biomarkers of endothelial dysfunction and inflammation have been associated with incidence of type 2 diabetes.25 Individuals with higher eGFR variability may have more severe systemic atherosclerosis than do those with stable eGFR levels.26 Third, insulin resistance in incipient renal disease may be a possible explanation. Fliser et al27 reported that insulin resistance and consequent hyperinsulinemia, which are closely associated with the risk of incident type 2 diabetes, appear very early in the course of renal disease, even when eGFR is still within the normal range. Increased eGFR variability may suggest a maladaptive kidney with reduced autoregulatory reserve in early renal disease before progressing to advanced CKD with markedly decreased eGFR. Fourth, higher eGFR variability may be an epiphenomenon reflecting unhealthy systemic conditions that can increase the risk of type 2 diabetes. Decreased ability of certain individuals to maintain renal homeostasis, which can significantly increase the intraindividual eGFR variability, may also depend on the function of systemic organs other than the kidney.28 Interestingly, compared with individuals with stable kidney function, those with changes in kidney function (both drop and rise) were reported to be associated with increased risk of mortality.29 Likewise, in the current study, increasing and decreasing trends in eGFR were both associated with increased hazards of type 2 diabetes.
The associations between the highest quartile of eGFR variability and increased risk for type 2 diabetes were more prominent in men, patients with dyslipidemia and those with CKD. This finding suggests that utility of eGFR variability as a predictor of incident type 2 diabetes may be more valid in these subpopulations. In particular, presence of CKD, defined as an eGFR of <60 mL/min/1.73 m2, may indicate reduced nephron mass or the injured, vulnerable kidney. In these circumstances, intraindividual eGFR variability may more sensitively reflect recurrent insults to the body, which can lead to the risk of incident type 2 diabetes. Likewise, although statistical significance was not achieved, the strength of association between the highest quartile of eGFR variability and type 2 diabetes risk tended to be higher in the subgroup with decreasing trend of eGFR (per cent change in eGFR <−5%) compared with the other subgroups stratified by per cent change in eGFR (p for interaction 0.0511). Decreasing trend of eGFR may represent a vulnerable kidney in the progressive course of renal disease where recurrent insults to the body may be more sensitively manifested as eGFR variability. Moreover, insulin resistance states, closely related to the progressive course of renal disease,27 may provide a circumstance where individuals are more susceptible to develop type 2 diabetes during repetitive insults reflected as intraindividual eGFR variability. In addition, patients with dyslipidemia, in whom more prominent association of eGFR variability with type 2 diabetes was observed, may denote individuals with metabolic abnormality who are more prone to develop incident type 2 diabetes when their bodies are exposed to repetitive insults.
Several limitations of this study should be acknowledged. First, clarification of causal relationships was inevitably limited due to the observational nature of this cohort study. However, to minimize the possible effect of reverse causality, individuals with prescriptions for antidiabetic drugs or claims under the codes of any diabetes at or before baseline and those who had a fasting plasma glucose ≥100 mg/dL at baseline were excluded. Second, type 2 diabetes was defined based solely on the clinical diagnostic codes, medication prescriptions and fasting plasma glucose level, and other measures to diagnose type 2 diabetes, including glycated hemoglobin, and results of oral glucose tolerance tests were not reflected due to unavailability of data. Third, considering the differences in baseline characteristics between eGFR quartile groups, it cannot be completely ruled out that other measured or unmeasured confounders may have affected the results despite extensive adjustment for potential confounders and various sensitivity analyses which demonstrated consistent findings. Lastly, our sample consists primarily of Korean individuals; therefore, caution should be observed when extrapolating our results to populations including different ethnicities. However, the present study has several major strengths. We used a standardized and validated database provided by the Korean government. This KNHIS database has a huge sample size and includes lifestyle and laboratory variables that enable adjustment for diverse confounding factors. Furthermore, comprehensive analyses adopting various measurements of variability, such as VIM, SD, CV and ARV, showed a similar degree of association. Consistent results were also observed in subgroup analyses according to risk factors and in sensitivity analyses. As a clinical implication, similar to the automatic report of eGFR in electronic health records, eGFR variability may also be automated for clinical risk assessment in the future.28
In summary, this nationwide, longitudinal, population-based, cohort study demonstrated that increased intraindividual eGFR variability was an independent predictor of incident type 2 diabetes even after adjusting for confounding factors including mean eGFR levels. Therefore, eGFR variability might be used for risk stratification of future type 2 diabetes, especially in men, individuals with dyslipidemia and those with CKD. Future studies should be conducted to confirm these suggestions and clarify the underlying pathophysiological mechanisms of eGFR variability that mediate the development of type 2 diabetes.
Acknowledgments
This work was performed using the database from the Korean National Health Insurance Service (No. NHIS-2019-1-513), and the results do not necessarily represent the opinion of the National Health Insurance Corporation. The authors would like to thank the National Health Insurance Service for cooperation.
References
Footnotes
KH and KMC contributed equally.
Contributors Y-BL drafted the manuscript. Y-BL, KH, JAK and KMC contributed to the study design. KH and DHK participated in the data analysis planning and KH participated in statistical analysis. ER, S-HH, HJY and SHB searched for related literature and contributed to the hypothesis conception. KMC critically edited the manuscript. All authors contributed important intellectual content during manuscript drafting or revision and approved the final version of the manuscript. KMC is the guarantor of this work and, as such, had full access to all the data in the study and takes responsibility for the integrity of the data and the accuracy of the data analysis.
Funding This work was funded by the Korea University Research Fund to KMC. The corresponding author had full access to the data and final responsibility for the decision to submit for publication.
Disclaimer The funder had no role in the study design; data collection, analysis and interpretation or writing of the report.
Competing interests None declared.
Patient consent for publication Not required.
Ethics approval This study was approved by the Institutional Review Board (IRB) of Korea University (IRB file number: 2019GR0200). An informed consent exemption was granted by the IRB because the KNHIS provided the researchers with only anonymous, de-identified data.
Provenance and peer review Not commissioned; externally peer reviewed.
Data availability statement Data may be obtained from a third party and are not publicly available. The data that support the findings of this study are available from the Korean National Health Insurance Service (KNHIS) but restrictions apply to the availability of these data, which were used under license for the current study and so are not publicly available. On an individual basis, data are however available from the authors on reasonable request and with permission from the KNHIS. Additional study-related documents and de-identified data may be requested by written application to the corresponding author.