Article Text

Abstract
Objective Glucose disposal by insulin-responsive tissues maintains the body glucose homeostasis and insulin resistance leads to a risk of developing type 2 diabetes (T2DM). Insulin stimulates the translocation of glucose transporter isoform 4 (GLUT4) vesicles from intracellular compartments to the plasma membrane to facilitate glucose uptake. However, the underlying mechanisms of GLUT4 vesicle translocation are not well defined. Here we show the role of huntingtin-associated protein 1 (HAP1) in GLUT4 translocation in adipocytes and the pathogenesis of T2DM.
Research design and methods The parameters for glucose metabolism including body weight, glucose tolerance and insulin tolerance were assessed in wild-type (WT) and Hap1+/- mice. HAP1 protein expression was verified in adipose tissue. Hap1 mRNA and protein expression was monitored in adipose tissue of high-fat diet (HFD)-induced diabetic mice. Insulin-stimulated GLUT4 vesicle translocation and glucose uptake were detected using immunofluorescence techniques and quantified in primary adipocytes from Hap1-/- mice. The interaction between HAP1 and GLUT4 was assessed by immunofluorescence colocalization and co-immunoprecipitation in HEK293 cells and adipose tissue. The role of sortilin in HAP1 and GLUT4 interaction was approved by co-immunoprecipitation and RNA interference.
Results The expression of Hap1 mRNA and protein was detected in WT mouse adipose tissue and downregulated in adipose tissue of HFD-induced diabetic mice. Hap1+/- mice exhibited increased body weight, pronounced glucose tolerance and significant insulin intolerance compared with the WT mice. HAP1 colocalized with GLUT4 in mouse adipocytes and cotransfected HEK293 cells. Furthermore, the insulin-stimulated GLUT4 vesicle translocation and glucose uptake were defective in Hap1-/- adipocytes. Finally, sortilin mediated the interaction of HAP1 and GLUT4.
Conclusions Our study showed that HAP1 formed a protein complex with GLUT4 and sortilin, and played a critical role in insulin-stimulated GLUT4 translocation in adipocytes. Its downregulation may contribute to the pathogenesis of diabetes.
- type 2 diabetes
- GLUT4
This is an open access article distributed in accordance with the Creative Commons Attribution Non Commercial (CC BY-NC 4.0) license, which permits others to distribute, remix, adapt, build upon this work non-commercially, and license their derivative works on different terms, provided the original work is properly cited, appropriate credit is given, any changes made indicated, and the use is non-commercial. See: http://creativecommons.org/licenses/by-nc/4.0/.
Statistics from Altmetric.com
Significance of this study
What is already known about this subject?
Insulin-stimulated glucose transporter isoform 4 (GLUT4) translocation needs the help of transporters and regulators.
Huntingtin-associated protein 1 (HAP1) highly expresses in nervous and endocrine systems.
HAP1 acts as an accessory molecule for molecular motors.
What are the new findings?
HAP1 is expressed in adipocytes.
HAP1 forms a protein complex with GLUT4 and sortilin and participates in GLUT4 translocation.
Hap1 mRNA and protein is downregulated in diabetic state.
How might these results change the focus of research or clinical practice?
In addition to neurons and endocrine cells, HAP1 also participates in the physiological functions of other cells and plays a broader role.
HAP1 may be a potential therapeutic target for type 2 diabetes mellitus.
Introduction
The hallmark of type 2 diabetes mellitus (T2DM) pathogenesis is insulin resistance, which includes a decrease in target cell’s metabolic response to insulin and an impaired lowering effect of insulin on blood glucose.1 Accumulated evidences suggest that multiple mechanisms are responsible for the decrease of insulin-stimulated glucose utilization and the development of insulin resistance, including genetic mutations, post-translational modifications, protein–protein interaction and protein phosphorylation–dephosphorylation events, and formation of inhibitory complexes.2
Glucose transporter isoform 4 (solute carrier family 2, facilitated glucose transporter member 4, GLUT4) is the main insulin-sensitive glucose transporter primarily expressed in adipose tissue and striated muscle, and less expressed in liver, hippocampus and other tissues.3 4 The abnormal expression of GLUT4 and the impaired intracellular transport are responsible for the occurrence of insulin resistance.5 Moreover, the mRNA and protein levels of GLUT4 are downregulated in the adipose tissue of T2DM.6 7 In response to insulin stimulation, GLUT4 storage vesicles (GSVs) first translocate and then fuse with plasma membrane. This process is precisely regulated and involves various molecules.8 However, the exact mechanism is unclear. Thus, identification of molecules involved in GLUT4 translocation will help us clarify the glucose uptake process in cells and shed new light to the pathogenesis of insulin resistance.
Recent studies have shown that the interacting proteins of huntingtin-associated protein 1 (HAP1) in neural cells, such as sortilin, kinesin family motor protein 5 (KIF5B) and myosin 5 (MYO5),9–11 help with GLUT4 translocation in adipocyte.12–16 HAP1 is one of the components of molecular motors, mainly expressed in the central nervous system,17 18 as well as in endocrine organs secreting nitrogenous hormone.19 HAP1 has been found to interact with microtubules and various membranous organelles (eg, mitochondria, endoplasmic reticulum, intracellular bodies and lysosomes).20 It also participates in intracellular transport of proteins such as androgen receptor, TATA-binding protein and gamma-aminobutyric acid (GABA) type A receptors, thus exerting different physiological regulatory roles in nervous and endocrine systems.21–25
Adipose tissue has been considered as an energy storage organ traditionally. Recent studies have suggested that adipose tissue functions as an endocrine organ and secretes nitrogenous hormones such as leptin, adiponectin and resistin.26–28 Despite that HAP1 is highly expressed in endocrine organs which secret nitrogenous hormones, the expression of this molecule in adipose tissue is unknown. Based on the distribution and function of HAP1, we hypothesized that HAP1 could be expressed in adipose tissue and involved in the insulin-stimulated GLUT4 translocation. The aberrant expression of HAP1 could disrupt the transport of GLUT4 and result into impaired glucose uptake, insulin resistance afterwards and finally contribute to the onset of T2DM. In this study, we investigate the expression of HAP1 in adipose tissue under diabetic state, the relationship between HAP1 and GLUT4 translocation in adipocytes and the consequence of HAP1 deficiency on the pathogenesis of T2DM.
Materials and methods
Animals
All experiments were performed in accordance with the guidelines on the care and use of animals for research purposes by the Institutional Animal Care and Use Committee of Sichuan University, and all the procedures were approved by the Institutional Animal Care and Use Committee of Sichuan University.
The animals were maintained in an air-conditioned facility (temperature controlled at 25°C±1°C) with a 12-hour light/dark cycle with free access to water and standard rodent chow. C57BL/6J male mice were purchased from Jianyang Dashuo Animal Technology (Sichuan, China), and Hap1 knockout male mice on a C57BL/6J genetic background (Hap1tm1Xjl) were purchased from the Jackson Laboratory (007749; Bar Harbor, Maine, USA). PCR genotyping of Hap1 knockout mice was carried out using primers 5′-TTTTGGAGGTCTGGTCTCGCTCTG-3′/5′-CGTCTTCCATCTTAGTGCGTTCAC-3′ for wild type (WT) and 5′-TTTTGGAGGTCTGGTCTCGCTCTG-3′/5′-CTTCATGTGGATGCTAGGGATCC-3′ for knockout animals. The PCR identification results were partly showed in online supplemental figure S1.
Supplemental material
For studies of diet-induced T2DM in mice, the WT mice were divided into two groups: the mice were fed with either normal diet (ND (H2O ≤10%, protein ≥18%, fat ≥4%, fiber ≤5%, ash content ≤8%); Jianyang Dashuo Animal Technology, Sichuan, China) or high-fat diet (HFD (60% ND, 20% sugar, 10% fat from lard, 10% chicken egg yolk); Experimental Animal Center of Sichuan University, Sichuan, China). HFD was introduced on the 13th week after birth. Metabolic parameters were monitored during the in vivo experiments.
Body weight measurements
The body weight of each animal was monitored and recorded using an electronic balance every 2 weeks from the age of 6 weeks.
Metabolic measurements
Glucose tolerance tests (GTTs) and insulin tolerance tests (ITTs) were performed as previously described.29 Briefly, GTTs were conducted on mice fasted for 16 hours. The mice were injected intraperitoneally with glucose in 0.9% saline (2 g/kg). ITTs were conducted on mice fasted for 4 hours. The mice were injected intraperitoneally with human insulin in 0.9% saline (0.2 U/kg). Blood glucose levels (mmol/L) were measured from tail vein blood using the Sannuo blood glucose monitor (Sinocare, Hunan, China) at indicated time points. Plasma insulin concentrations were measured by ELISA (Shanghai Elisa Biotech, Shanghai, China).
Culture of fibroblast-derived adipocytes
Mouse primary fibroblasts were isolated from back skin of newborn mice and cultured in standard medium (Dulbecco's Modified Eagle Medium (DMEM) supplemented with 100 µg/mL penicillin/streptomycin, 10% fetal bovine serum) (details showed in online supplemental file).
Differentiation of adipocytes derived from mouse primary fibroblasts was performed according to the manufacturer’s protocol (Cyagen, Guangzhou, China). Briefly, the fibroblasts were seeded at a density of 2×10⁴ cell/cm2 in 6-well plates in standard medium. Two days after confluence, the medium was replaced with adipogenic differentiation medium A containing insulin (1:500), dexamethasone (1:1000), 3-isobutyl-1-methylxanthine (1:1000) and rosiglitazone (1:1000). After day 3, the medium A was replaced with adipogenic differentiation medium B containing only insulin (1:500) and the cells were cultured for at least 2 days before use (differentiation images shown in online supplemental figure S2).
For GLUT4 translocation assay, adipocytes were cultured in standard medium (DMEM supplemented with 100 µg/mL penicillin/streptomycin, 10% fetal bovine serum) for 24 hours and then serum starved in Krebs-Ringer buffer containing 0.2% (w/v) bovine serum albumin (BSA) for 2 hours followed by incubation with or without 100 nM insulin for 30 min. The cells were either fixed with 3.7% (w/v) formaldehyde in phosphate-buffered saline (PBS) for immunofluorescence staining or harvested for isolation of cell membrane fraction using the Plasma Membrane Protein Isolation Kit (Bestbio, Shanghai, China) according to manufacturer’s instructions (details shown in online supplemental file).
Transfection of cell lines
HEK293 cells were obtained from the American Type Culture Collection (Manassas, Virginia, USA). HEK293 cells were maintained in DMEM supplemented with 10% fetal bovine serum. To analyze the interaction of HAP1 and GLUT4, HEK293 cells were transiently cotransfected with HAP1-CFP (encoding HAP1 isoform A) and GLUT4-mCherry plasmids with Lipofectamine 2000 (Invitrogen, Carlsbad, California, USA) according to manufacturer’s instructions. To study the role of sortilin, HEK293 cells were cotransfected with the above two plasmids and sortilin-small interfering RNA (siRNA) (5′-GAGGCATTGTCTATTCCAA-3′). Forty-eight hours after transfection, the cells were used for fluorescence observation or co-immunoprecipitation (Co-IP) assay.
Co-IP assay
Co-IP was performed as described previously.30 Briefly, cell lysates were prepared from white adipose tissue from mouse epididymal adipose pad or HEK293 cells. The lysates were pre-cleared by adding protein A/G magnetic beads (Bimake, Houston, Texas, USA) in lysis buffer, the mixture was rotated for 30 min in 4°C and then magnetic beads separated; the supernatant were kept for Co-IP experiment. The pre-cleared lysates (500 µg) were incubated with 1 µg of goat anti-HAP1 antibody (sc-12556; Santa Cruz, Dallas, Texas, USA) or goat anti-GLUT4 antibody (sc-1608, Santa Cruz) or rabbit anti-GLUT4 antibody (ab654; Abcam, Cambridge, UK) or rabbit anti-sortilin antibody (ab16640, Abcam) at 4°C for 12 hours, and then incubated with protein A/G beads for 1 hour. The beads were washed five times with the lysis buffer and boiled in loading buffer for western blot. For negative control, goat and rabbit IgG and untransfected HEK293 were used for validation.
Western blot
Lysates of adipose and brain tissues were prepared using radioimmunoprecipitation assay lysis buffer (Beyotime, Jiangsu, China) containing protease inhibitors (Sigma-Aldrich, St. Louis, Missouri, USA). Ten microliters of the homogenates were kept for total protein level analysis using bicinchoninic acid (BCA) kits (Beyotime) according to the manufacturer’s instructions. Tissue lysate, isolated cell membrane proteins and Co-IP samples were analyzed by 10% SDS-PAGE (sodium dodecyl sulfate–polyacrylamide gel electrophoresis) and transferred to polyvinylidene fluoride membrane. The membrane was first blocked in Tris-buffered saline containing 0.1% Tween-20 and incubated with appropriate primary (goat anti-HAP1 antibody (sc-12556, 1:1000; Santa Cruz), goat anti-GLUT4 antibody (sc-1608, 1:1000; Santa Cruz), rabbit anti-GLUT4 antibody (ab654, 1:1000; Abcam), rabbit anti-sortilin antibody (ab16640, 1:1000; Abcam), rabbit anti-Na/K-ATPase antibody (3010, 1:1000; CST)) and secondary antibodies (rabbit anti-goat IgG-HRP antibody (sc-2768, 1:2000; Santa Cruz), goat anti-rabbit IgG-HRP antibody (sc-2004, 1:2000; Santa Cruz)). The membrane was developed with Immobilon Western (P90719; Millipore, Burlington, Massachusetts, USA) and examined via Bio-Rad ChemiDoc MP system (Bio-Rad, Hercules, California, USA). Captured images were quantified using ImageJ software (http://rsb.info.nih.gov/ij/).
Quantitative real-time PCR (RT-qPCR)
Total RNA was extracted using RNAiso Kit (Takara, Beijing, China) following the supplier’s instructions. For each sample, 1 µg of RNA was treated and reverse-transcribed with PrimeScript RT reagent Kit with gDNA Eraser (Takara). SYBR Green RT PCR was performed using a CFX96 Real Time System (Bio-Rad) in triplicate using TB Green Premix Ex TaqII (Takara) with specific primers for mouse Hap1 (forward primer 5′-CGTGCGGCGTTTATTCGAG-3′ and reverse primer 5′-GCTGTGTTCAGGTCCCGTTC-3′) and the housekeeping gene β-actin (forward primer 5′-AGATTACTGCTCTGGCTCCTAGC-3′ and reverse primer 5′-ACTCATCGTACTCCTGCTTGCT-3′). Gene of interest expression data were normalized by dividing the corresponding levels of β-actin for each sample.
Immunostaining
Immunofluorescence was performed with mouse anti-HAP1 antibody (NB110-74569, 1:1000; Novus, Littleton, Colorado, USA) and rabbit anti-GLUT4 antibody (ab654, 1:500; Abcam). Slices were incubated overnight with primary antibodies at 4°C. DyLight 488-conjugated AffiniPure Goat Anti-rabbit secondary antibodies (115-485-205, 1:2000; Jackson ImmunoResearch, West Grove, Pennsylvania, USA) and DyLight 549-conjugated AffiniPure Goat Anti-mouse secondary antibodies (111-505-144, 1:2000; Jackson ImmunoResearch) were used for immunofluorescence staining, and the slices were then stained with DAPI (5 µg/mL). Images were captured using Zeiss LSM710 inverted confocal microscope.
The SPlink Detection Kits (ZSGB-BIO, Beijing, China) were used for immunohistochemistry staining and DAB was used as the chromogen. Digital images were captured using Precipoint software (Germany).
To compensate for the personal error, location of GLUT4 signal was classified into three categories: in the perinuclear region, diffused distribution in cytoplasm and on the cell membrane. GLUT4 distribution of each cell can fall into only one of these categories. In the light of GLUT4 translocation process, the priority order is membrane, cytoplasm and perinuclear region.
Glucose uptake
The glucose uptake was measured using a fluorescent D-glucose derivative, 2-NBDG (2-(N-(7-Nitrobenz-2-oxa-1,3-diazol-4-yl)Amino)-2-Deoxyglucose), according to the published procedure.31 For fluorescent microplate reader measurement of 2-NBDG uptake level, 5×10³ cells per well were seeded in 96-well black, clear-bottom culture plate (Corning, New York, USA). After overnight incubation, cells were cultured in serum-free low-glucose (5.5 mM) DMEM for 4 hours and washed twice with serum-free glucose-free DMEM. Then cells were incubated in serum-free glucose-free DMEM supplemented with 100 nM insulin and 100 µM 2-NBDG for 30 min. After incubation, cells were washed out of free 2-NBDG using PBS. The fluorescence retained in cell monolayers was measured with a fluorescence microplate reader (Thermo Fisher Scientific, Massachusetts, USA), set at an excitation wavelength of 485 nm and emission wavelength of 535 nm. The representative 2-NBDG uptake images were captured using Leica DMI6000 inverted fluorescence microscope.
To detect glucose consumption, primary adipocytes were starved for 6 hours with serum-free DMEM, and then cultured in DMEM supplemented with 0.2% BSA and 100 nM insulin for 24 hours. Glucose oxidase method was applied to determine the glucose concentration in culture medium.32 Glucose consumption per hour of adipocytes was calculated by multiplying the glucose concentration difference in the supernatant before and after culturing by the reaction volume and then dividing the above product by the reaction time. To reduce the variation caused by the number of cells in each well, the total protein in each well was extracted and determined by BCA method. Thus, glucose consumption was presented as glucose consumption per mg protein per hour (mmol/(mg·hour)).
Statistics
GraphPad Prism V.7.00 for Windows (GraphPad Software, San Diego, California, USA) was used for standard statistical analysis of the data. Data were presented as mean±SEM. Simple pairwise comparisons were made using unpaired two-tailed t tests. Multiple comparisons were made using two-way analysis of variance (ANOVA) with Bonferroni post-tests. Comparison of proportion was evaluated by χ2 test. P value <0.05 was considered to be statistically significant.
Results
Hap1 mRNA and protein levels were downregulated in adipose tissue of diabetic mice
We first examined HAP1 expression in adipose tissue with western blotting. Results showed that HAP1 was expressed in adipose tissue (figure 1A). HAP1 expression in adipocytes was confirmed with immunofluorescence and immunohistochemistry staining in an intracellular location and particularly in perinuclear compartment (figure 1B,C). The negative control was shown in online supplemental figure S3.

Decreased expression of huntingtin-associated protein 1 (HAP1) in high-fat diet (HFD)-induced diabetic mice. (A) Mouse adipose and brain tissues were harvested for detection of HAP1 by western blotting. Sample from wild-type (WT) brain was used as a positive control, and sample from Hap1-/- brain was used as a negative control. (B) Immunofluorescence staining of adipose tissue for HAP1 (green). Scale bar, 25 µm. (C) Immunohistochemistry staining of adipose tissue for HAP1. Scale bar, 50 µm. (D and E) Adipose tissues were harvested from both HFD and normal diet (ND)-fed mice at 25 weeks. (D) Hap1 mRNA quantification with quantitative PCR. β-actin was used as the internal reference (n=3 animal per group). (E) HAP1 protein assessed by western blotting. Glyceraldehyde 3-phosphate dehydrogenase (GAPDH) was used as a loading control (n=5 per group). Data are presented as mean±SEM. *p<0.05, ***p<0.001 (unpaired two-tailed t tests). DAPI, 4′,6-diamidino-2-phenylindole.
To investigate the expression of Hap1 under diabetic condition, HFD-induced diabetic model was applied. The glucometabolic parameters were monitored to confirm the model was successful (online supplemental figure S4). RT-qPCR analysis showed that mRNA expression of Hap1 in adipose tissue was significantly lower in HFD-fed group than in ND-fed group (figure 1D), and the protein levels of HAP1 also downregulated (figure 1E). The results suggested that HAP1 was reduced in adipose of HFD-fed mice and might take a part in the onset of diabetes.
Reduction of Hap1 expression attenuated insulin-stimulated glucose uptake
Since the homozygote mice (Hap1-/-) could not survive to adulthood,33 heterozygous mice (Hap1+/-) were used to investigate the impact of HAP1 on systemic glucose homeostasis, and glucometabolic parameters were assessed. We found Hap1+/- mice showed glycometabolism disorder and a greater risk of developing diabetic symptoms. First, the size and body weight of Hap1+/- mice increased compared with WT mice (figure 2A). Despite Hap1+/- mice showed normal fasting glucose level (figure 2B), the plasma insulin level of Hap1+/- mice decreased (figure 2C). After intraperitoneal injection of glucose, the glucose tolerance curve in Hap1+/- mice was different from that of WT mice. Hap1+/- mice had larger glucose excursion range than WT mice (figure 2D). Meanwhile, Hap1+/- mice showed delayed glucose excursion after insulin stimulation and their blood glucose level could not return to the fasting level at 90 min. Although the area under the insulin tolerance curves were similar, ITT results were significantly different between Hap1+/- and WT mice when analyzed by two-way ANOVA (p<0.001), indicating Hap1+/- mice had a delayed response to insulin stimulation (figure 2E). Moreover, the glucose level decreased slower at 30 min in ITT in Hap1+/- mice than in WT mice (analyzed by t-test, p<0.05) (figure 2E). The above results showed that Hap1+/- mice exhibited an abnormal glucose metabolism phenotype. However, this might be either due to decreased insulin secretion (figure 2C) or due to disturbed insulin response.
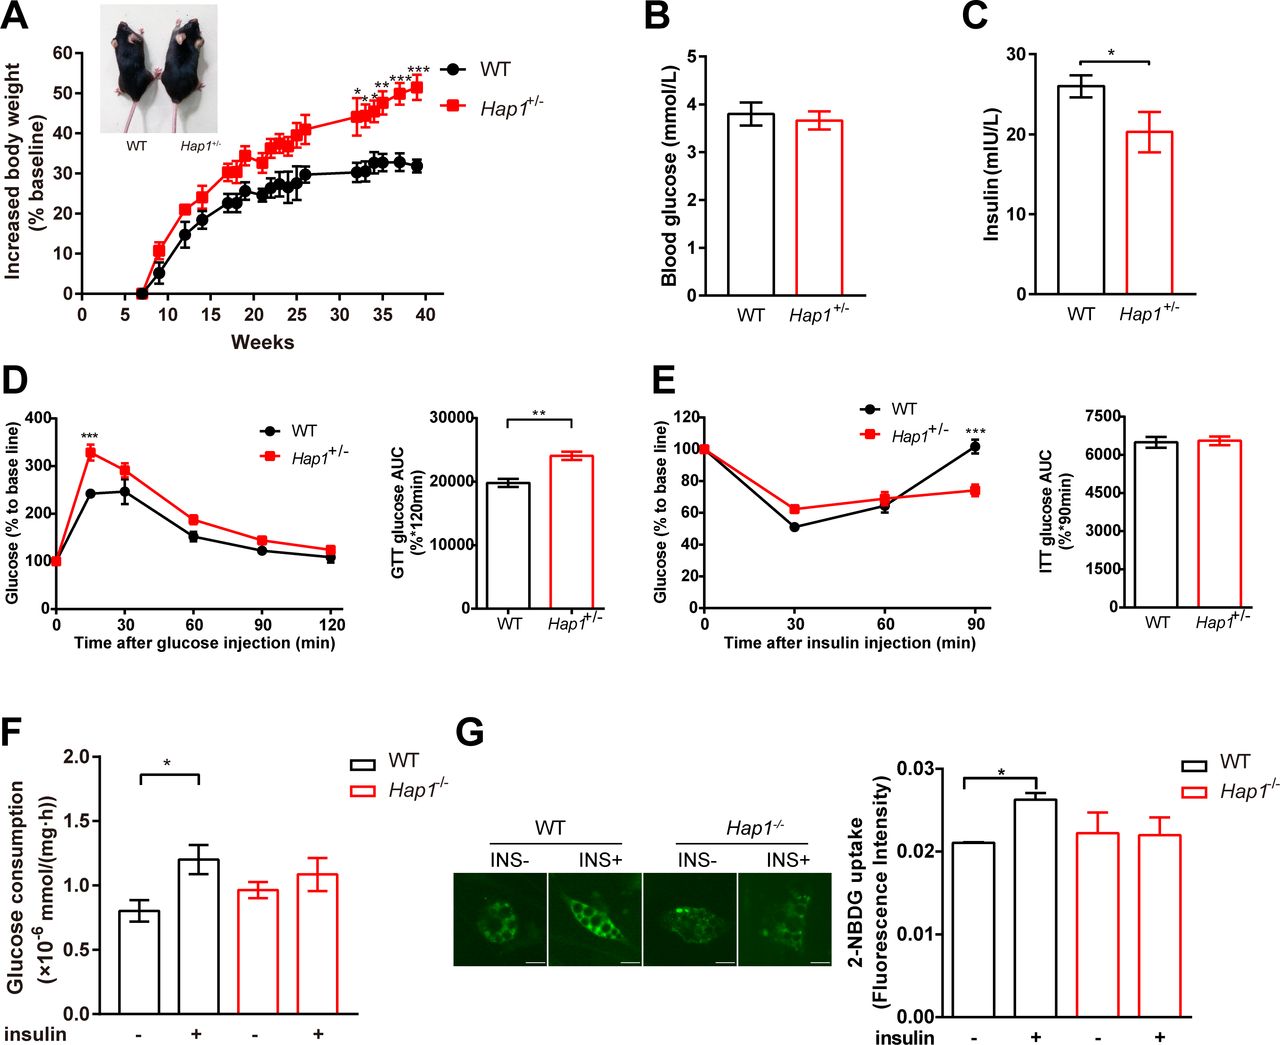
Impaired glucose uptake in Hap1+/- mice as well as in Hap1-knocked out adipocytes. Hap1+/- and WT mice were fed with ND, and glucometabolic parameters were monitored. (A) Representative images of Hap1+/- (32 g body weight) and WT (26 g) mice at week 40 and kinetics of body weight increase rate of mice (n=6 for Hap1+/- mice and n=4 for WT mice), p<0.001 for genotype effect across all time points (two-way ANOVA). (B) Blood glucose levels of mice fasting for 16 hours at 25 weeks (n=7 for Hap1+/- mice and n=4 for WT mice), p=0.2589. (C) Plasma insulin levels of Hap1+/- ± (n=5 per group), *p<0.05. (D) Relative blood glucose levels and AUC during a GTT at 25 weeks (n=7 for Hap1+/- mice and n=4 for WT mice), p=0.0018 for genotype effect (two-way ANOVA), p=0.012 for genotype and time interaction. (E) Relative blood glucose levels and AUC during an ITT at 25 weeks (n=6 for Hap1+/- mice and n=4 for WT mice), p<0.001 for genotype and time interaction. (F) Glucose consumption in primary Hap1-/- and WT adipocytes after 24-hour insulin stimulation (n=9 per group). (G) The representative images and microplate fluorimeter measurement of 2-NBDG uptake of primary Hap1-/- and WT adipocytes in the absence (0 nM) and presence (100 nM) of insulin for 30 min (scale bar, 20 µm, n=3 per group). Data are presented as mean±SEM. *p<0.05, **p<0.01 and ***p<0.001 (unpaired two-tailed t tests for bar charts; two-way ANOVA with Bonferroni multiple comparisons test for time plots, for Hap1+/- versus WT mice at time point shown). ANOVA, analysis of variance; AUC, area under the curve; GTT, glucose tolerance test; HAP1, huntingtin-associatedprotein 1; INS, insulin; ITT, insulin tolerance test; 2-NBDG, 2-(N-(7-Nitrobenz-2-oxa-1,3-diazol-4-yl)Amino)-2-Deoxyglucose; ND, normal diet; WT, wild type.
To find out which was the possible reason for the abnormal glucose metabolism in Hap1+/- mice, we used the same amount of insulin to stimulate primary adipocytes derived from Hap1-/- and WT mice. Glucose consumption for 24 hours (long-term effect)32 and 30 min (instantaneous response to insulin) was measured. Primary Hap1-/- adipocytes showed lower glucose consumption in response to insulin stimulation compared with WT cells (figure 2F), and the acute insulin-stimulated glucose uptake was also decreased in Hap1-/- adipocytes (figure 2G). Hence, the insulin response in Hap1-/- adipocytes was attenuated. Taken together, figure 2 data suggested that the deficiency of HAP1 might lead to a delayed glucose response to insulin stimulation and contribute to the development of T2DM in Hap1+/- mice.
GLUT4 translocation was nearly abolished in Hap1-/- adipocytes
It is known that GLUT4 is the main insulin-sensitive glucose transporter responsible for glucose uptake. GLUT4 can increase the cellular glucose uptake via translocation of intracellular vesicles to plasma membrane under insulin stimulation.8 Since HAP1 is important in vesicle trafficking, we speculate that HAP1 might be involved in the trafficking of GLUT4 vesicles in adipocytes.10 11 14 16 To assess the direct impact of HAP1 on GLUT4 translocation, we stimulated primary adipocytes with insulin and monitored GLUT4 translocation using fluorescence microscopy. As shown in line-scan analysis and quantification result (figure 3A,B), the typical insulin-responsive translocation of GSVs from perinuclear region to plasma membrane was absent in Hap1-/- cells during insulin stimulation (analyzed by χ2 test, p<0.0001). Figures with more cells at low magnification were in online supplemental figure S5 to prove that the results are not unique but common. Furthermore, plasma membrane-bound GLUT4 in Hap1-/- cells was not changed before and after insulin stimulation compared with that of WT cells (figure 3C). Taken together, these data suggest that HAP1 may play a direct role in GLUT4 translocation.

Regulation of glucose transporter isoform 4 (GLUT4) translocation in adipose tissue by huntingtin-associatedprotein 1 (HAP1). (A) Immunofluorescence staining of GLUT4 (left) with cultured primary adipocytes from wild-type (WT) and Hap1-/- mice after 30 min insulin stimulation following 2-hour starvation and line-scan quantifications for the indicated lines drawn across the cells (right). The GLUT4 signal on the cell membrane is indicated by the black arrow. Scale bar, 20 µm. (B) The proportion of primary adipocytes with different GLUT4 immunofluorescence distribution at basal state and after 30 min insulin (INS) stimulation (n=24 for Hap1-/- cells and n=56 for WT cells) (χ2 test p<0.0001). (C) Detection of membrane-bound GLUT4 in primary Hap1-/- and WT adipocytes after 30 min insulin stimulation following 2-hour starvation by western blotting. Na/K-ATPase was used as a membrane loading control. Data are presented as mean±SEM from three independent experiments. **p<0.01 (unpaired two-tailed t tests). DAPI, 4′,6-diamidino-2-phenylindole.
HAP1 interacted with GLUT4 in vivo and in vitro
To investigate whether HAP1 could interact with GLUT4, HEK293 cells were cotransfected with HAP1-CFP and GLUT4-mCherry. There are two isoforms of HAP1: HAP1A and HAP1B. They have same N-terminal sequences and different C-terminal sequences, while the protein-binding domains are on the N-terminal. HAP1A is the main isoform involved in intracellular transport and the most studied isoform at present, so the HAP1 plasmid used here encodes HAP1 isoform A. These two molecules were colocalized in an intracellular location (figure 4A). The similar observation was also confirmed in WT mouse adipose tissue and adipocytes (figure 4A). The Co-IP assays results showed the detection of HAP1 protein in GLUT4 immunoprecipitated samples in HEK293 cells and in vivo adipose tissue (figure 4B, upper row, lanes 3 and 6) and vice versa (figure 4B, lower row, lanes 3 and 6), compared with negative control (figure 4B, lanes 2 and 5) and positive control (figure 4B, lanes 1 and 4). The endogenous expression of untransfected HEK293 cells was tested in figure 4C.
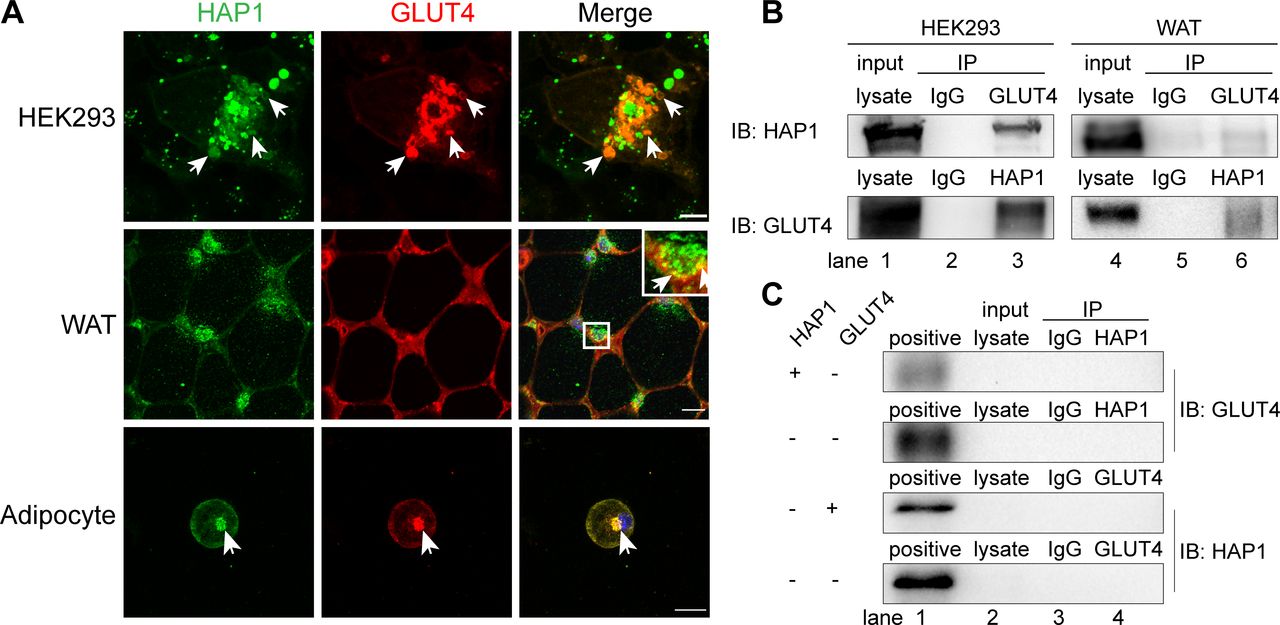
Huntingtin-associatedprotein 1 (HAP1) interacted with glucose transporterisoform 4 (GLUT4) in vivo and in vitro. (A) HAP1 and GLUT4 were colocalized in an intracellular location. Top row: HAP1-CFP and GLUT4-mCherry cotransfected HEK293 cells. Scale bar, 10 µm. Middle row: Double staining of mouse adipose tissue with HAP1 (green) and GLUT4 (red). Scale bar, 100 µm. Bottom row: Double staining of wild-type (WT) primary adipocytes with HAP1 (green) and GLUT4 (red). Scale bar, 20 µm. The nuclei (blue) were stained with 4′,6-diamidino-2-phenylindole (DAPI). (B) Co-immunoprecipitation (Co-IP) assay was applied for identification of the interaction between HAP1 and GLUT4. Detection of HAP1 and GLUT4 in HEK293 cells cotransfected with HAP1 and GLUT4 plasmids (left) and mouse adipose tissue (right) by western blotting. Lanes 1 and 4 for the positive control of total protein lysate, lanes 2 and 5 for the IgG as negative control, and lanes 3 and 6 for the Co-IP sample. (C) Co-IP was applied for the identification of endogenous HAP1 and GLUT4 expression of HEK293 cells. HEK293 cells were with or without HAP1 or GLUT4 plasmid, and the other protein was detected by western blotting. Lane 1 for the positive control of HEK293 cells cotransfected with HAP1 and GLUT4 plasmids’ total protein lysate, lane 2 for total protein lysate of sample for Co-IP, lane 3 for the IgG as negative control and lane 4 for the Co-IP sample. IB, immunoblotting; IP, immunoprecipitation; WAT, white adipose tissue.
HAP1 formed a protein complex with GLUT4 via sortilin
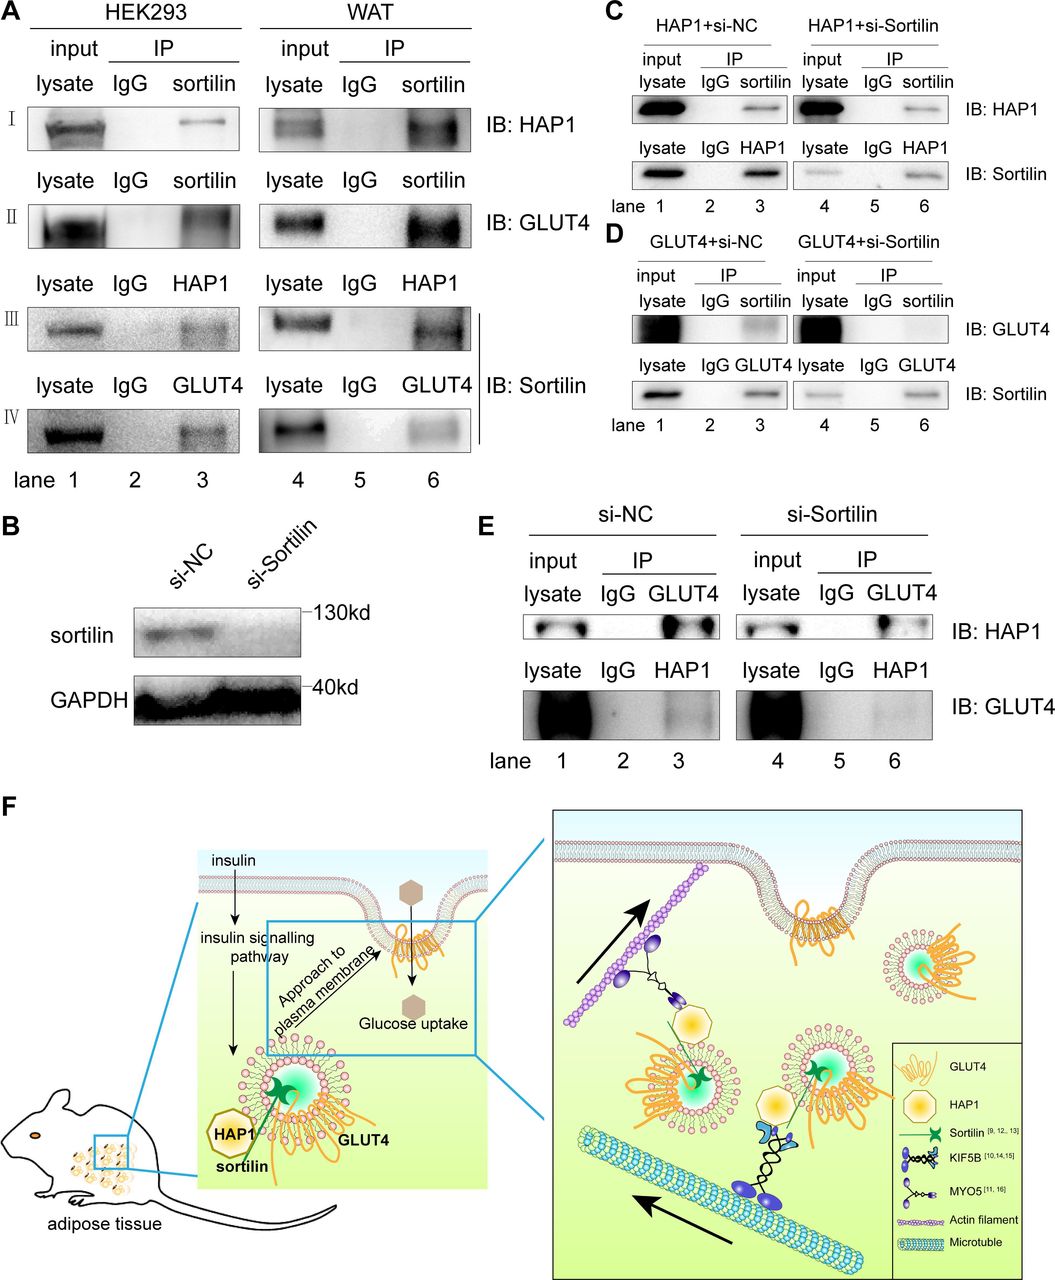
Sortilin is one of the components of GSV, which is necessary for GLUT4 vesicle formation, transport and glucose storage.13 34 35 Since sortilin has been reported to interact with GLUT4 and HAP1, respectively,9 12 13 we tested the hypothesis that GLUT4, HAP1 and sortilin could form a complex. We found both HAP1 and GLUT4 were present in the sortilin-immunoprecipitated sample (figure 5A, rows I and II, lane 3), and the presence of sortilin was detected in both HAP1 and GLUT4 immunoprecipitated samples of cotransfected HEK293 cells (figure 5A; rows III and IV, lane 3). To confirm the interaction of the three proteins in vivo, adipose tissue was used for Co-IP assays and showed the similar results (figure 5A, lanes 4–6). These data supported the formation of HAP1, GLUT4 and sortilin complex.
Huntingtin-associatedprotein 1 (HAP1) formed a protein complex with glucose transporterisoform 4 (GLUT4) via sortilin. (A) Co-immunoprecipitation (Co-IP) was applied for identification of the interaction among HAP1, GLUT4 and sortilin. Detection in HEK293 cells cotransfected with HAP1 and GLUT4 plasmids (left) and mouse adipose tissue (right) by western blotting. (B) Sortilin protein expression was detected after 48-hour interference. (C) HEK293 cells were transfected with HAP1 plasmids and interfered with or without si-Sortilin, and proteins were collected for Co-IP. (D) HEK293 cells were transfected with GLUT4 plasmids and interfered with or without si-Sortilin, and proteins were collected for Co-IP. (E) HEK293 cells were cotransfected with HAP1 and GLUT4 plasmids; meanwhile, sortilin was reduced by small interfering RNA (siRNA). Interaction between HAP1 and GLUT4 was detected in sortilin-siRNA or sortilin-scramble-treated HEK293 cells. Lanes 1 and 4 for the positive control of total protein lysate, lanes 2 and 5 for the IgG as negative control, and lanes 3 and 6 for the Co-IP sample. (F) The schematic model and proposed mechanism of HAP1, GLUT4 and sortilin–protein complex involved in the insulin-stimulated GLUT4 translocation. In mouse adipocytes, HAP1 forms a complex with GLUT4 via sortilin and interacts with motor proteins, promoting the GLUT4 transport along cytoskeleton. GAPDH, glyceraldehyde 3-phosphate dehydrogenase; IB, immunoblotting; IP, immunoprecipitation; KIF5B, kinesin family motorprotein 5; MYO5, myosin 5; NC, negative control; WAT, white adipose tissue.
To identify the association among the three proteins, Co-IP assays were performed with single plasmid transfected or sortilin-siRNA/two plasmids cotransfected HEK293 cells. Sortilin was detected in HAP1 or GLUT4 immunoprecipitated samples of HEK293 cells transfected with HAP1 or GLUT4 plasmid, respectively (figure 5C,D). The results showed that sortilin bound with HAP1 and GLUT4, respectively, which is consistent with published data.9 12 13 When endogenous sortilin was knocked down by sortilin-siRNA (figure 5B), the association between HAP1 and GLUT4 was nearly abolished (figure 5E), which indicates the interaction between HAP1 and GLUT4 was mediated by sortilin.
Discussion
Prior studies have recorded the importance of HAP1 in feeding behavior. HAP1 is involved in the intracellular trafficking of the GABA(A) receptor. Decreased expression of mouse hypothalamic HAP1 reduces the level and activity of hypothalamic GABA(A) receptors, leading to declined food intake and body weight.33 36–38 These findings indicate HAP1 may regulate body energy metabolism by regulating neuronal function. However, our study with Hap1 knockdown mice showed higher body weight from week 25. This could not be explained by decreased food intake. On the other hand, the fact that blood insulin levels regulate the expression of hypothalamic and brainstem HAP1,37 38 and HAP1 regulates insulin release from pancreatic β-cells by regulating actin-based internalization of insulin endosomes,11 39 which is proved by our plasma insulin results. Recently, Shieh et al speculated HAP1 may regulate the intracellular transport of GLUTs in neurons along with motor proteins and be the bridge linking Alzheimer’s disease and diabetes.40 These all suggest HAP1 may be closely related to the maintenance of glucose homeostasis in vivo, but the mechanism still is complicated. The fasting blood glucose levels in severe insulin secretion defected mice at 24 weeks is much higher than the WT mice,41 while the fasting blood glucose levels in the Hap1+/- mice was similar to WT mice. This is indicating that the abnormal glucose metabolism phenotype may not be due to the mild decrease of insulin secretion. The GTT curves of β-cell-conditional Hap1+/- mice did not show any significant difference from that of the WT mice,42 but global Hap1 knockdown mice in our study showed delayed metabolic rate of high glucose level. The above fact suggests the involvement of Hap1 in other tissues in the glucose metabolism. Hap1+/- mice exhibited higher blood glucose level compared with WT mice after exogenous insulin injection, a manifestation of insulin resistance, indicating that HAP1 is involved in the process of insulin-mediated glucose uptake. Thus, we proposed a new perspective on the role of HAP1 in body metabolic homeostasis by regulating glucose uptake.
As one of the insulin target tissues, adipose tissue is involved in the development of insulin resistance and is the main culprit of diabetes.43 Although the Human Integrated Protein Expression Database suggests that HAP1 may be overexpressed in adipocyte, there was no direct evidence.44 Our results demonstrate the expression of HAP1 in adipose tissue for the first time.
As a cytoplasmic transporter, HAP1 interacts with multiple trafficking-related proteins and regulates protein anterograde and retrograde transport in nervous system.45–49 One of the interaction proteins of HAP1 in neuron is sortilin. HAP1 forms a protein complex with sortilin and pro-BDNF and prevents pro-BDNF degradation.9 Sortilin plays a role in the trafficking of different proteins and participates in vesicle formation, clathrin-mediated endocytosis, vesicle transport and sorting in cells. In adipocytes, sortilin is the major component of GSV and acts as a transmembrane scaffold by aggregating other GSV components.12 Furthermore, sortilin participates in the transport of GLUT4 and protects GLUT4 from being sorted into lysosomes for degradation, via binding to the first luminal loop of GLUT4 with its luminal Vps10p domain.13 Based on the previous research and our results of HAP1 deficiency in adipocytes leading to a decrease of insulin-stimulated membrane-bound GLUT4 and the finding of HAP1–sortilin–GLUT4 complex, we hypothesize that HAP1–sortilin–GLUT4 complex may help with GSV stabilization during its translocation.
On the activation of insulin signaling, GSVs in the cytoplasm are transported along the microtubules to the cellular cortex by insulin-regulated kinesin motors (such as KIF5B), where myosin motors (MYO5 and MYO1C) continue to transport GSVs to the plasma membrane.14 16 50 51 With the help of exocyst complex and Soluble N-ethylmaleimide-sensitive Factor Attachment Protein Receptor (SNARE) proteins, the vesicles are tethered to, and then fuse with plasma membrane.52 GLUT4 localizes to the cell membrane and exerts physiological functions to transport extracellular glucose into the cells. Any factor affecting GLUT4 translocation may lead to insulin resistance, thus lead to decreased glucose uptake and elevated blood glucose. As the cytoplasmic transporter, HAP1 interacts with KIF5B and MYO5,10 11 hence, HAP1 may also participate in the GSVs transport along microtubules and actin.
Taken together, our observation of HAP1–sortilin–GLUT4 complex provides new evidence of the involvement of these molecules in GLUT4 translocation stimulated by insulin and explains the correlation between HAP1 and pathogenesis of T2DM. Here we propose a potential mechanism of HAP1 in GLUT4 translocation: HAP1 forms a complex with GLUT4 via sortilin, such complex stabilizes GSVs, while HAP1 also interacts with motor proteins, such as KIF5B and MYO5, to promote the GSV transport along cytoskeleton (figure 5F).
In summary, we provided the firsthand evidence that HAP1 protein is expressed in adipose tissue and HAP1–sortilin–GLUT4 complex formation may add one more key mechanism for insulin-stimulated GLUT4-mediated glucose uptake. Our study underlines the important role of adipocyte HAP1 in the pathogenesis of T2DM by regulating GLUT4 translocation.
Acknowledgments
We thank Professor Qi Peng (King's College London) and Professor Gaoyuan Cao (Rutgers University) for their linguistic assistance during the preparation of this manuscript; Professor Xinfu Zhou (University of South Australia) for his help in study design; Professor Tinghua Wang (Sichuan University) and Professor Jianguo Qi (Sichuan University) for the technical and equipment support.
References
Supplementary materials
Supplementary Data
This web only file has been produced by the BMJ Publishing Group from an electronic file supplied by the author(s) and has not been edited for content.
Footnotes
Y-JG and YF contributed equally.
G-ZY and XZ contributed equally.
Contributors YF, G-ZY and XZ conceived the studies; Y-JG, YF, G-ZY and XZ provided critical input to study design, interpretation/discussion of results; Y-JG, YF, Y-YC, JZ, WW, Y-YZ, J-RW and XL acquired, analyzed and interpreted data; Y-JG wrote the manuscript. All authors read and approved the final manuscript.
Funding This work was supported by the Office of Science and Technology of Chengdu (grant no: 2016-HM01-00514-SF).
Competing interests None declared.
Patient consent for publication Not required.
Ethics approval All experiments were performed in accordance with the guidelines on the care and use of animals for research purposes by the Institutional Animal Care and Use Committee of Sichuan University, and all the procedures were approved by the Institutional Animal Care and Use Committee of Sichuan University.
Provenance and peer review Not commissioned; externally peer reviewed.
Data availability statement All data relevant to the study are included in the article or uploaded as supplemental information.