Article Text

Abstract
Introduction Epidemiological and genetic studies have recorded the association between proinflammatory cytokines and the development of insulin resistance, diabetes, and cardiovascular disease. The role of interleukin 6 (IL-6), NH2-terminal portion pro-brain natriuretic peptide (NT-proBNP) and resistin in the pathogenesis of heart disease in type 2 diabetes mellitus (T2DM) is still a matter of controversy. The current study aimed to evaluate the role of these biomarkers in the development of left ventricular systolic dysfunction and the ability to use them as non-invasive test in the prediction of left ventricular hypertrophy and systolic dysfunction in T2DM.
Research design and methods 150 participants were included in this case–control study. Patients were divided into two subgroups according to echocardiographic findings: group 1a included 46 patients with type 2 diabetes mellitus and echocardiographic evidence of abnormal systolic function; group 1b included 54 patients with type 2 diabetes mellitus and with normal echocardiogenic study; and group 2 included 50 apparently healthy controls. Routine laboratory investigations such as complete blood count, liver and renal function tests, and lipid profile, serum IL-6, NT-proBNP, and resistin were measured in all participants. Conventional echocardiography was done with special concern on the assessment of left ventricular systolic function (ejection fraction).
Results There was a significant increase in the level of resistin, NT-proBNP and IL-6 in group 1a patients compared with group 1b and in healthy controls. Echocardiographic parameters showed a significant increase in left ventricular mass index, left ventricle posterior wall thickness, interventricular septum thickness, and left ventricle mass in group 1a compared with group 1b and the control group. The increased left ventricular mass index was associated with higher levels of IL-6, NT-proBNP and resistin.
Conclusions Proinflammatory cytokines had a clear relation with left ventricular systolic dysfunction and hypertrophy and can be used as early non-invasive markers for detection of left ventricular remodeling and systolic dysfunction in patients with T2DM.
- interleukin-6
- echocardiography
- adult diabetes
This is an open access article distributed in accordance with the Creative Commons Attribution Non Commercial (CC BY-NC 4.0) license, which permits others to distribute, remix, adapt, build upon this work non-commercially, and license their derivative works on different terms, provided the original work is properly cited, appropriate credit is given, any changes made indicated, and the use is non-commercial. See: http://creativecommons.org/licenses/by-nc/4.0/.
Statistics from Altmetric.com
Significance of this study
What is already known about this subject?
Epidemiological and genetic studies have recorded the association between proinflammatory cytokines and the development of insulin resistance, diabetes, and cardiovascular disease.
The role of interleukin 6 (IL-6), NH2-terminal portion pro-brain natriuretic peptide (NT-proBNP) and resistin in the pathogenesis of heart disease in patients with type 2 diabetes mellitus is still a matter of controversy.
What are the new findings?
There was a significant increase in the level of resistin, NT-proBNP and IL-6 in group 1a patients compared with group 1b and in healthy controls.
Echocardiographic parameters showed a significant increase in left ventricular mass index, left ventricle posterior wall thickness, interventricular septum thickness, and left ventricle mass in group 1a compared with group 1b and the control group.
How might these results change the focus of research or clinical practice?
Proinflammatory cytokines had a clear relation with left ventricular systolic dysfunction and hypertrophy and can be used as early non-invasive markers for detection of left ventricular remodeling and systolic dysfunction in patients with type 2 diabetes mellitus.
Resistin, NT-proBNP, IL-6 and echocardiographic data and suggesting them as diagnostic markers are a subject of great biomedical importance and contribute to knowledge.
Introduction
The American Heart Association designated diabetes mellitus (DM) as a major risk factor for cardiovascular disease (CVD). CVD, stroke, and peripheral vascular disease are the main macrovascular complications of DM.1 Echocardiographic studies on large databases of patients with diabetic heart failure have shown an association with left ventricular hypertrophy (LVH), increased heart mass, and diastolic function.2 The effects of type 2 diabetes mellitus (T2DM) on the heart can be broadly grouped into two main categories: coronary heart disease (CHD) and diabetic cardiomyopathy (DCM), which is characterized by LVH, left ventricular (LV) diastolic dysfunction, LV systolic dysfunction and cardiac autonomic neuropathy.3 4 The common final pathway for both CHD and DCM is clinical heart failure.5
Brain natriuretic peptide (BNP) is a potent vasodilator and a natriuretic factor regulating salt and water hemostasis. It is stored in the human cardiac tissue mainly as BNP-32, with a lesser amount of the precursor pre-proBNP. The circulating plasma forms of BNP are BNP-32 and the NH2-terminal portion proBNP (NT-proBNP).6 BNP and NT-proBNP may be used as a screening test for exercise-induced myocardial ischemia.7 In addition, plasma BNP in patients with systolic heart failure reflects the severity of diastolic abnormality.8 The diagnosis of heart failure due to diastolic dysfunction is usually based on typical symptoms and signs of heart failure in patients with preserved LV systolic function.9
As vascular inflammation has emerged as an important component of CVD, it is critical to elucidate the role of interleukin 6 (IL-6) in hypertension, endothelial dysfunction,10 CHD and congestive heart failure with insulin resistance in T2DM.11 IL-6 level increases in CVD, including atherosclerosis, diabetes, heart failure, and hypertension. Its level is correlated positively with CVD progression.12
Resistin is a 12.5 kD protein rich in cysteine and is produced mainly from activated white blood cells.13 It is a proinflammatory marker that is associated with insulin resistance, atherosclerosis and cardiac outcomes of DM.14 Resistin is produced and released from adipose tissue to serve endocrine functions likely involved in insulin resistance. This idea primarily stems from studies demonstrating that serum resistin levels increase with obesity and involved in energy metabolism and T2DM. Serum resistin levels have been found to decline with decreased adiposity following medical treatment.15
The purpose of our study was to identify the role of these biomarkers in the development of LV systolic dysfunction and the ability to use them as a non-invasive test in the prediction of LVH and systolic dysfunction in T2DM.
Research design and methods
One hundred patients known to have T2DM were involved in this case–control study from January 2018 to March 2019, attending the cardiology outpatient clinic at Shebin El Kom Teaching Hospital and the outpatient clinic of the clinical hepatology and gastroenterology department at the National Liver Institute Hospital, Menoufia University. Patients were divided into two subgroups according to echocardiographic findings: group 1a included 46 patients with T2DM with left ventricular ejection fraction (LVEF <50%), and group 1b included 54 patients with T2DM with normal echocardiographic study (LVEF ≥50%). Fifty apparently healthy volunteers with age and sex matched to patients were enrolled in the study as a control group (group 2). The source of the controls was dependent on the source of the cases, such as their family relatives. Through systematic random sampling, one out of five individuals from the family relatives of the patients in group 1 was selected as the control.
DM was diagnosed according to WHO and the American Diabetes Association as fasting blood glucose ≥126 mg/dL or 2-hour postprandial glucose (PG) ≥200 mg/dL.16
Inclusion criteria included adults aged more than 30 years old and history of T2DM and on regular treatment.
Exclusion criteria included pregnancy, acute coronary syndrome, constrictive pericarditis, acute pericarditis, hypertrophic cardiomyopathy, severe valvular heart disease, atrial fibrillation, history of chronic or acute inflammatory disease in the preceding 3 months, malignancies, autoimmune diseases, and type 1 DM.
A written informed consent from all participants was taken.
All participants underwent the following:
Full history taking and clinical examination.
General examination: assessment of general condition and heart rate and blood pressure.
Cardiac examination for signs of heart failure, cardiac murmurs or cardiomegaly; pulse examination to detect peripheral vascular disease or significant arrhythmia.
Anthropometric measures: measurement of body weight in kilograms and height in meter, from which the body surface area (BSA) was calculated according to the formula of Dubois.17
Echocardiography.

The M-mode measurements obtained included the following:
Two-dimensional guided M-mode measurements were obtained at the left lateral position from the parasternal long-axis view. Values were carefully obtained perpendicular to the LV long axis and measured at or immediately below the level of the mitral valve leaflet tips. In this regard, the electronic calipers were positioned on the interface between the myocardial wall and the cavity, and the interface between the wall and the pericardium, with special attention not to include the overlying trabeculations in the ventricular septum or posterior wall, which may overestimate thickness. Measurements were taken at end diastole (defined as the beginning of the QRS complex), but preferably using the widest LV cavity diameter, and at end systole using the narrowest LV cavity diameter.
End-diastolic thickness of the ventricular septum (IVSD).
End-diastolic thickness of the LV posterior wall (PWD).
End-diastolic LV diameter (LVEDD).
End-systolic LV diameter (LVEDS).
Assessment of LVM and LVMI
Using the previous measured parameters, left ventricle mass (LVM) was calculated using the formula proposed by Devereux, the cube formula18:

LVH was defined as left ventricular mass index (LVMI) ≥105 g/m2 for men and ≥95 g/m2 for women.

LVMI=LVM/BSA
1.04 is the specific gravity of the myocardium and 0.8 is a correction factor. LVMI (g/m²) was calculated by dividing the LVM (g) value by BSA, which was calculated according to the formula of Dubois D and Dubois EF.17
Assessment of LVEF
LVEF was calculated according to the Simpson’s formula:

where images were acquired from the apical four-chamber view at the left lateral position, and where LVEDV is left ventricular end-diastolic volume and LVESV is left ventricular end-systolic volume.19
Laboratory investigations
Blood samples were collected from all participants for routine laboratory investigations (complete blood count, fasting and 2-hour blood sugar, liver and kidney function tests, Prothrombin Time (PT), Activated Partial Thromboplastin Time (APTT) and lipid profile). Blood chemistry was done using a fully automated autoanalyzer Synchron CX9 ALX (Randox, California, USA), and hematology parameters were obtained using an automated Sysmex KX-21 (Sysmex Corporation, Kobe, Japan).
For lipid profile measurement, after an overnight fasting, total serum cholesterol, triglyceride, and high-density lipoprotein cholesterol (HDL-c) were obtained using Synchron CX9 ALX (Randox), while low-density lipoprotein cholesterol (LDL-c) was estimated using Friedewald’s formula.
IL-6, NT-proBNP and resistin were measured in all participants using ELISA (Chongqing Biospes, China). This kit was based on a sandwich ELISA technology.
Statistical analysis
SPSS V.25 computer program was used for statistical analysis. Numerical variables were expressed as mean and SD. Categorical variables were expressed as numbers and percentages. F test was used to compare two variances by dividing them (it always tests whether population variance is equal).
Analysis of variance was performed to compare quantitative variables in more than two groups. P<0.05 was statistically significant. Receiver operating characteristic (ROC) analysis was used to assess the diagnostic performance of the measured serum biomarkers for assessment of LVH and systolic dysfunction. Correlation analysis was done to assess the strength and direction of the relationship between quantitative variables.
The Pearson correlation coefficient was calculated to indicate the strength of association between non-normally distributed numerical variables, where r=1 means a perfect positive correlation coefficient and r=−1 means a perfect negative correlation coefficient.
Results
Table 1 shows there was a statistically significant difference among the three studied groups with regard to diastolic blood pressure and duration of diabetes per year, where group 1a had higher level of diastolic blood pressure and duration of diabetes; however, no statistically significant difference was recorded with regard to systolic blood pressure, body mass index, height and waist circumference.
Comparison among the three studied groups with regard to clinical and anthropometric parameters and laboratory investigations
In terms of the laboratory investigations, there were statistically significant differences among the three studied groups with regard to fasting blood sugar (FBS), 2-hour post prandial blood sugar (2-hrs PPG) and LDL-c, which were higher in group 1a than in group 1b by 18.81 mg/dL, 11.14 mg/dL and 10.14 mg/dL, respectively, and HDL-c, which was lower in group 1a than in group 1b by 8.76 mg/dL. Meanwhile, no statistically significant differences were observed with regard to PT, total cholesterol, APTT and triglycerides (table 1).
The comparison between the DM subgroups and the control group in terms of echocardiographic parameters showed statistically significant differences between both DM subgroups with regard to Left Ventricular Posterior Wall Dimensions (LVPWD), interventricular septum (IVS), LVM, LVMI and Relative Wall Thickness (RWT), where all parameters were higher in group 1a by 11.2%, 9.9%, 23.4%, 27.8% and 13.7%, respectively, than in group 1b. There were statistically significant differences between the control group and group 1a with regard to left ventricle posterior wall thickness (LVPW), IVS, LVM, LVMI and RWT, where all parameters were higher in group 1a by 20.3%, 8%, 21.5%, 22.9% and 9.5%, respectively, than in the control group. There was no statistically significant difference among all groups as regards LVEDD. There were no statistically significant differences between the control group and group 1b as regards all echocardiographic parameters (table 2).
Comparison between echocardiographic parameters in DM subgroups
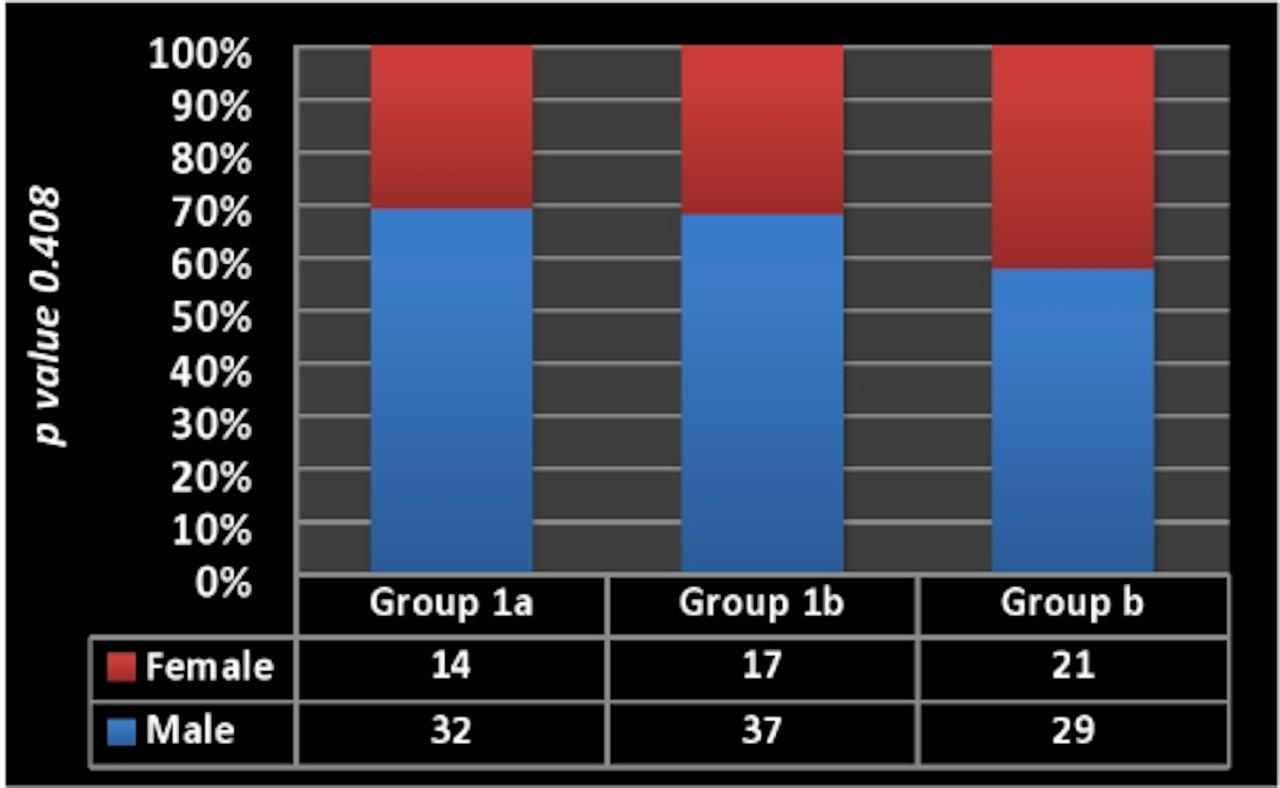
The comparison with regard to IL-6, resistin and NT-proBNP showed a statistically significant difference among all groups (P2). Also, there were statistically significant differences between group 1a and the other 2 groups, where the level of IL-6 in group 1a was 2.12, 3.48-fold than that of group 1b and the control group, respectively; the level of resistin was higher in group 1a by 2.8 and 8.25 ng/dL than group 1b and the control group, respectively; and NT-proBNP level was 2.23 and 7.47 folds higher in group 1a compared to both groups 1b and the control group, respectively (table 3 and figure 1). There was no statistically significant difference among all groups with regard to gender (figure 2).
Comparison between the studied groups with regard to IL-6, resistin and NT-proBNP

Comparison among the studied groups with regard to IL-6, resistin and NT-proBNP. There was a significant difference among the three groups, where all parameters were higher in group 1a. IL-6, interleukin-6; NT-proBNP, NH2-terminal portion pro-brain natriuretic peptide.

Gender distribution in all studied groups. There was no significant difference among the three groups as regards gender distribution.
Table 4 shows there were statistically significant positive correlations between all biomarkers (NT-proBNP, IL-6, and resistin); a statistically significant inverse correlation between hemoglobin and all biomarkers except resistin; a statistically significant positive correlation between total cholesterol and both NT-proBNP and resistin; a statistically significant inverse correlation between HDL-c and both NT-proBNP and resistin; and a statistically significant positive correlation between triglycerides and NT-proBNP. Regarding echocardiographic parameters, there were statistically significant positive correlations between all biomarkers (NT-proBNP, IL-6, and resistin) and LVPW thickness, IVS thickness, LVM, LVMI and RWT, while LVEDD had only statistically significant positive correlation with IL-6. There was no statistically significant difference among all groups as regards smoking, hypertension, obesity, gender, or drug use (table 5).
Correlation between NT-proBNP, IL-6, resistin, laboratory investigations and echocardiographic parameters in patients with diabetes
Comparison among the three groups as regards risk factors and drug treatment, by χ2 test then one-way analysis of variance
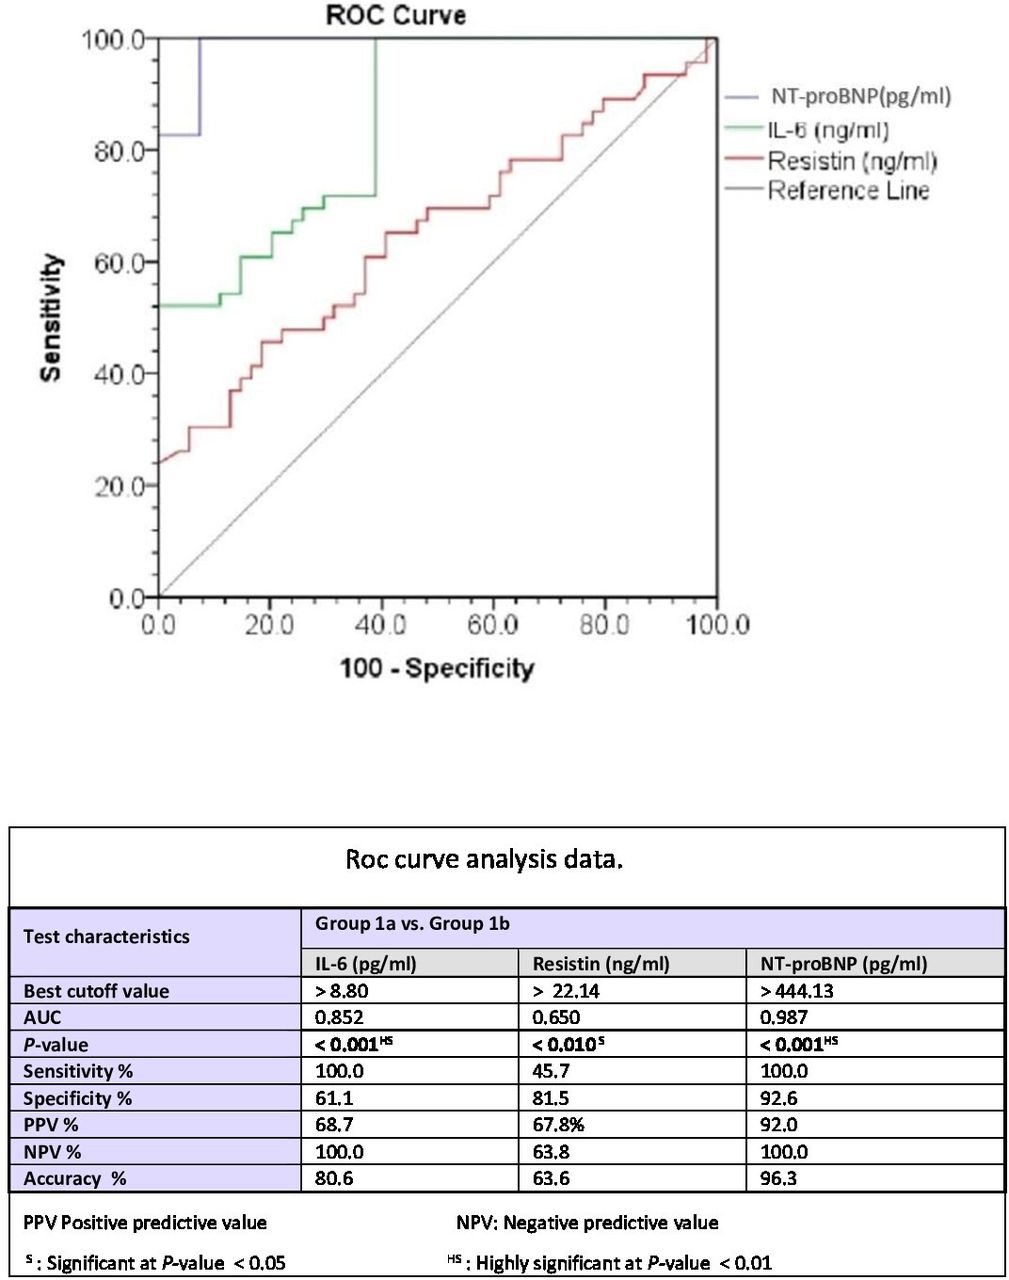
For discrimination between group 1a and group 1b plus detection of LV systolic dysfunction in patients with T2DM, ROC analysis estimated a sensitivity of 100%, 45.7%, and 100%, specificity of 61.1%, 81.5%, and 92.6%, positive predictive value of 68.7%, 67.8%, and 92%, negative predictive value of 100%, 63.8%, and 100%, and accuracy of 80.6%, 63.6%, and 96.3%, at the best cut-off value of >8.8 pg/mL, >22.14 ng/ mL and >444.13 pg/dL for IL-6, resistin and NT-proBNP, respectively, determined by calculating Youden index J. The area under the curve (AUC) was 0.852, 0.650, and 0.987, with a highly significant associated p<0.001, significantly associated p<0.01 and a highly significantly associated p<0.001 for IL-6, resistin and NT-proBNP, respectively (figure 3).

ROC curve analysis of IL-6, resistin, and NT-proBNP with regard to detection of left ventricular systolic dysfunction. AUC, area under the curve; IL-6, interleukin-6; NT-proBNP, NH2-terminal portion pro-brain natriuretic peptide; ROC, receiver operating characteristic.
Discussion
Studies about the role of proinflammatory cytokines in the pathogenesis of heart disease in T2DM are still not efficient. This study aimed to reveal the association between the circulating levels of three biomarkers (resistin, Nt-proBNP and IL-6) and LV systolic function in patients with T2DM and evaluate them as markers of LVD (left ventricular systolic dysfunction). One hundred and fifty participants participated in this study: 100 patients with T2DM and 50 healthy controls. Patients were divided after echocardiography into two subgroups: group 1a included 46 patients with T2DM and LVD (EF <50%), and group 1b included 54 patients with T2DM and normal EF (EF ≥50%).
This study found that there were statistically significant differences among the three studied groups with regard to diastolic blood pressure and duration of diabetes per year.
There were statistically significant differences among the three studied groups with regard to FBS, 2-hour PPBS (higher in group 1a), HDL-c (lower in group 1a), and LDL-c (higher in group 1a). Longer duration of DM with increased level of LDL and decreased HDL can explain the higher level of the proinflammatory markers in group 1a, and this is in agreement with Kim et al,20 who stated that individuals with dyslipidemia have higher levels of inflammatory biochemical markers than those without dyslipidemia. Also, Lian et al21 found that inflammation had a strong role in the development of dyslipidemia.
Consistent with our results, Magnusson et al22 found that patients with T2DM had higher NT-proBNP values than control subjects. NT-proBNP levels were independently related to diabetes after adjustment for age, sex, systolic and diastolic blood pressure, body mass index, heart rate, drug treatment, serum creatinine and cystatin C. The secretion of NT-proBNP was increased in patients with T2DM with no overt heart disease, suggesting that T2DM was associated with a higher prevalence of LVD and thus NT-proBNP might serve as a screening biomarker to select patients with T2DM who could benefit from an echocardiographic examination.
Richards et al23 demonstrated that the combination of NT-proBNP and DM in patients with stable CHD provides independent prognostic information on all-cause mortality. Dencker et al24 evaluated the relationship between natriuretic peptide levels and a wide range of echocardiography parameters in 32 patients with poorly regulated T2DM and unknown heart failure. They found a significant increase in the levels of both BNP and NT-proBNP in patients with abnormal diastolic function as compared with those with normal diastolic function.
Zhuravlyova and Sokolnikova25 reported a positive correlation of IL-6 and resistin with systolic and diastolic functions of the heart, increasing the functional and structural morbidity of the cardiac muscles.
Our study revealed statistically significant differences among the three studied groups with regard to biomarkers (NT-proBNP, IL-6, and resistin), with increased levels in group 1a. The inflammatory roles of these biomarkers and the longer duration of DM might explain their higher level in group 1a than in other groups and confirmed their role in the pathogenesis of DM as a chronic inflammatory disease.
Magnusson et al22 reported higher NT-proBNP values in patients with T2DM than control subjects. In addition, Palazzuoli et al8 discussed the correlation between the role of high plasma BNP in patients with systolic heart failure and the severity of diastolic abnormality.
Similarly, Shinohara et al11 suggested that inflammatory markers were independent predictors of cardiovascular events in older persons. IL-6, released in response to tissue injuries and infections, related to host defense through the stimulation of acute phase responses, hematopoiesis, and immune reactions. The high serum level of IL-6 had a predictive function in the pathogenesis of insulin resistance and cardiac complications in patients with diabetes.26–31
Also, Cheng et al32 found that increased plasma concentrations of resistin were strongly associated with subsequent development of heart failure. The association of resistin with heart failure persisted after adjustment for established heart failure risk factors, obesity, markers of insulin resistance and inflammation, and concentrations of NT-proBNP, and after exclusion of prevalent and incident CHD. Erer et al33 concluded that serum resistin concentration was elevated in patients with acute STEMI (sustained ST segment elevation of myocardial infarction), and this increase was more obvious in patients with T2DM than in those without diabetes.
Another finding in our study is the statistically significant positive correlation between all biomarkers (NT-proBNP, IL-6, and resistin) and myocardial indices (LVPW thickness, IVS thickness, LVM, LVMI and RWT), while LVEDD had only statistically significant positive correlation with IL-6. The relation between inflammation and cardiac remodeling and heart failure has been mentioned in many previous studies.4 34 35
Valle et al36 confirmed the diagnostic and prognostic role of BNP in systolic dysfunction evaluation.
Tuttolomondo et al12 explained the positive correlation between IL-6, resistin and vascular complications of DM. Zhuravlyova and Sokolnikova25 revealed a positive correlation between resistin, IL-6 and cardiac outcomes in T2DM, which played a role in the functional and structural morbidity of the cardiac muscles, reducing their systolic and diastolic functions.
The high level of resistin and IL-6 was correlated with LVH and systolic dysfunction in Toczylowski et al.37
On ROC analysis of NT-proBNP, its cut-off level was 444.13 pg/ml, with an AUC of 0.987 (p<0.001), sensitivity of 100% and specificity of 92.6%, which mean that NT-proBNP is a novel, sensitive, specific predictor biomarker for T2DM.
Similarly, NT-proBNP ROC curve analysis by Castaño Rodríguez et al38 revealed a cut-off level of 490 pg/mL for detection of ischemia in patients with both T2DM and hypertension, which yielded an AUC of 0.864, sensitivity of 84% and specificity of 75% in detecting LVH and systolic dysfunction; therefore, the level of NT-proBNP may be considered a promising biomarker for detection of Ischemic Heart Disease (IHD).
Kara et al39 reported the superior role of NT-proBNP over BNP in early prediction of CHD. Baba et al40 explained the roles of nitro-BNP in the diagnosis and screening of CHD, atrial fibrillation and heart failure.
ROC analysis of IL-6 estimated an AUC of 0.852, sensitivity of 100%, specificity of 61.1% and accuracy of 80.6% at the best cut-off value of >8.8 pg/mL (p<0.001). IL-6 is a good predictive, specific and sensitive marker.
Tuttolomondo et al12 reported that an IL-6 level >4.8 pg/mL (p<0.005) was significantly correlated with all outcomes (CHD events, stroke events and Congestive Heart Failure (CHF) events). Shinohara et al11 suggested the high predictive value of IL-6 level >2.5 pg/mL (p<0.031) in screening for early cardiac complication in T2DM before a structural heart disease.
Similarly, Phosat et al41 measured the levels of IL-6 and other inflammatory markers (tumor necrosis factor-α, C reactive protein) and showed these were significantly associated with increased risk of diabetes.
The current study showed that ROC analysis of resistin recorded an AUC of 0.65, sensitivity of 45.7%, specificity of 81.5% and accuracy of 63.6%, at the best cut-off value of >22 ng/mL (p<0.01). Therefore, resistin has good predictive value and high specificity, but with poor sensitivity.
Limitations of this study
We did not use a non-diabetic group with LV systolic dysfunction to compare their level of inflammatory markers with a diabetic group with systolic dysfunction, in order to confirm the effect of DM. We did not use new methods for assessment of subtle systolic dysfunction such as speckle tracking. Also we did not use the diastolic function assessment indices in the comparison between the studied groups.
Conclusion
The elevated levels of IL-6, NT-proBNP and resistin in T2DM support their possible role or inflammatory process in diabetogenesis. These markers may serve as non-invasive screening and new prospective prehypertrophic markers for LV remodeling and for detection of dysfunction, especially in asymptomatic patients with T2DM, and help to select patients with T2DM who could benefit from an echocardiographic examination. The specific mechanism whereby resistin and IL-6 promote CVD remains to be elucidated, and needs further study on a wide scale of population with long-term follow-up, as well as further genetic studies.
Acknowledgments
The authors have the pleasure of dealing with the journal and would like to thank and hope that this research work would be under their kind care and observation.
References
Footnotes
Contributors All authors made substantial contributions to conception and design, acquisition of data, or analysis and interpretation of data; took part in drafting the article or revising it critically for important intellectual content; gave final approval of the version to be published; and agree to be accountable for all aspects of the work.
Funding The authors have not declared a specific grant for this research from any funding agency in the public, commercial or not-for-profit sectors.
Competing interests None declared.
Patient consent for publication Not required.
Ethics approval The study was reviewed and approved by the ethical committee at the National Liver Institute (IRB number 00199), Menoufia University. The study was conducted in accordance with Good Clinical Practice guidelines and the Declaration of Helsinki after local ethical committee approval.
Provenance and peer review Not commissioned; externally peer reviewed.
Data availability statement No data are available.