Article Text

Abstract
Introduction The objective of this study was to examine recent trends in diagnosed diabetes prevalence for American Indian and Alaska Native (AI/AN) adults aged 18 years and older in the Indian Health Service (IHS) active clinical population.
Research design and methods Data were extracted from the IHS National Data Warehouse for AI/AN adults for each fiscal year from 2006 (n=729 470) through 2017 (n=1 034 814). The prevalence of diagnosed diabetes for each year and the annual percentage change were estimated for adults overall, as well as by sex, age group, and geographic region.
Results After increasing significantly from 2006 to 2013, diabetes prevalence for AI/AN adults in the IHS active clinical population decreased significantly from 2013 to 2017. Prevalence was 14.4% (95% CI 13.9% to 15.0%) in 2006; 15.4% (95% CI 14.8% to 16.0%) in 2013; and 14.6% (95% CI 14.1% to 15.2%) in 2017. Trends for men and women were similar to the overall population, as were those for all age groups. For all geographic regions, prevalence either decreased significantly or leveled off in recent years.
Conclusions Diabetes prevalence in AI/AN adults in the IHS active clinical population has decreased significantly since 2013. While these results cannot be generalized to all AI/AN adults in the USA, this study documents the first known decrease in diabetes prevalence for AI/AN people.
- American Indian(s)
- adult diabetes
This is an open access article distributed in accordance with the Creative Commons Attribution Non Commercial (CC BY-NC 4.0) license, which permits others to distribute, remix, adapt, build upon this work non-commercially, and license their derivative works on different terms, provided the original work is properly cited, appropriate credit is given, any changes made indicated, and the use is non-commercial. See: http://creativecommons.org/licenses/by-nc/4.0/.
Statistics from Altmetric.com
Significance of this study
What is already known about this subject?
Diabetes prevalence in American Indian and Alaska Native (AI/AN) people is the highest of any racial or ethnic group in the USA, but no recent trends have been published.
What are the new findings?
After increasing significantly from 2006 to 2013, diabetes prevalence for AI/AN adults overall decreased significantly from 2013 to 2017.
The trends for AI/AN men and women were similar to the overall adult population, with women consistently having slightly higher prevalence than men.
All age groups had significant increases in diabetes prevalence from 2006 to 2013 or 2014 and then decreased significantly.
For all geographic regions, diabetes prevalence either decreased significantly or leveled off in recent years. There were considerable differences in prevalence across geographic regions, with Alaska consistently having the lowest and Southwest subregion 2 consistently having the highest.
How might these results change the focus of research or clinical practice?
Determine if these trends continue and seek to ascertain the underlying reasons for the improvements. Sustained efforts in diabetes prevention, treatment, and surveillance are crucial to ensure continued advances in the health of AI/AN people.
Introduction
Diabetes prevalence in American Indian and Alaska Native (AI/AN) adults is the highest of any US racial or ethnic group, approximately twice that of US white adults according to a recent national report.1 Disparities in AI/AN diabetes prevalence have been documented since the 1970s,2 3 and subsequent studies demonstrated that prevalence continued to increase.4 In recent years, decreases have been reported among AI/AN people in diabetes-related mortality5 and in the prevalence of at least some diabetes complications,6 7 but trends in diabetes prevalence have not been published.
Estimates of diabetes prevalence for the USA overall and different racial/ethnic groups are generally calculated using data from national health surveys.1 8 However, these surveys include small numbers of AI/AN people, resulting in samples that may not be representative of the AI/AN population overall and are insufficient to estimate trends in prevalence.8 Other studies have used samples that may not be representative of AI/AN people nationally.9 A large and nationally representative source of data for AI/AN people is the Indian Health Service (IHS) National Data Warehouse (NDW). The objective of this study is to examine recent trends in the prevalence of diagnosed diabetes (type 1 and type 2 combined) for all AI/AN adults in the IHS active clinical population using data from the NDW.
Methods
Data source
We used data collected each fiscal year (1 October–30 September; hereafter referred to as ‘year’) from 2006 to 2017 at IHS and tribally operated healthcare facilities across all 12 IHS areas. These facilities serve about 2.56 million AI/AN people who belong to 573 federally recognized tribes that are based in 37 states.10 Eligibility for services is determined by various factors such as membership in a federally recognized tribe.11 The data were obtained from the IHS NDW, a central repository of registration and encounter-based patient data from IHS, tribal, and urban Indian health facilities.12 13 These facilities extract data from their local electronic health record system and submit it to IHS for inclusion in the NDW.
Each year, IHS determines its user population based on AI/AN patients with data in the NDW that had at least one qualifying encounter during that year or the previous 2 years.12 Qualifying encounters are determined by NDW reporting rules.12 13 As patients can receive services at multiple facilities that submit data separately to the NDW, unique patients are identified for each year according to the IHS standard unduplication process.12 13 For each patient, probabilistic matching software (Quality Stage) determines if there are duplicate registration records using name, social security number, date of birth, and gender. If there are duplicate records for a patient, the one that was updated most recently is selected to determine that patient’s current status, residence, and other characteristics.
For each year of our study, we included all patients in the IHS user population aged 18–112 years, excluding patients who did not have a documented sex or were not alive at the end of the year. For the purposes of this paper, we refer to our study population as the IHS active clinical population.
Measurements
For all patients in the IHS active clinical population, we counted the number of encounters in each year that had a diabetes-related International Classification of Diseases and Related Health Problems, Ninth Revision, Clinical Modification (ICD-9-CM) diagnosis code starting with 250 or an ICD-10-CM (Tenth Revision) diagnosis code starting with E10, E11, or E13. The NDW includes data for a wide range of patient encounter types, including clinically related chart entries, in addition to face-to-face patient visits.12 All documented encounters were reviewed, including medical, dental, optometry, physical therapy, laboratory, radiology, inpatient, emergency and urgent care, pharmacy, case management, chart review, and education classes. Patients who had at least two encounters in each year with any of the diabetes diagnosis codes above were considered to have diagnosed diabetes for that year. More than one encounter could occur on the same day if a patient visited multiple clinics and/or providers. Further, one or even both encounters could be non face-to-face encounters (eg, chart review, case management, or medication refill). For comparison, we also considered a secondary definition of diagnosed diabetes based on one encounter in each year with a diabetes diagnosis code. Different types of diabetes were not distinguished for either definition. For the purposes of this paper, we refer to diagnosed diabetes as diabetes.
Diabetes prevalence was calculated for each year as the number of patients with diagnosed diabetes divided by the number of active clinical patients. Prevalence was estimated for AI/AN adults overall and by sex, age group, and geographic region of residence. Age in years was calculated as of the last day of each year and grouped into four categories: 18–44, 45–64, 65–74, and 75 years and older. In order to protect the confidentiality of specific AI tribes and for consistency with previously published studies,5 14 we defined nine geographic regions based on the 12 IHS Areas. The nine geographic regions are: Alaska, California, Northwest, Southwest subregion 1, Southwest subregion 2, Southern Plains, Northern Plains, Great Lakes, and East (online supplementary figure l). In our analyses, the original 12 IHS areas were used when accounting for geographic clustering of patients.
Supplemental material
Statistical analysis
We estimated diabetes prevalence for each year from 2006 to 2017 for AI/AN adults overall and for the demographic subgroups using SAS V.9.4 (SAS Institute). The data were considered cross-sectional, with each year treated independently of the others. Except for the age groups, all estimates were age-adjusted to the 2000 US standard population using age groups 18–44, 45–64, 65–74, and 75 years and older.15 For overall prevalence estimates and those by sex and age group, geographic clustering of patients was accounted for using survey analysis procedures in SAS/STAT.
We used Joinpoint Trend Analysis Software, V.4.5.0.1 (National Cancer Institute, 2018), to analyze trends in diabetes prevalence overall and for all subgroups. Joinpoint regression uses permutation tests to determine whether the rate of change for each trend segment is significantly different from zero (p<0.05) and to identify points (ie, joinpoints) where linear trends change significantly in direction or magnitude (eg, zero joinpoints indicates a straight line).16 In the final model, each trend segment is described by an annual percentage change (APC) with a 95% CI. The minimum number of possible joinpoints was zero and the maximum was two.
Results
There were 729 470 patients in the IHS active clinical population in 2006, with the number increasing to 1 034 814 in 2017. Of this population, 86 245 had diagnosed diabetes in 2006, increasing to 137 594 in 2017.
Demographics
Table 1 presents demographic data and diabetes prevalence estimates for selected years of our study. Estimates for all study years are presented in online supplementary table 1. There were more females than males in the active clinical population every year—53.6% were female in 2017. The majority of patients were in the youngest age group (18–44 years) every year; however, the percentage decreased from 63.7% in 2006 to 57.7% in 2017. The second largest age group was 45–64 years, and the percentage increased from 27.1% in 2006 to 29.8% in 2017. The geographic distribution of patients was generally similar across the years studied. In 2017, the highest percentage of patients was in the Southern Plains (25.2%) and the lowest percentage was in the East (3.4%).
Supplemental material
Characteristics and diabetes prevalence* for American Indian and Alaska Native adults aged 18 years and older in the Indian Health Service active clinical population, for selected years
Trends in diabetes prevalence
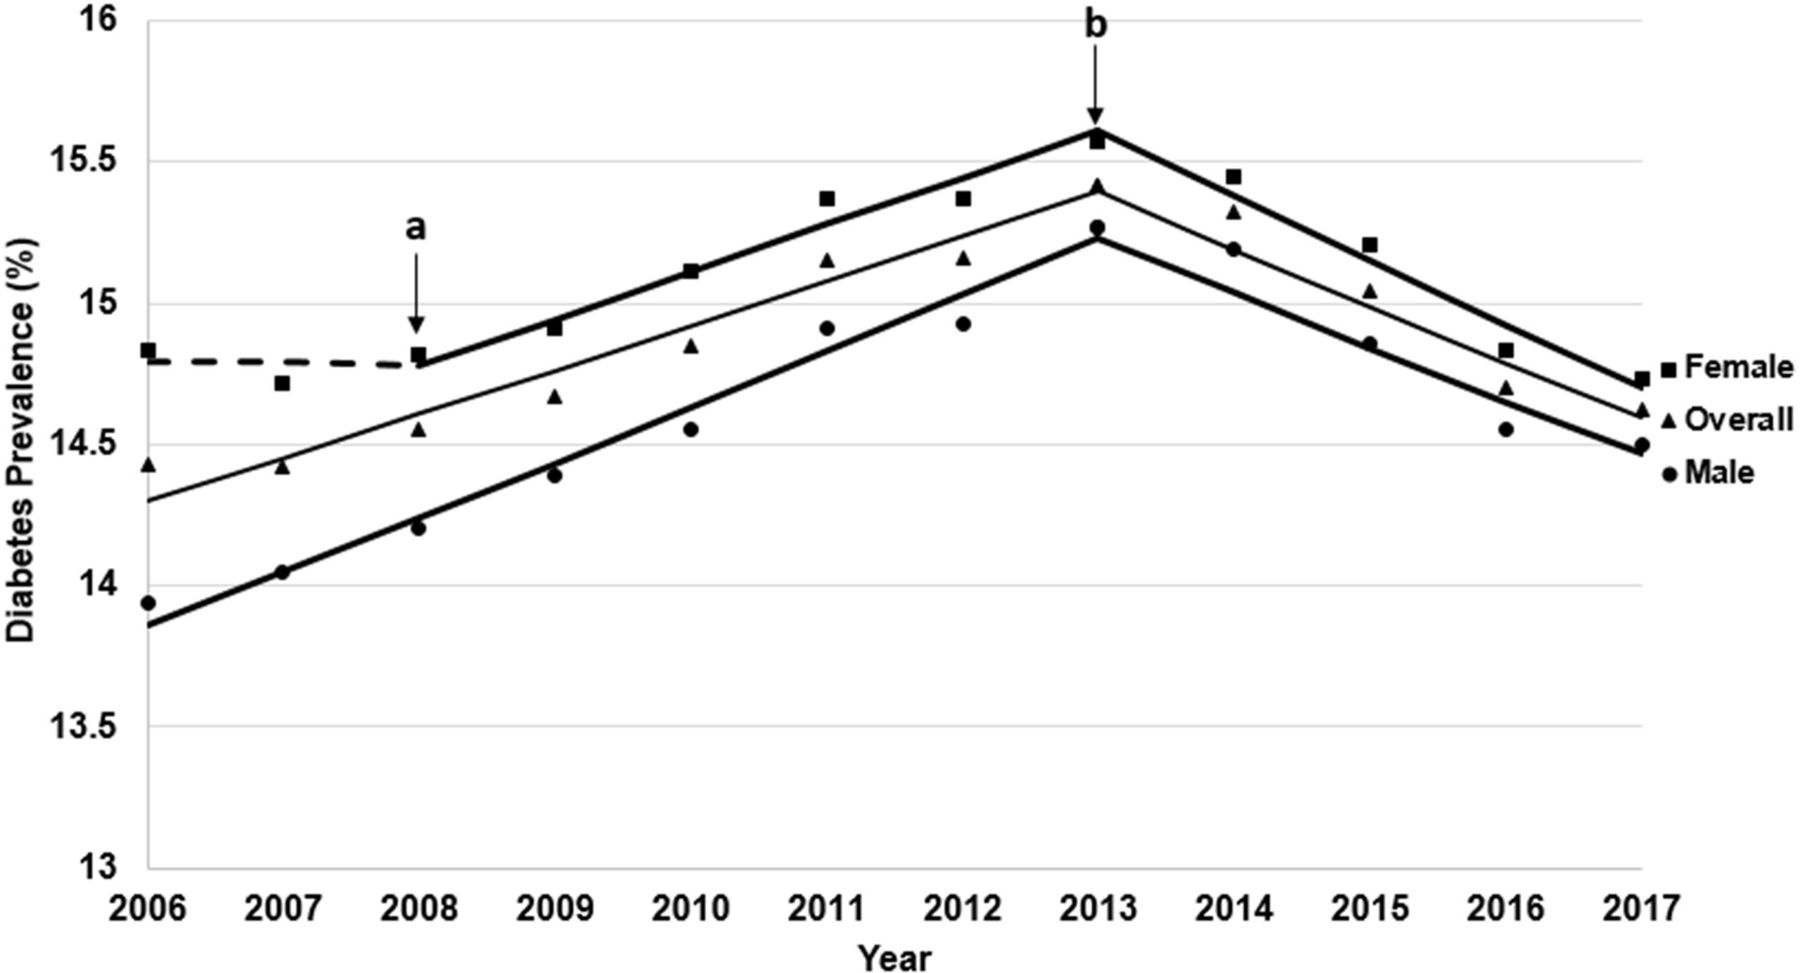
As shown in figure 1, after increasing significantly from 2006 to 2013 (APC=1.1%, p<0.01), diabetes prevalence for AI/AN adults overall decreased significantly from 2013 to 2017 (APC=−1.3%, p<0.01). Prevalence was 14.4% (95% CI 13.9% to 15.0%) in 2006; peaked at 15.4% (95% CI 14.8% to 16.0%) in 2013; and then decreased to 14.6% (95% CI 14.1% to 15.2%) in 2017. The trends for men and women were similar to the overall adult population.

Trends in age-adjusted prevalence of diagnosed diabetes among American Indian and Alaska Native adults aged 18 years and older in the Indian Health Service active clinical population, overall and by sex, 2006–2017. Notes: Y-axis does not start at 0. Data are from the Indian Health Service National Data Warehouse. Diabetes diagnosis determined by at least two encounters with a diabetes diagnosis code during the relevant year. Symbols are observed annual values; lines are modeled using JoinPoint Trend Analysis Software. Dotted lines indicate no significant trend; solid lines indicate a significant annual percentage change. Arrows indicate joinpoints (changes in trend): (a) applies to Female only; (b) applies to overall, female, and male.
All age groups had significant increases in diabetes prevalence from 2006 to 2013 or 2014 and then decreased significantly (figure 2). For all years, diabetes prevalence was lowest in the youngest age group (18–44 years) with a peak of 4.7% (95% CI 4.5% to 5.0%) in 2013, decreasing to a low of 4.3% (95% CI 4.1% to 4.5%) in 2017 (APC=−2.7%, p<0.01). AI/AN adults aged 65–74 years had the highest prevalence for all years, with a peak of 37.0% (95% CI 35.8% to 38.2%) in 2013 and then a decrease to 34.7% (95% CI 33.5% to 35.9%) in 2017 (APC=−1.6%, p<0.01).
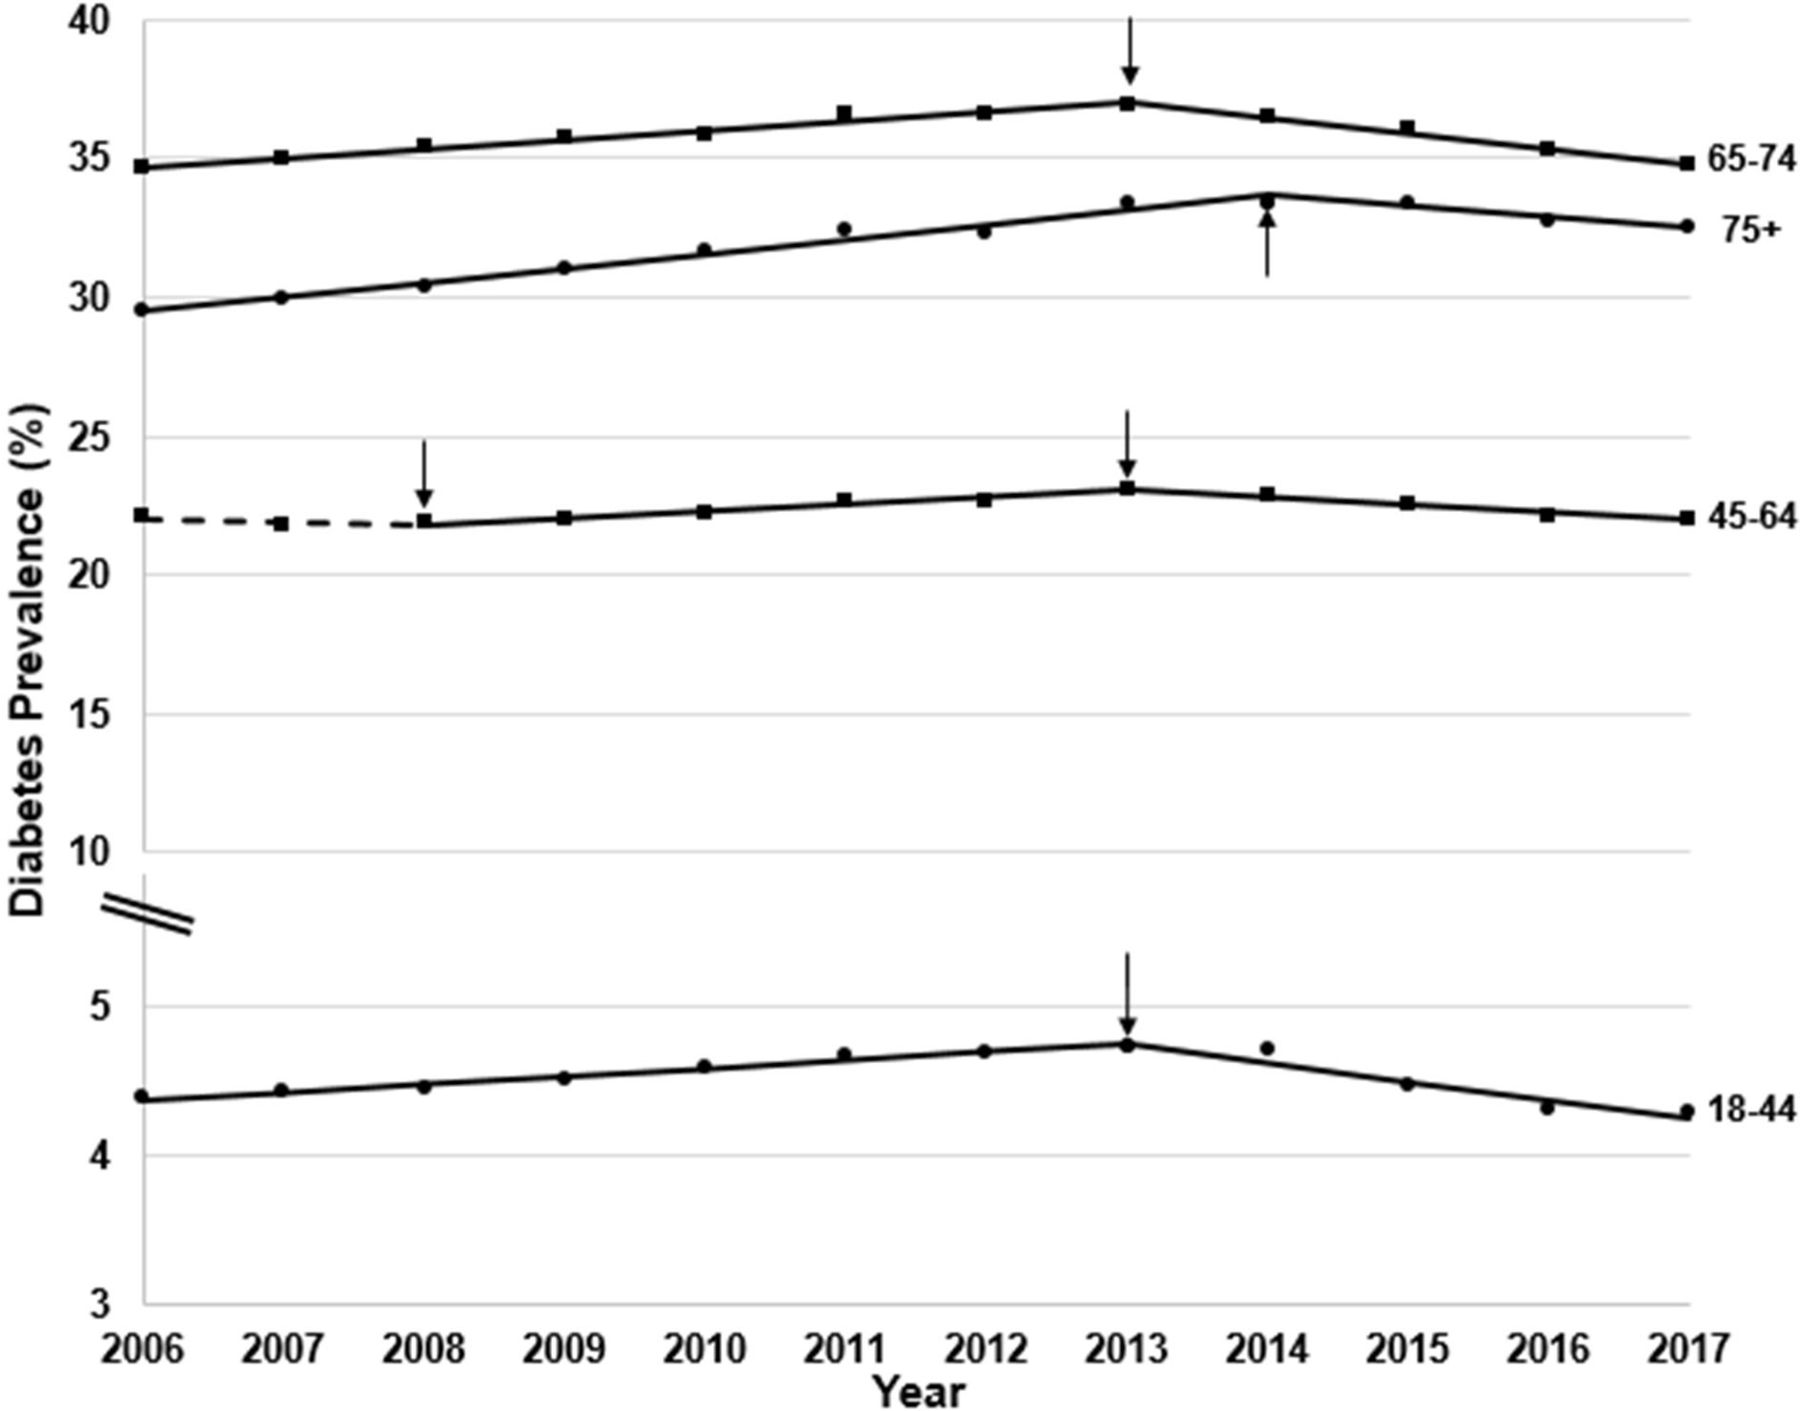
Trends in prevalence of diagnosed diabetes among American Indian and Alaska Native adults aged 18 years and older in the Indian Health Service active clinical population by age group, 2006–2017. Notes: Y-axis does not start at 0. Data are from the Indian Health Service National Data Warehouse. Diabetes diagnosis determined by at least two encounters with a diabetes diagnosis code during the relevant year. Symbols are observed annual values; lines are modeled using JoinPoint Trend Analysis Software. Dotted lines indicate no significant trend; solid lines indicate a significant annual percentage change. Arrows indicate joinpoints (changes in trend).
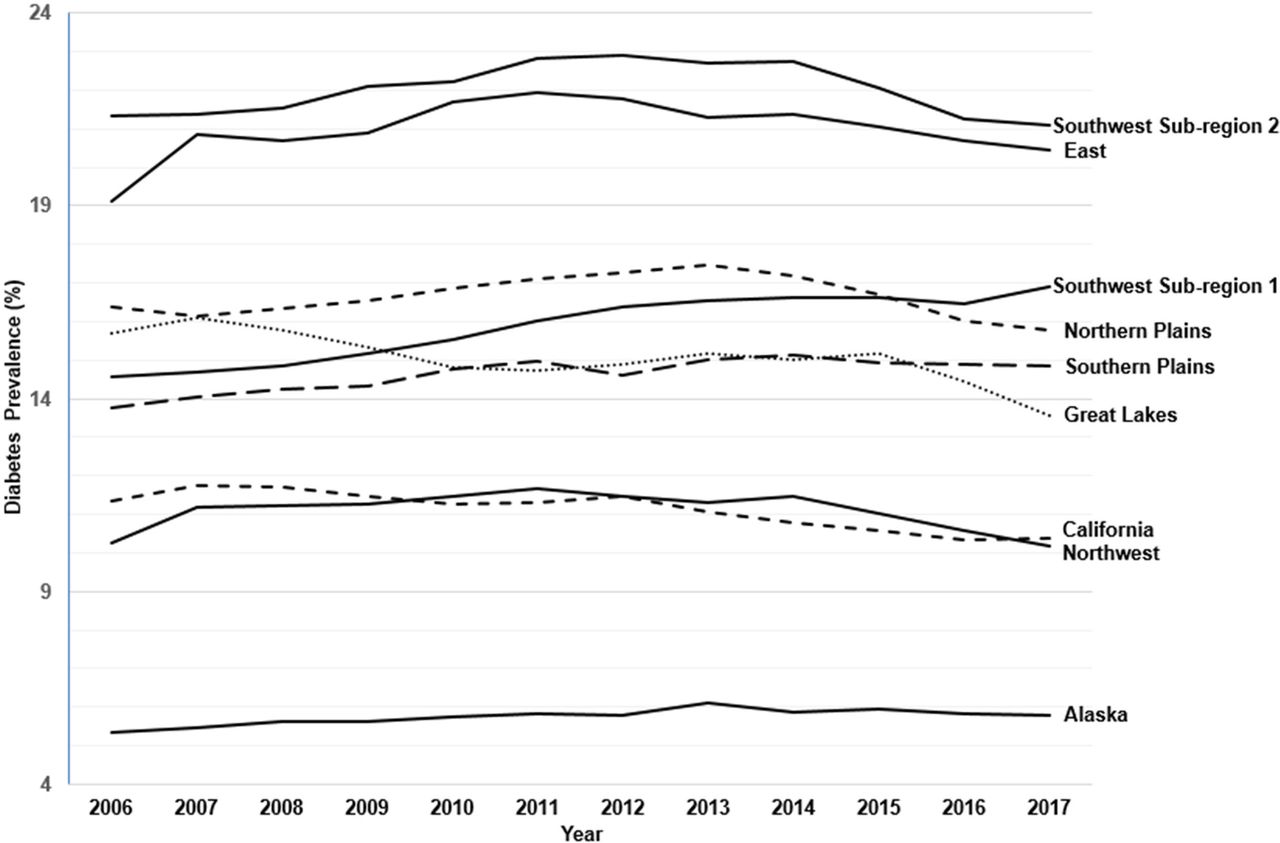
For all geographic regions, diabetes prevalence either decreased significantly or leveled off in recent years (figure 3 and online supplementary table 2). There were considerable differences in prevalence across geographic regions, with Alaska consistently having the lowest (5.8% in 2017; 95% CI 5.5% to 6.1%) and Southwest subregion 2 consistently having the highest (21.1% in 2017; 95% CI 19.6% to 22.6%).
Supplemental material

Trends in age-adjusted prevalence of diagnosed diabetes among American Indian and Alaska Native adults aged 18 years and older in the Indian Health Service active clinical population by geographic region, 2006–2017. Notes: Y-axis does not start at 0. Data are from the Indian Health Service National Data Warehouse. Diabetes diagnosis determined by at least two encounters with a diabetes diagnosis code during the relevant year. See online supplementary table 2 for analysis of these data using JoinPoint Trend Analysis Software.
Compared with the diabetes prevalence estimates based on two encounters with a diabetes diagnosis code, those requiring only one such encounter were higher for AI/AN adults overall (16.8% in 2017) and for all subgroups. However, trends over time were similar overall, by sex, and for two of the four age groups (online supplementary table 3).
Supplemental material
Discussion
Diabetes prevalence trends and comparisons
Our analyses show that diabetes prevalence in AI/AN adults in the IHS active clinical population increased significantly from 2006 to 2013 and then decreased significantly from 2013 to 2017. Similar trends were seen among AI/AN adults of both sexes and in all four age groups.
There were considerable differences in prevalence and in trends over time across the geographic regions. Southwest subregion 2, which includes Nevada and most of Arizona and Utah, was consistently the highest at 21.1% in 2017. Alaska was consistently and considerably lower than all other regions (5.8% in 2017) and even lower than the general US adult population (8.0% in 2017).17 Regional differences were also seen in previous studies of diabetes prevalence in AI/AN people.3 Since the reasons for this geographic variability remain largely unknown, this suggests an area for further research.
We are not aware of any other studies that have published recent national trends in diabetes prevalence for AI/AN adults, although several studies have published point estimates. Cowie et al estimated diabetes prevalence for non-Hispanic AI/AN adults aged 20 years and older at 19.1%. However, this estimate was based on 5 years of combined NHIS data (2011–2015) which still yielded a small total sample size, resulting in a wide 95% CI (15.5%–23.4%).8 Zhu et al estimated prevalence for AI/AN adults aged 20 years and older at 19.6% (95% CI, 19.1% to 20.0%) in 2012–2013.9 However, this was based on several regional samples of non-Hispanic AI/AN adults that are not nationally representative. In contrast to these two studies, ours is based on a large number of AI/AN adults aged 18 years and older from across the USA, including those of mixed racial/ethnic heritage, who met IHS eligibility criteria.
Our study estimated point prevalence of diabetes for AI/AN adults aged 18 years and older as 14.6% in 2017, which is higher than for the general US adult population and other racial/ethnic groups.17 However, diabetes prevalence has plateaued for US adults overall, as well as for other racial/ethnic groups,17 in contrast to the decreasing trend that we observed for AI/AN adults.
Possible reasons for changes in trends
As this was an observational study, we are neither able to determine reasons for the decreases in diabetes prevalence in AI/AN adults nor why they started in 2013 and 2014. However, several potential contributing factors are explored below.
Diabetes prevalence trends are related to changes in diabetes mortality and incidence. Like the general US population,18 diabetes mortality rates for AI/AN people have decreased.5 19 In addition, several studies have demonstrated that at least some diabetes complications, which contribute to mortality risk, have also decreased in the AI/AN population.6 7 While diabetes incidence has decreased in the general US population,17 such estimates are not available for AI/AN people.1 However, given the improvements in diabetes mortality and complications, it seems likely that a decrease in diabetes incidence has contributed to the decrease in prevalence in AI/AN adults.20
Obesity is linked to diabetes risk, but national data on obesity trends in AI/AN adults have not been published. However, recently published data on AI/AN children show that the prevalence of obesity was stable from 2006 to 2015.14 Data for the general US adult population show that obesity prevalence increased during a similar period as the current study.21 22 Given these trends in other age groups and populations, it seems unlikely that a reduction in obesity has occurred in AI/AN adults which could be responsible for the decrease in diabetes prevalence.
Socioeconomic status has been linked to diabetes inequities across populations.23 According to the US Census, AI/AN people have the highest poverty rate of all racial/ethnic groups, 21.9% in 2017.24 They also have a high prevalence of food insecurity,25 which has been linked to diabetes incidence.26 While there are indications of improvements in at least some AI/AN communities,27 it is not known if there were sufficient changes in socioeconomic status nationwide to have had an impact on diabetes prevalence during our study period.
Diabetes prevention, nutrition education, and physical activity programs, including those implemented at Special Diabetes Program for Indians (SDPI) sites, may have had an impact on diabetes incidence in AI/AN communities.28 Established by Congress in 1997, the SDPI provides grant funding to 301 AI/AN programs across 35 states29 for diabetes prevention and treatment services. Many grantees use SDPI funds to address diabetes prevention, including some that provide the Diabetes Prevention Program intensive lifestyle intervention.30 Since the SDPI was established in 1997, the percentage of AI/AN communities with various diabetes-related services available has vastly increased, including a 54% increase in nutrition services for adults, a 59% increase in adult weight management programs, and a 71% increase in physical activity programs for school-aged youth.30
Several national changes occurred during the study period affecting how diabetes is documented and diagnosed. A number of studies have looked at whether these changes have impacted national diabetes prevalence estimates and, if so, in what direction. Beginning in October 2015, the USA transitioned from ICD-9-CM to ICD-10-CM for coding medical encounter diagnoses.31 Yoon and Chow studied a random sample of Veterans Administration patients to determine whether this transition affected prevalence estimates for a number of diseases, including diabetes. They determined that the odds of having a diabetes diagnosis increased with the transition from ICD-9-CM to ICD-10-CM.31 As such, it is unlikely that this transition contributed to the decreases in diabetes prevalence in AI/AN adults seen in our study.
In addition, national guidelines were revised in 2010 to include the HbA1c test as an option for diagnosing diabetes,32 though it has been shown to be less sensitive than the other accepted tests.33 However, as the HbA1c test does not require patients to be fasting, it is more convenient to perform and may result in increased testing. Nichols et al found increased HbA1c testing to be associated with an increase in diabetes incidence in racial and ethnic minority groups.34 As such, the addition of the HbA1c test for diagnosis is unlikely to have contributed to the decreases in diabetes prevalence for AI/AN people that we observed.
Strengths and limitations
The major strengths of this study are representation from tribes throughout the USA, as well as the large number of AI/AN adults included, more than in any previously published study of diabetes prevalence for this population. Our study included over one million AI/AN adults who received care from facilities in 35 states. By comparison, diabetes prevalence estimates for AI/AN adults derived from regional studies are not nationally representative9 and those from national surveys are based on very small numbers of AI/AN participants.1 8 As such, the CDC National Diabetes Statistics Report uses IHS diabetes prevalence estimates for representation of AI/AN people as a racial group.1 Further, it has been shown that prevalence estimates derived from a large clinical database yield similar results to those from national survey data for the same population.35
Several limitations should be noted. First, our results cannot be generalized to all adults in the USA who self-identify as AI/AN. In 2017, our analysis included 1 034 814 AI/AN adults (alone or in combination with other races), whereas the US Census reported that there were approximately 4.8 million such adults residing in the USA.36 However, as data on race in the Census are self-reported, many people counted as AI/AN may not meet the eligibility criteria to receive services at IHS and tribal facilities.11 Further, it is not known how many AI/AN people who were eligible to receive services did not do so during the time period studied. A large proportion of AI/AN people live outside of AI/AN areas as defined by the US Census37 (eg, in urban locations) and, as such, may not seek care at IHS and tribal facilities.
Second, due to limitations of the data available in the NDW, we identified patients with diabetes using a variation on the approaches applied by other diabetes prevalence studies that used clinical databases.35 38–41 Some of these studies included medication and laboratory criteria in addition to diagnosis codes to identify people with diabetes and also tracked patients for more than 1 year. While data submitted to the NDW have improved over time, there are some issues with completeness and coding, including for medication and laboratory data, from some facilities during our study period. As such, we were not able to include medication and laboratory criteria in our definition of diabetes and relied on diagnosis codes. In addition, it is not feasible to track patients from year to year in the NDW, as the IHS user population is identified distinctly each fiscal year without a predefined identifier for each patient. Our approach, used by IHS to estimate diabetes prevalence for many years,1 30 was chosen to minimize the likelihood of counting patients who received a diabetes diagnosis code in error (eg, for diabetes screening).35 For comparison, we also estimated and analyzed prevalence based on only one encounter with a diabetes diagnosis code in each year, and the trends were similar to those for the estimates based on two encounters.
Third, as the objective of our study was to determine overall prevalence of diabetes, we did not distinguish between diabetes types. In previous studies of AI/AN patients42 and current studies of US adults43 and AI/AN children,44 only small percentages of people with diabetes were diagnosed as having type 1 diabetes. As such, it is likely that the large majority of patients with diabetes in our study had type 2 diabetes.
Conclusion
Diabetes prevalence in AI/AN adults in the IHS active clinical population has decreased significantly since 2013. This is the first documented decrease in prevalence for AI/AN people. The SDPI and other diabetes-related programs that serve AI/AN people have likely contributed to this important outcome, as well as to the decreases in diabetes-related mortality and complications seen in other studies. Taken together, these improvements have significant implications for the healthcare system, including potential reductions in long-term costs. However, as AI/AN adults still have the highest prevalence among US racial/ethnic groups, diabetes remains a major health concern. Sustained efforts in diabetes prevention, treatment, and surveillance are crucial to ensure continued advances in the health of AI/AN people.
Acknowledgments
The authors would like to thank Larry Layne, PhD (IHS Division of Epidemiology and Disease Prevention) for his assistance with the IHS National Data Warehouse and for preparing the map in the supplemental figure.
References
Footnotes
Contributors AB and KS conceived the study and wrote the manuscript. KS extracted and analyzed the data. IH contributed to data analysis. AB, KS, NRB, SRB, SHS, and EWG contributed to the study design and interpretation of the results. All authors critically reviewed/edited the manuscript. KS is the guarantor of this work and, as such, had full access to all of the study data and takes responsibility for the integrity of the data and accuracy of the data analysis.
Funding The authors have not declared a specific grant for this research from any funding agency in the public, commercial or not-for-profit sectors.
Disclaimer The findings and conclusions in this report are those of the authors and do not necessarily represent the official position of the Indian Health Service or the Centers for Disease Control and Prevention.
Map disclaimer The depiction of boundaries on the map(s) in this article do not imply the expression of any opinion whatsoever on the part of BMJ (or any member of its group) concerning the legal status of any country, territory, jurisdiction or area or of its authorities. The map(s) are provided without any warranty of any kind, either express or implied.
Competing interests None declared.
Patient consent for publication Not required.
Ethics approval The Institutional Review Board of the Indian Health Service approved this project.
Provenance and peer review Not commissioned; externally peer reviewed.
Data availability statement No data are available. Per Indian Health Service policy, National Data Warehouse record level data cannot be shared with external parties to IHS outside of data sharing or data use agreements. As such, data used for this study are not publicly available.