Article Text

Abstract
Introduction Prescription patterns of antidiabetic drugs in the period from 2012 to 2018 were investigated based on the Diabetes Registry Tyrol. To validate the findings, we compared the numbers with trends of different national registries conducted in a comparable period of time.
Research design and methods Medication data, prescription patterns, age groups, antidiabetic therapies and quality parameters (hemoglobin A1c, body mass index, complications) of 10 875 patients with type 2 diabetes from 2012 to 2018 were retrospectively assessed and descriptively analyzed. The changes were assessed using a time series analysis with linear regression and prescription trends were plotted over time.
Results Sodium/glucose cotransporter 2 inhibitors (SGLT-2i) showed a significant increase in prescription from 2012 to 2018 (p<0.001), as well as metformin (p=0.002), gliptins (p=0.013) and glucagon-like peptide-1 agonists (GLP-1a) (p=0.017). Significant reduction in sulfonylurea prescriptions (p<0.001) was observed. Metformin was the most frequently prescribed antidiabetic drug (51.3%), followed by insulin/analogs (34.6%), gliptins (28.2%), SGLT-2i (11.7%), sulfonylurea (9.1%), glitazones (3.7%), GLP-1a (2.8%) and glucosidase inhibitors (0.4%).
Conclusions In this long-term, real-world study on prescription changes in the Diabetes Registry Tyrol, we observed significant increase in SGLT-2i, metformin, gliptins and GLP-1a prescriptions. In contrast prescriptions for sulfonylureas declined significantly. Changes were consistent over the years 2012–2018. Changes in prescription patterns occurred even before the publication of international and national guidelines. Thus, physicians change their prescription practice not only based on published guidelines, but even earlier on publication of cardiovascular outcome trials.
- clinical endocrinology and metabolism
- medication
- registries
- type 2 diabetes
This is an open access article distributed in accordance with the Creative Commons Attribution Non Commercial (CC BY-NC 4.0) license, which permits others to distribute, remix, adapt, build upon this work non-commercially, and license their derivative works on different terms, provided the original work is properly cited, appropriate credit is given, any changes made indicated, and the use is non-commercial. See: http://creativecommons.org/licenses/by-nc/4.0/.
Statistics from Altmetric.com
Significance of this study
What is already known about this subject?
Evidence-based guidelines are key to improve treatment of patients with type 2 diabetes mellitus.
Increasing knowledge results in more detailed guidelines.
Knowledge increases fast due to Food and Drug Administration-required cardiovascular outcome trials.
What are the new findings?
In more than 10 000 patients over 7 years, metformin alone or in combination was the most frequent antidiabetic drug, followed by insulin or insulin analogs, gliptins, sodium/glucose cotransporter 2 inhibitors (SGLT-2i), sulfonylureas, glitazones, glucagon-like peptide-1 agonists (GLP-1a) and glucosidase inhibitors.
Metformin, gliptin, SGLT-2i and GLP-1a prescriptions increased, sulfonylureas decreased, and insulin and analogs did not change as well as glitazones.
How might these results change the focus of research or clinical practice?
The results of the observational cohort from the Diabetes Registry Tyrol should encourage physicians to implement novel evidence-based findings to ensure timely and up-to date, evidence-based medicine for their patients even before new guidelines can be published.
Introduction
Diabetes mellitus prevalence has nearly doubled since 1980, affecting 8.5% of the adult population, with half of the cases estimated to be undiagnosed,1 and this accounts for nearly 463 million worldwide.2 According to the International Diabetes Federation (IDF), over four million died of diabetes and its accompanied diseases in 2019, which resulted in global healthcare expenditures of US$760 billion.2 By 2045 nearly 700 million people will suffer from diabetes, costing US$845 billion.2
Europe has the second least number of adult patients with diabetes among the regions of the IDF (6.8%).2 Ranging from 2.1% in Greenland to 11.1% in Turkey, the intracontinental differences are extensive.2 Over 600 000 (6.6%) Austrians suffer from diabetes mellitus, thereof 85%–90% from type 2 diabetes mellitus.2 3 The diabetes epidemic has led to constant development of disease-controlling drugs and treatment strategies,4 5 generating rapid changes in national and international guidelines.6–9 In 2015 the American Diabetes Association (ADA) and the European Association for the Study of Diabetes (EASD) updated the existing position statement from 2012.10 11 In 2018 the position statement was updated again and a further update was added in 2019 by the European Society of Cardiology (ESC) and EASD.6 9 The Austrian Diabetes Association also releases regular position papers which are in accordance with the international guidelines and are adapted to the Austrian population and insurance system, thereby ensuring timely, evidence-based, high-quality and international comparable recommendations.8
The time between the updates was marked by rapid changes in the treatment of type 2 diabetes. In 2008 the US Food and Drug Administration (FDA) changed their requirements for cardiovascular (CV) safety when approving new antidiabetic drugs.12 The FDA requirements led to the publication of numerous large CV outcome trials (CVOT) since new treatments have entered the market, sodium/glucose cotransporter 2 inhibitors (SGLT-2i), gliptins and glucagon-like peptide-1 agonists (GLP-1a). SGLT-2i, first approved in 2011, showed CV safety and potential renal benefits, reduced CV events, reduced all-cause mortality, and decreased worsening of heart failure and risk of death from heart failure.4 5 13 14 In the same period GLP-1a, first approved in 2005, proved to be CV safe, reduced CV events and showed potential renal benefits.15–22 Gliptins already showed CV safety in 2013, and the evidence was strengthened from 2015 to 2019, and showed renal safety.23–26 This new evidence led to significant changes in the guidelines. The 2018/2019 guidelines aim to provide an algorithmic approach for decision making in antidiabetic treatment.7 9–11 If hemoglobin A1c (HbA1c) targets cannot be met, recommendations for intensification of therapy by the 2015 guidelines were vague. Increasing evidence from large CVOTs helped to specify diabetes guidelines. The 2018/2019 ADA and EASD guidelines provide a five-column step scheme personalized to the needs of patients, associated comorbidities, treatment targets and even costs.7 9–11
Providing guidelines is only a small step in changing treatment regimens. Guideline compliance varies and knowledge concerning adherence and implementation is crucial for the improvement of therapies regardless of disciplines.27 Registries provide a powerful tool to assess changes in treatment. Following large numbers of patients with detailed demographics for years generates large amounts of long-term repeated measurements. These allow for observation of changes over time and monitoring of implementation and impact of evidence-based treatment and guidelines.
Despite its importance, nationwide and regional epidemiological data on diabetes treatment in Austria and Europe are scarce. The Diabetes Registry Tyrol (DRT) is the only Austrian diabetes registry for adults, representing one out of nine states. The aim was to analyze treatment modalities and quality parameters in comparison with recent changes in the treatment of type 2 diabetes from 2012 to 2018 due to the extensive growth of knowledge during this period. These data were compared with guidelines, published high-impact studies and equivalent nationwide data from different countries arising from the same period of time.
Research design and methods
Data are from the DRT, a region-wide diabetes registry containing inbound and outbound patients from ten Tyrolean hospitals and from nine private internal specialists.28 Nearly 21 000 patients diagnosed with diabetes mellitus are included, of whom 15 980 have type 2 diabetes. The present data set includes data from 10 875 patients with type 2 diabetes who attended at least one type 2 diabetes-related inpatient or outpatient visit between January 1, 2012 and December 31, 2018. The registry records the demographics, medical history and clinical data of patients with incident and chronic type 2 diabetes. Data contain information on age, sex, body mass index (BMI), HbA1c, long-term complications (eg, diabetic nephropathy, neuropathy, retinopathy, and macrovascular events) and duration of disease. Since 2012 diabetes medications have been assessed, including substance class and start and end date. For raw data generation a project-oriented software was established. To guarantee the legal and ethical standards of data privacy, the data sets are pseudonymized. Participating centers measure body weight in whole kilograms at every patient visit. Body height is measured in centimeters using a tapeline at first patient visit. Nephropathy is defined as the presence of albuminuria twice or more and/or glomerular filtration rate <60 mL/min/1.73 m². Retinopathy is diagnosed by an ophthalmologist. Neuropathy is diagnosed using the microfilament test and diabetic feet are diagnosed by the presence of chronic ulcer and infections. Amputation due to diabetes is defined as non-traumatic amputation for a diabetic foot syndrome. Myocardial infarction, stroke, bypass and percutaneous transluminal angioplasty are recorded according to medical documentation of the said events. Peripheral artery disease (PAD) is defined as the presence of symptomatic PAD, an ankle-brachial index less than 0.80 or diminished foot pulses. HbA1c values are measured at the participating hospital or at the private internal specialists at the time of visit in per cent or mmol/mol. Information on medication is collected in a digital form with the following available options: no medication, GLP-1a, insulin, insulin analogs, insulin pump and bariatric surgery or oral medication. For oral medication a separate field is available with the options metformin, gliptin, glitazone, glucosidase inhibitor, SGLT-2i, sulfonylurea or other oral medication. Our findings were discussed and compared with the latest published guidelines by national and international diabetes associations.6 8 9 To assess if the results apply to an international context, they were discussed using comparable publications with similar key outcomes which were conducted in a similar period of time.
Statistics
Relative numbers of prescribed drugs per year were calculated with the number of annual patient visits as basis. For calculation of the relative number of prescriptions, the total number of patient visits was the basis. Only the most recent annual examination for each patient was used for analysis. Demography of patients was summarized by sex, age group and diabetes duration. They were divided into four age groups (0–39, 40–59, 60–79, 80–99). Diabetes duration is calculated from the year of initial diagnosis to the last visit. Duration is given in four duration groups and as mean±SD. Diabetes-associated complications are defined as mentioned and the relative share is calculated from the total population (table 1). Antidiabetic drugs and metformin-based combination therapies used in the treatment are summarized in table 2. Absolute and relative numbers of patients prescribed a specific therapy are given, and a time series analysis using linear regression was conducted (table 2). Table 3 shows the absolute and relative numbers of prescribed antidiabetic drugs in four age groups. Distribution of parameters was estimated using histogram, boxplot, skewness and kurtosis. Variables are given as mean±SD. P values <0.05 were considered significant. Statistical analyses were performed with R V.3.5.3 (R Core Team, 2019).
Number, age, duration of diabetes and diabetes-associated complications of participants in the Diabetes Registry Tyrol
Absolute and relative values of single class medication and metformin-based combination therapies in the treatment of type 2 diabetes mellitus in the Diabetes Registry Tyrol and change over time from 2012 to 2018
Absolute and relative values of oral medication, injectable medication and metformin-based combination therapies in the treatment of type 2 diabetes mellitus in the Diabetes Registry Tyrol by age groups
Results
Demography
We analyzed 10 875 patients from the DRT from 2012 to 2018. Of the patients 41.3% were female and 58.7% were male, with a mean age of 69±12 years. Of the DRT patients, 55.9% were between 60 and 79 years old, 21.8% were older than 80, 20.5% were between 40 and 59 years old, and 1.7% were between 18 and 39 years old. The mean age of participants is given in table 1. The mean HbA1c in our cohort was 7.6%±1.88 (60 mmol/mol±20.6) and the mean BMI was 30.2 kg/m²±5.83. Of the patients, 37.7% had a diabetes duration of 11–20 years, followed by 25.1% with duration of 6–10 years, 19.1% with 0–5 years and 18.1% with 21 or more years. The mean duration of diabetes was 13.4±9.2 years. Diabetic nephropathy (11.9%) was the most common associated late complication, followed by revascularization (8.6%) and myocardial infarction (8.1%). Less common were neuropathy (6.8%), apoplectic insults (4.6%), PAD (3.9%) and retinopathy (1.9%) (table 1).
Prescribed drug classes
Of all the analyzed patients in the DRT, 68.1% were treated with at least one oral antidiabetic drug from 2012 to 2018. In this period, metformin was the most frequent (51.3%), followed by gliptins (28.2%), SGLT-2i (11.7%), sulfonylurea (9.1%) and glitazones (3.7%). The least prescribed oral antidiabetic drug was glucosidase inhibitors (0.4%). Among the injectable therapies, the use of insulin or analogs was the most frequent (34.6%), followed by GLP-1a (2.8%) (table 2).
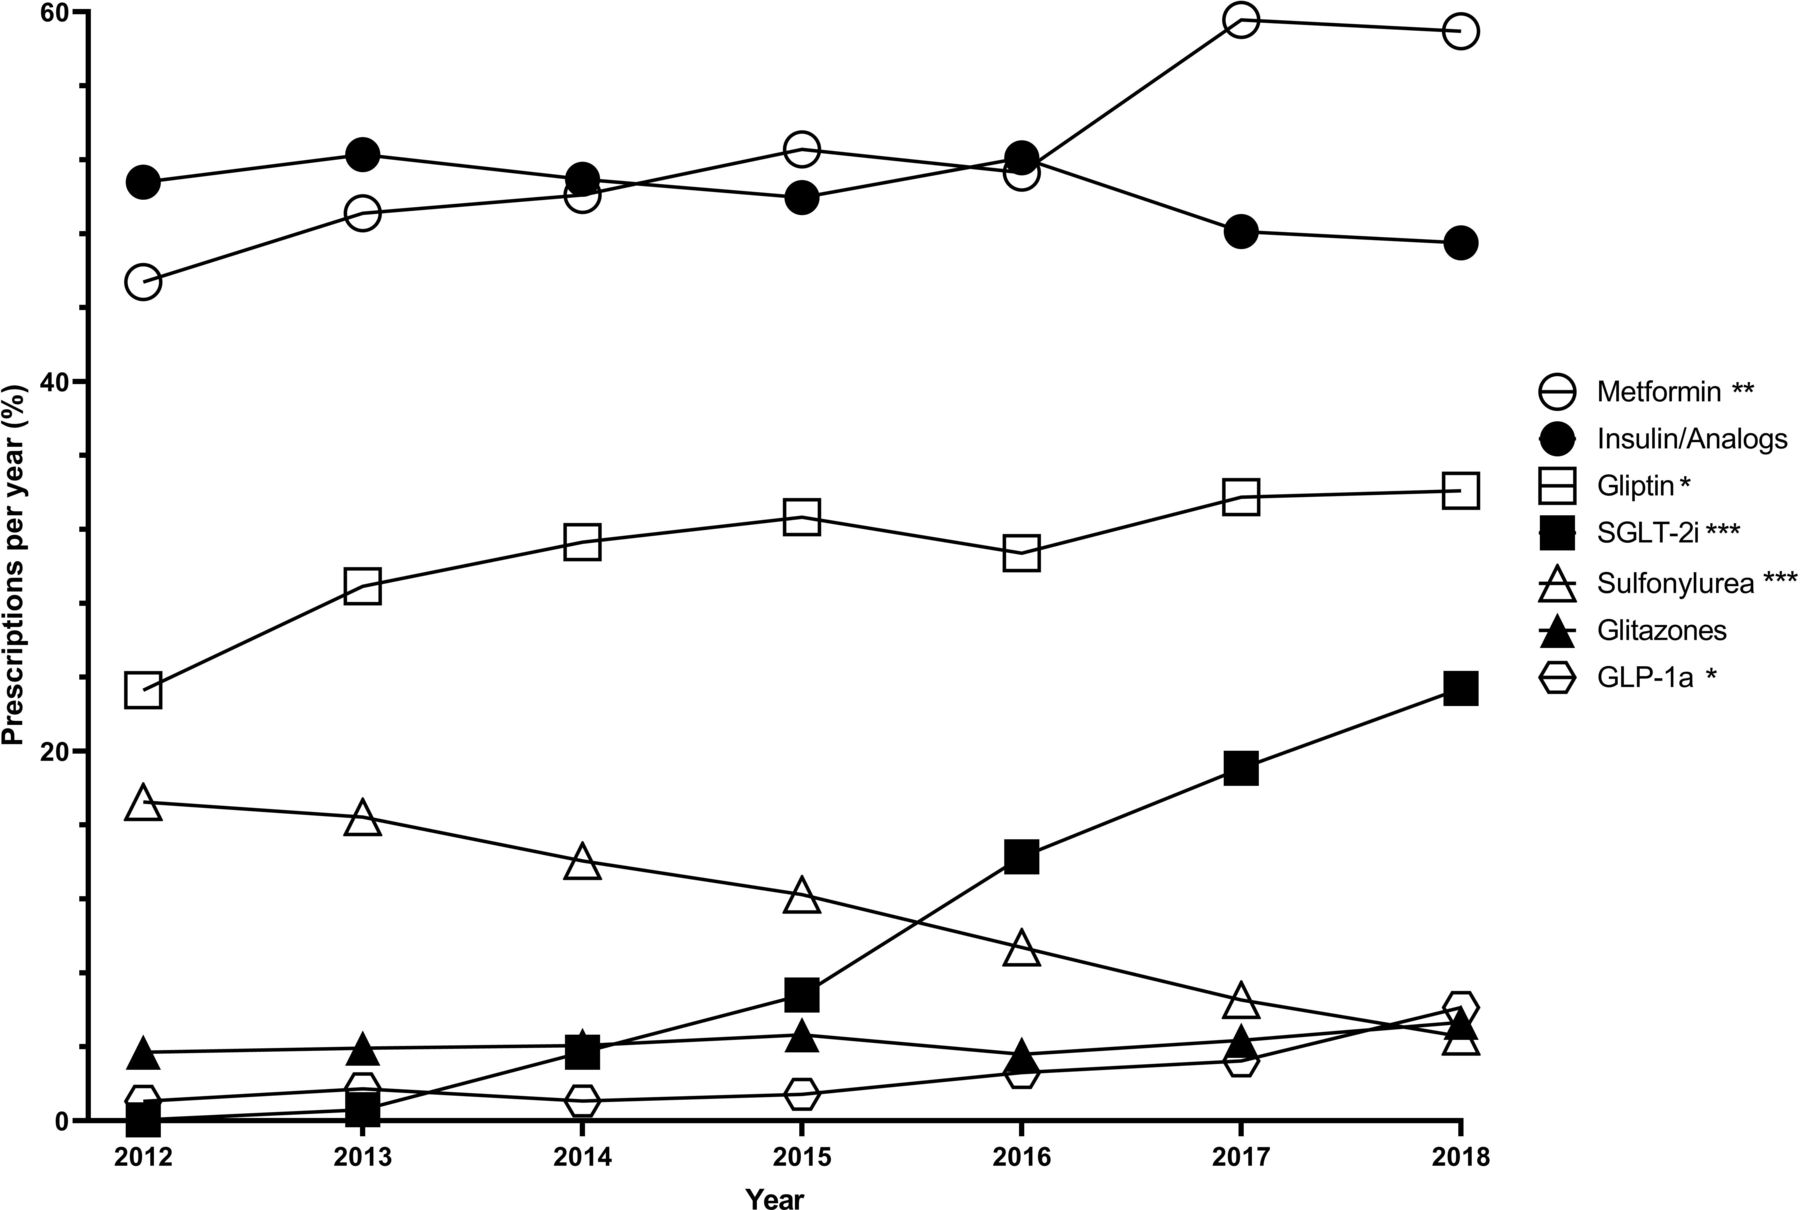
Since 2012 the number of metformin prescriptions increased (2012, 45.4%; 2018, 59%; p=0.002) (figure 1), as well as gliptins (2012, 23.3%; 2018, 34.1%; p=0.013) and SGLT-2i (2012, 0.06%; 2018, 23.4%; p<0.001). In the same period a strong decrease (2012, 17.3%; 2018, 4.6%; p<0.001) was observed in the number of sulfonylurea prescriptions. Glitazones stayed stable at a low level (2012, 3.72%; 2018, 5.34%; p=0.098) and glucosidase inhibitors decreased (2012, 0.74%; 2018, 0.27%; p<0.05). Among injectable therapies insulin and analogs did not change (2012, 50.8%; 2018, 47.5%; p=0.073), but GLP-1a (2012, 1%; 2018, 6.1%; p=0.017) prescriptions increased (figure 1, table 2).

Proportion of antidiabetic drugs prescribed per year from 2012 to 2018 in the Diabetes Registry Tyrol and changes over time from 2012 to 2018. Time series analysis with a linear regression was used to assess if drug prescription has changed in the time from 2012 to 2018. ***P<0.001, **P<0.01, *P<0.05. Overall n=10 875; metformin n=5583; insulin or analogs n=3765; gliptin n=3067; SGLT-2i n=1270; sulfonylurea n=994; glitazones n=399; GLP-1a n=301. GLP-1a, glucagon-like peptide-1 agonist; SGLT-2i, sodium/glucose cotransporter inhibitor.
Metformin was most frequent in patients younger than 80 years (18–39 years, 54.1%; 40–59 years, 65.0%; 60–79 years, 55.0%). Patients older than 80 received less metformin (29.1%). Gliptins were common in patients older than 40 years (40–59 years, 26.5%; 60–79 years, 30.5%; ≥80 years, 25.4%), but less common in patients aged 18–39 years (11.4%). Patients aged 40–59 years received the most SGLT-2i (19.6%) and patients older than 80 the least (2.4%). Insulin or analogs were most frequent in patients older than 80 years (53.4%), and patients 18–79 years received less (18–39 years, 30.3%; 40–59 years, 33.9%; 60–79 years, 43.1%) (table 3).
Combination therapies
More than half (55.6%) of the patients received a metformin-based combination therapy with at least one other antidiabetic drug. The most prevalent combination was metformin with gliptin (19.5%), followed by metformin in combination with insulin or an analog (17.1%). The third most prevalent antidiabetic combination was metformin with SGLT-2i (9.7%), followed by metformin with sulfonylurea (4.6%). Therapy enhancement to a triple therapy consisting of metformin, SGLT-2i and gliptins was more often seen (4.2%) than the dual combination therapy with metformin and glitazones (2.6%) and metformin and GLP-1a (1.9%). The least prescribed combination therapy was metformin, SGLT-2i and GLP-1a (0.7%) (table 2).
Metformin in combination with gliptin (2012, 7.8%; 2018, 17.5%; p=0.024) and metformin in combination with insulin or analogs (2012, 18.6%; 2018, 23.9%; p=0.003) increased significantly. Metformin in combination with SGLT-2i showed the steepest increase (2012, 0.3%; 2018, 15.8%; p<0.001). Combination of metformin, SGLT-2i and gliptin increased significantly (2012, 0%; 2018, 6.7%; p=0.002). Metformin together with sulfonylurea decreased significantly (2012, 8.6%; 2018, 2.9%; p=0.001) and metformin in combination with glitazone stayed the same (2012, 1.7%; 2018, 2.3%; p=0.329) (table 2).
Combination of metformin and gliptins was most frequent in patients aged 40–79 years (40–59 years, 22%; 60–79 years, 22.1%) and almost the same in the youngest and oldest patient groups (18–39 years, 10.9%; 80–99 years, 11%). Metformin in combination with insulin was most common in patients aged 40–79 years (40–59 years, 19.1%; 60–79 years, 19%), while the youngest and oldest groups received less (18–39 years, 14.6%; >80 years, 10.6%). Metformin combined with SGLT-2i was most often in patients 40–59 years (16.7%), almost the same in patients 18–39 and 60–79 years (10.3% and 10.2%) and the least in patients older than 80 years (1.6%). Metformin and sulfonylureas were most common in patients 60–79 years (5.3%), followed by patients 40–59 years and older than 80 years (3.9% and 3.8%) and the least in the youngest (18–39 years, 2.7%) (table 3).
Discussion
Over 7 years metformin alone or in combination was the most frequent antidiabetic drug, followed by insulin or insulin analogs, gliptins, SGLT-2i, sulfonylurea, glitazones, GLP-1a and glucosidase inhibitors. In the 7-year period metformin, gliptin, SGLT-2i and GLP-1a prescriptions increased, sulfonylureas decreased, and insulin and analogs did not change as well as glitazones. The variety of available therapies and the constantly evolving knowledge allow sophisticated and targeted therapies for patients with type 2 diabetes, but also more complex treatment regimens. Diabetes societies face this challenge with regular publications of guidelines to ensure evidence-based, standardized and cost-efficient treatment regimens. However, knowledge is constantly increasing and guidelines cannot change annually. Our data (figure 1) showed that changes occur after publication of large-scale studies proving their benefits, even before these novel findings are applied to guidelines.13 15–17 23 24 29–31 This indicates that diabetologists react fast to published literature and thereby enable evidence-based treatment for their patients.
Metformin
The 2015 guidelines strengthened the first-line therapy position of metformin.10 11 In 2016 the European and American drug approval authorities enhanced its approval to patients with mild and moderate chronic kidney disease (CKD), subsequently leading to an additional increase in metformin prescriptions.32 33 The latest ADA, EASD and ESC guidelines showed a trend toward novel antidiabetic drugs in initial treatment. Metformin remained the first-line recommendation, except for drug-naïve patients with arteriosclerotic cardiovascular disease (ASCVD) and a high or very high CV risk.6 7 11 These developments led to the current position of metformin in the treatment of type 2 diabetes. Since 2012, metformin has shown strong increases, is the most prevalent drug and is more often used in younger patients.34–38 Since the last DRT publication data have shown that metformin is now the most prevalent antidiabetic medication throughout every age group.28 Approval in CKD, decreased CV mortality in monotherapy and combination therapy, same glycemic results as glitazones and sulfonylureas, higher effectiveness than gliptins, increasing long-term data and physician experience made metformin applicable to all age groups and substantiated the increase in use of metformin in the treatment of type 2 diabetes.32 33 39
SGLT-2 inhibitors
The first SGLT-2i was approved in 2012. Due to conflicting data and lack of evidence, the authors of the 2015 and 2016 guidelines were neutral in SGLT-2i recommendations.10 11 40 In 2015 Zinman et al4 published the first large CVOT proving significant CV benefits and a lower rate of all-cause death for one of the SGLT-2is.4 Driven by the CVOT, the 2019 guidelines recommended SGLT-2i, especially in the presence of cardiovascular disease (CVD) and heart failure.4–9 13 14 First increases in prescriptions started between 2013 and 2014. At that time it was known that SGLT-2i promotes decrease in HbA1c, weight loss and a slight decrease in blood pressure (figure 1).41 After the publication of the first CVOT, a marked and steep increase started (figure 1). UK and US registries showed the same dynamics.36 42 43 Compared with the last DRT evaluation, SGLT-2i increased strongly from 3.7% to 11.7%. This increase was very pronounced in patients 18–79 years and least in patients above 80 years,28 although these patients would probably benefit the most from CV advantages, such as lower rate of heart failure, all-cause death and hypoglycemia. Nevertheless the side effects impose a bigger risk for this population. In non-obese elderly patients, weight loss is undesirable, same as the decrease in blood pressure and risk of dehydration due to increased urinary excretion. Young patients are not as prone to develop these side effects.43
Sulfonylureas
The ADA and EASD recommended sulfonylureas as a second-line intensification option in the treatment of type 2 diabetes in 2015 and 2016.10 11 In the current guidelines both societies considered sulfonylureas as the last choice for treatment intensification. Sulfonylureas are still considered second line, if cost is a major issue.6 7 10 11 Accordingly, the number of patients receiving sulfonylureas was constantly decreasing, not only in our cohort but internationally (figure 1).28 34 36–38 Sulfonylurea prescriptions were decreasing in the USA, but were also the most prevalent second-line therapy.34 42 43 Due to a different insurance system, antidiabetic medication is significantly more expensive in the USA, making affordable antidiabetics more important for patients. Sulfonylureas reduce HbA1c, similar to metformin and glitazones, but metformin monotherapy shows a better CV long-term outcome. Furthermore, sulfonylureas increase body weight and are associated with an increased risk of hypoglycemia.39 These facts led to a persistent decreasing significance of sulfonylureas in recent guidelines.7 8 However, when cost is a major issue, sulfonylureas are still considered an option for intensification.7
Insulin and analogs
Novel antidiabetic drugs show enhanced CV benefits, are easier to manage and show less severe side effects than insulin.39 In the 2016 guidelines, insulin was considered earlier in therapy intensification, and since the 2019 guidelines it is now one of the latter steps.6 7 10 11 Despite its consideration later in therapy, insulin is still common in the treatment of type 2 diabetes worldwide, ranging from 30% to 40%.37 42 Insulin showed no significant changes from 2012 to 2018 (figure 1), and insulin is still the second most common antidiabetic drug (table 2) in the DRT.28 Although insulin and sulfonylureas share a higher risk for hypoglycemia, sulfonylurea prescriptions were decreasing while insulin remained stable (figure 1).34 36 42 Insulin is an important cornerstone in the treatment of advanced and long-term type 2 diabetes. Due to decreasing beta-cell and kidney function in elderly patients with type 2 diabetes, many antidiabetic drugs fail to achieve glycemic targets or are contraindicated.44 Therefore, insulin is prescribed more often to elderly patients (table 3).42 The risk of severe hypoglycemia is higher in insulin-treated patients, but modern insulin analogs decreased the risk of hypoglycemia and nocturnal hypoglycemia.38 45 The characteristics of insulin in the treatment of long-term type 2 diabetes and the necessity for the treatment of type 1 diabetes have led to constant development of new insulins, justified their position in the guidelines and in the antidiabetic therapy which is directly reflected in the prescription patterns of diabetologists.
Gliptins
The 2015/2016 diabetes guidelines listed gliptins as add-on therapy to metformin without noting special preferences.10 40 The 2019 guidelines recommend gliptins as add-on to metformin in dual therapy or as triple therapy. Combination of gliptins and sulfonylureas was not recommended. For patients without CKD or CVD, who cannot achieve HbA1c with a monotherapy, gliptins are recommended if there is no need to lose weight.7 Gliptin prescriptions have been increasing since its approval especially as first add-on therapy of choice.34–36 42 In the DRT gliptin prescriptions have significantly increased since 2012; however, the curve has flattened out in the last years (figure 1).28 Whereas increasing prescriptions were an international trend, the proportion of prescribed gliptins showed large differences.35–37 42 Gliptins are expensive, show intermediate efficacy and some of them need dose adjustment in patients with CKD, but the negligible risk for hypoglycemia, easy and convenient management, weight neutrality, and overall good acceptance made them a beneficial add-on therapy.7 23 24 The differences in the number of prescriptions were largely driven by economic factors, especially in the USA where the price for gliptins is noticeably higher than in Europe. This also reflects in the current guidelines, where gliptins are considered last if cost is a major issue.7 9
Glitazones
In the 2015/2016 guidelines glitazones were recommended when HbA1c targets were not achieved after monotherapy. The guidelines stated drug choice is based on patient preferences as well as disease and drug characteristics.10 11 Current guidelines recommend glitazones as first-line intensification in two clearly defined situations. They are recommended if targets cannot be achieved with metformin monotherapy in a patient without ASCVD or CKD and without the need to minimize weight gain or promote weight loss. Furthermore, they are recommended as first-line intensification if cost is a major issue.7 9 Glitazones are not recommended in patients with congestive heart failure, bladder cancer, obesity or osteoporosis.7 11 39 46 In the DRT prescriptions of glitazones stayed stable at a low level, and the same can be seen in the USA and in Europe.34 36 37 Good glycemic control and low risk for hypoglycemia led to extensive glitazone prescriptions in the late 1990s and early 2000s. Troglitazone and rosiglitazone lost their approvals because they were associated with severe side effects, such as hepatotoxicity, higher CV risk, development of bone fractures and bladder cancer,46 47 which led to a steep decrease in prescriptions from then on.36 38 48 49 Nevertheless, pioglitazone, the remaining approved glitazone, showed CV benefits and is a low-cost medication, but due to the previous findings and alternatives the numbers stayed low.7 9
GLP-1 agonists
Since 2015 evidence on the safety and benefits of GLP-1a strengthened.15–22 The 2016 guidelines did not recommend GLP-1a explicitly for use in patients with CVD.10 11 In the current guidelines, GLP-1a and SGLT-2i are considered first-line therapy intensification in patients with CVD and obesity.7 Furthermore, GLP-1a is the first recommended injectable therapy because it is easy to manage, carries no risk for hypoglycemia and decreases weight. International GLP-1a prescriptions were rising but the numbers are overall low (figure 1).28 34 36 37 Treatment with GLP-1a is expensive.7 9 Some countries even recommend discontinuation of GLP-1a if there was no reduction in HbA1c of at least 1 percentage point and 3% in body weight after 6 months, and additionally due to gastrointestinal side effects the discontinuation rate is high.17 34 50
Glucosidase inhibitors
Already in the 2015 European and US guidelines, glucosidase inhibitors were a minor matter which only ought to be tried in specific situations, but were generally not favored due to modest efficacy and side effects.11 Current guidelines state the same.7 Overall the use of glucosidase inhibitors is low in Western countries.34 36 37 In Japan, for example, glucosidase inhibitors were prescribed more often.35 The larger the carbohydrate intake the more the blood glucose-lowering effect, and the Japanese have a distinctly higher carbohydrate intake than Western populations.35 Glucosidase inhibitors and metformin have similar side effects, such as meteorism, nausea, diarrhea and flatulence, but metformin shows better glycemic control, additional weight-lowering effects, evidence-based CV benefits, and is the first-line therapy in Europe and the USA for type 2 diabetes.7 11 Therefore, metformin is probably preferred over glucosidase inhibitors.
Our study has some limitations. The participating centers are specialized hospital outpatient departments or private internal specialists, so the study is not population-based. This carries the possibility of potential bias, as diabetes specialists might intensify therapy more quickly than general practitioners. Additionally, due to their specialization, diabetologists are more likely to read novel study outcomes, and due to their experience in antidiabetic treatment they might be more courageous in implementing novel approaches. A potential bias could be in HbA1c evaluation. To ensure that per year each patient is only assessed once, only data of the last annual visit are considered for the registry. Patients with elevated glycemic parameters visit their responsible doctor more often until optimal diabetes treatment and control are achieved. At this time point HbA1c is most likely to be lower than at treatment start. Beneficial study outcomes for drugs lead to extensive marketing efforts. These can also lead—consciously or unconsciously—to more prescriptions of the promoted drugs. The strengths of our study are the real-world set-up and the size of the cohort. The study contains data on 10 875 patients, an estimate of 20%–25% of patients with type 2 diabetes in Tyrol. It involves repeated measures over 7 years, an interesting period of time when several new antidiabetic drugs were introduced, two guidelines were published, and numerous results of large-scale studies and FDA-required CVOTs were published.
In conclusion, we saw significant changes in prescription patterns of antidiabetic medications in the DRT and also in other national registries. Interestingly the changes did occur in accordance with the guidelines often before they were published, proving that diabetologists adapt their prescription patterns to large-scale trials even before guidelines can be adapted, highlighting the importance of up-to-date, evidence-based medicine to ensure timely, modern and high-quality treatment for patients and their successful implementation. Registries play an important role in monitoring the benefits of new treatments, identifying potential risks, developing modern and evidence-based guidelines, and ensuring a high level of treatment.
Acknowledgments
We thank all participating partners and the employees of the Diabetes Registry Tyrol for their work on data collection and this investigation. We would also like to thank Anna E Engler, PhD, for constructive criticism of the manuscript, proof-reading and linguistic revision.
References
Footnotes
Contributors ClE researched the data, wrote the manuscript, and submitted the paper. MaL performed the descriptive statistics and data management. BP performed the time series analysis with linear regression. MJ is founder and core team member of the DRT, performed patient recruitment and data collection, and reviewed the manuscript. DC-K, KP, DV, JO, EE, KM, BH, GB, KK, GL, LR, UK, AS, FS, GZ, and HG performed patient recruitment and data collection. MoL is founder, organizer and core team member of the DRT and reviewed the manuscript. ID is core team member, organizer and contact person for statistical issues. WO is founder, organizer and core team member of the DRT and reviewed the manuscript. HT is Head of the Department for Internal Medicine I, Medical University Innsbruck, and provided the facility and supervision. ChE is founder, organizer and core team member of the DRT, supervised the lead author, contributed to the discussion and reviewed the manuscript. ClE and ChE developed the first draft of the manuscript. All authors contributed to the finalization of the manuscript. ChE is the guarantor of the work. He had full data access and takes responsibility for the integrity of the accuracy of the analysis.
Funding The Federal State of Tyrol and Tirol Kliniken supported this study. The study received open access funding from Medical University Innsbruck.
Competing interests None declared.
Patient consent for publication Not required.
Ethics approval The Ethics Committee of the Medical University of Innsbruck approved the present study and the Diabetes Registry Tyrol. Due to the retrospective characteristics of the study, no ethics committee approval is required by Austrian law. This information was confirmed by the Ethics Committee of the Medical University of Innsbruck in a general statement. Procedures involving patients, patient data collection, and handling and storage of personal data are in accordance with national laws and the ethical standards of the seventh revision of the Declaration of Helsinki.
Provenance and peer review Not commissioned; externally peer reviewed.
Data availability statement Data that support the findings of this study are available on reasonable request from the corresponding author. Data are not publicly available due to data and personal privacy rights of the participants.