Article Text

Abstract
Introduction Our aim was to assess the effect of introducing flash monitoring in adults with type 1 diabetes with respect to change in hemoglobin A1c (HbA1c) and frequency of hospital admissions.
Research design and methods Prospective observational study of adults with type 1 diabetes in our center, in whom a prescription for a flash monitoring sensor was collected. Primary outcome was change in HbA1c between 2016 and after flash monitoring. Rates of hospital admission were compared between the first year after flash monitoring and the corresponding 12-month period 2 years earlier.
Results Approximately half of all adults with type 1 diabetes, attending our center, collected prescriptions for flash monitoring sensors (n=2216). Median fall in HbA1c was −1 (−0.1) mmol/mol (%) (p<0.001) and was greatest in those with baseline HbA1c >75 (9.0) mmol/mol (%): −10 (−0.9) mmol/mol (%), p<0.001. 43% of those with a baseline HbA1c >53 mmol/mol (7%) experienced a ≥5 mmol/mol (0.5%) fall in HbA1c. In addition to higher HbA1c, early commencement within 1 month of NHS-funded flash monitoring (p<0.001), and male gender (p=0.013) were associated with a fall in HbA1c of ≥5 (0.5) mmol/mol (%). Socioeconomic deprivation (p=0.009) and collecting fewer than 2 sensors per month (p=0.002) were associated with lack of response. Overall, hospital admissions did not change but an increase in admissions for hypoglycemia was observed (1.1% vs 0.3%, p=0.026).
Conclusions Flash monitoring is associated with reduction in HbA1c in individuals with HbA1c >58 mmol/mol. Numerous clinical features are independently associated with HbA1c response. An increase in hypoglycemia admissions occurred following flash monitoring.
- A1c
- continous blood glucose monitor(s)
- hypoglycemia
- ketoacidosis
This is an open access article distributed in accordance with the Creative Commons Attribution Non Commercial (CC BY-NC 4.0) license, which permits others to distribute, remix, adapt, build upon this work non-commercially, and license their derivative works on different terms, provided the original work is properly cited, appropriate credit is given, any changes made indicated, and the use is non-commercial. See: http://creativecommons.org/licenses/by-nc/4.0/.
Statistics from Altmetric.com
Significance of this study
What is already known about this subject?
Flash monitoring reduces hypoglycemia in adults with well-controlled type 1 diabetes and, in real-world studies, is associated with reductions in hemoglobin A1c (HbA1c).
What are the new findings?
Individuals most motivated to commence flash monitoring early had significantly greater reductions in HbA1c as did those with lower deprivation and higher levels of sensor use.
More hospital admissions with hypoglycemia occurred following flash monitoring.
How might these results change the focus of research or clinical practice?
Flash monitoring is an effective intervention but predictors of non-response may be able to help better focus resources toward those currently benefiting less.
Introduction
Flash glucose monitoring is a form of interstitial glucose monitoring which is distinct from conventional continuous glucose monitoring (CGM) in only providing a glucose result when the sensor is scanned by a reader. It does not provide alarm functions but in other respects, such as trend arrows and 24 hours glucose trace, it is similar to conventional CGM.1 Flash monitoring was first made available in the UK in 2015, although prior to November 2017, all use was by self-funding individuals. Self-funders tended to be more affluent than the general population of people with type 1 diabetes and had lower hemoglobin A1c (HbA1c).2 The only large randomized study of flash monitoring was limited to a population with HbA1c ≤58 mmol/mol (7.5%) and no significant issues with hypoglycemia awareness. This study demonstrated a significant reduction in sensor detected hypoglycemia with no change in HbA1c but is difficult to generalize to the majority of people with type 1 diabetes.3 We have previously reported a prospective observational study of the first 900 individuals with type 1 diabetes commenced on flash monitoring in our center, showing substantial improvements in HbA1c and reduction in admissions for diabetic ketoacidosis (DKA).4 However, this was not replicated in a prospective assessment of flash monitoring in Belgium.5 Assessments of flash monitoring to date have typically focused on the early adopters of this technology6 and cannot be extrapolated to the wider cohort of people with type 1 diabetes. We now present the largest prospective single-center evaluation of the introduction of flash monitoring, with respect to HbA1c and hospital admissions, encompassing almost half the population with type 1 diabetes in our clinics.
Participants and methods
Study design and participants
We conducted a prospective observational study of all adults with type 1 diabetes, who collected a National Health Service (NHS) prescription for Freestyle Libre sensors (Abbott, Witney, UK) between February 2018 and February 2019 within NHS Lothian health board. NHS Lothian provides care to approximately 800 000 individuals, including 4671 with type 1 diabetes. NHS Lothian funding for flash monitoring was introduced in February 2018 using Scottish Diabetes Group eligibility criteria: (1) intensive insulin therapy; (2) agree to attend a flash monitoring education session; (3) agree to scan glucose levels at least six times per day; (4) agree to share glucose data with their clinic and (5) had attended a diabetes structured education programme or demonstrated equivalent self-management knowledge. In February 2018, all people with type 1 diabetes attending our clinics were sent a letter detailing these criteria and, if eligible, how to obtain NHS-funded sensors. All individuals who commenced NHS-funded flash monitoring attended a 1-hour education session. The study was entirely observational (with no deviation from standard clinical care) and ethics approval was not required.
Outcomes
The primary outcome was change in HbA1c between 2016 and the next available HbA1c following first prescription of sensors (at least 4 weeks after commencement). The year 2016 was chosen as the baseline HbA1c, as a significant proportion of individuals had used flash monitoring on a self-funded basis prior to NHS prescription, therefore choosing a later baseline date had the potential to underestimate the HbA1c effect of flash monitoring introduction. Paired HbA1c data were available in 92.7% (1800/1941), where a 2016 baseline value was available. We also reported the proportion of individuals achieving the Scottish HbA1c target (<58 mmol/mol (7.5%)) and National Institute for Health and Care Excellence (NICE) target (≤48 mmol/mol (6.5%)) (https://www.nice.org.uk/guidance/ng17). In addition, we assess predictors of an HbA1c response (defined as a fall in HbA1c of ≥5 mmol/mol (0.5%)) both in the complete cohort and in a cohort where HbA1c was >53 mmol/mol (7.0%) at baseline (arguably representing the threshold level at which HbA1c lowering would be regarded as clinically appropriate).
We sought to include as many potential predictors of HbA1c response as possible, including Scottish Index of Multiple Deprivation 2016 (SIMD) rank and quintile (https://www2.gov.scot/Topics/Statistics/SIMD). The structured education programme offered in our center is Dose Adjustment for Normal Eating (DAFNE)7 and previous participation was discerned from our national clinic database system, SCI-Diabetes (https://www.sci-diabetes.scot.nhs.uk). Mode of insulin delivery (multiple daily injection) or continuous subcutaneous insulin infusion (CSII)) was also obtained from SCI-Diabetes. Prescribing data were obtained from NHS Lothian Prescribing Analytical Services, using the individuals unique NHS Scotland identifier (Community Health Index number), and reflected the number of sensors and glucose test strips collected per month from NHS prescriptions in NHS Lothian. Frequency of flash monitoring scanning was obtained from the LibreView portal in a subset of individuals (n=407).
Hospital admission statistics were obtained for the first 12 months following initial flash monitoring prescription (from our health board’s analytical services department) and were compared with the corresponding 12-month window starting in 2016, in individuals diagnosed with diabetes prior to 2016 (n=1590).
Statistical analysis
Data were mostly non-normally distributed (as determined by Shapiro-Wilk test) and are presented as median and IQR. Paired data were analyzed by Wilcoxon signed-rank test and unpaired data by Mann-Whitney U test. Comparisons across multiple groups were analyzed by Kruskal-Wallis test. Categorical data were compared by χ2 test or by McNemar test, when comparing paired repeated measurements. Logistic regression was performed to identify independent predictors of HbA1c response. Correlations were analyzed by Spearman’s rank correlation. Significance was accepted at p<0.05. All analyses were performed using RStudio V.1.0.153 (https://www.rstudio.com).
Results
Participant characteristics
Approximately 47% of all adults with type 1 diabetes in Lothian collected a prescription for flash monitoring sensors (n=2216). A summary of clinical and demographic characteristics for the cohort are presented in table 1. Thirty-eight per cent (n=835) obtained their first prescription in the month following NHS funding being introduced (described as ‘early start’) (table 1). Early start individuals were older (46 (33–57) vs 43 (30–55) years, p<0.001), more affluent (SIMD rank 4682 (2663–6337) vs 4321 (2570–6061), p=0.013), had lower baseline HbA1c (61 (55–70) vs 64 (55–74) mmol/mol, p<0.001) (7.7% (7.2–8.6) vs 8.0% (7.2–8.9)), more likely to have completed DAFNE (41% vs 28%, p<0.001), more likely to be CSII users (28% vs 17%, p<0.001) and previously tested capillary blood glucose more frequently (3.3 (1.9–5.5) vs 3.0 (1.1–4.7) test strips per day, p<0.001), compared with those who started flash monitoring later. Early start individuals were more likely, when using flash monitoring, to scan ≥9 times per day (the median frequency in this cohort) (65% vs 43%, p=0.008).
Clinical and demographic characteristics of the cohort
Overall change in HbA1c
Median duration from first flash monitoring prescription to next HbA1c was 38 (IQR 24–51) weeks. In total, the median change in HbA1c was −1 mmol/mol (IQR −8–5, p<0.001) (−0.1 (−0.7–0.5)%), greatest in those with HbA1c >75 (9.0) mmol/mol (%) at baseline (−10 (−22–0), p<0.001) (−0.9 (−2.0–0.0)%) compared with those with baseline HbA1c 58 (7.5)–75 (9.0) mmol/mol (%) (−2 (−8–3), p<0.001) (−0.2 (−0.7–0.3) and baseline HbA1c <58 (7.5) mmol/mol (%) (+2 (−2–8), p<0.001) (+0.2 (−0.2–0.7)) (p<0.001 for comparison between baseline groups). In individuals with a baseline HbA1c ≥58 mmol/mol, the median change in HbA1c was −4 mmol/mol (−11–2) (−0.4 (−1–0.2). The percentage of individuals with HbA1c <58 (7.5) mmol/mol (%) rose from 34% (613/1800) in 2016 to 40% (711/1800) after commencement of flash monitoring (p<0.001). The percentage of individuals with HbA1c >75 (9.0) mmol/mol (%) fell from 19% (342/1800) to 15% (276/1800) (p<0.001) (figure 1). The percentage with HbA1c ≤48 (6.5) mmol/mol (%) rose from 10% (182/1661) to 12% (212/1661) (p=0.057).
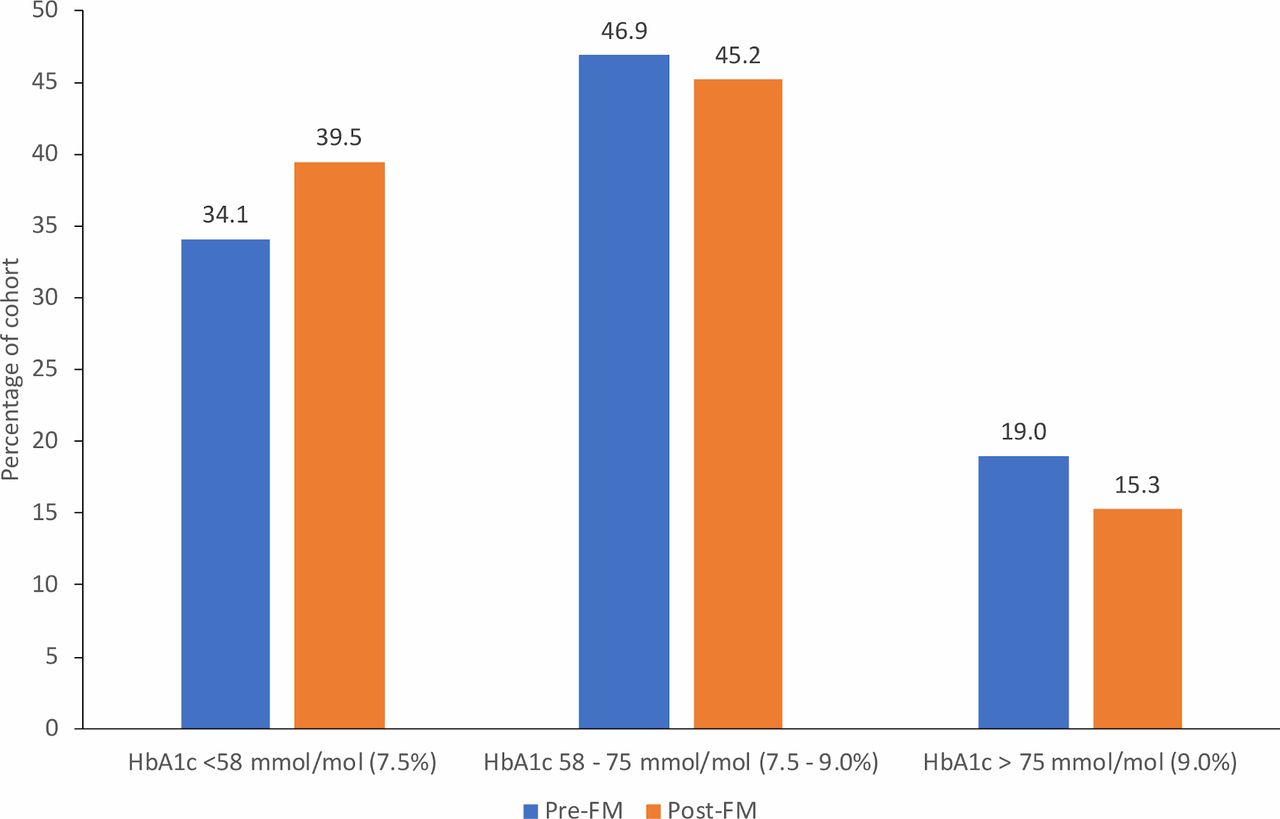
Hemoglobin A1c (HbA1c) category at baseline (2016) and following first prescription of flash monitoring (FM) sensor.
Prescribing data
In the complete cohort, median sensors collected per month was 2.3 (2.0–2.7) with 16% collecting fewer than two sensors per month (349/2216) and a discontinuation rate of 8.9% (182/2043), defined as no collected prescriptions in the final 3 months of follow-up. Individuals in the early start cohort were less likely to have collected fewer than two sensors per month (13% vs 17%, p=0.006) and less likely to have discontinued flash monitoring use (7.2% vs 10.1%). Limiting the assessment to those diagnosed with diabetes prior to 2017, the median daily glucose test strip prescription in the first 6 months of 2017 was 3.3 (IQR 1.6–4.9) falling to 0.8 (0.3–2.2) following commencement of flash monitoring (p<0.001).
Univariate analysis of change in HbA1c
Higher baseline HbA1c was strongly associated with greater fall in HbA1c (R −0.427, p<0.001) (figure 2). In addition, male gender, lower socioeconomic deprivation, commencement in the first month after NHS funding became available, collecting two or more sensors per month and attendance at DAFNE were all associated with greater fall in HbA1c in univariate analysis (table 2). In the early start cohort (February and March 2018), the percentage with HbA1c <58 (7.5) mmol/mol (%) rose from 36% (269/751) to 45% (341/751) (p<0.001), however there was no significant difference in those in later start cohorts (33% (344/1049) vs 35% (370/1049), p=0.118). Similarly, the change in HbA1c after flash monitoring was +1 (+0.1) mmol/mol (%) (−8–8 (−0.7–0.7), p=0.572) in individuals in SIMD quintile 1 compared with −1 (−0.1) mmol/mol (−8–5 (−0.7–0.5), p<0.001) in those in SIMD quintiles 2–5.
Univariate analysis of median change in HbA1c between 2016 and following flash monitoring prescription (mmol/mol and %)

Relationship between baseline hemoglobin A1c (HbA1c) (2016) and subsequent change in HbA1c following flash monitoring. The gray shading indicates the 95% CI for the regression line. Spearman’s r=−0.427, p<0.001.
Logistic regression analysis of change in HbA1c
In total, 37% (668/1661) achieved an HbA1c fall of ≥5 (0.5) mmol/mol (%), with a higher proportion noted in those with baseline HbA1c ≥53 (7.0) mmol/mol (%) (43% (633/1474)) and baseline HbA1c ≥58 (7.5) mmol/mol (%) (47% (553/1187)). Fall in HbA1c of ≥5 (0.5) mmol/mol (%) was independently associated with higher HbA1c, early commencement of flash monitoring, collecting two or more sensors per month, lower socioeconomic deprivation and male gender (table 3). When limited to those with an HbA1c ≥53 (7.0) mmol/mol (%) at baseline, younger age was also independently associated with fall in HbA1c (table 3).
Logistic regression analysis of factors influencing HbA1c response (fall of of ≥5 mmol/mol (0.5%)) following commencement of flash monitoring
Hospital admission data
The percentage of individuals admitted to hospital in the 12 months following flash monitoring was not significantly different when compared with the corresponding 12-month period 2 years earlier (19% vs 17%, p=0.151). However, the total number of admission episodes was greater (582 vs 490 admissions, p=0.044). The percentage of individuals with an admission for DKA was 1.8% in the 12 months following flash monitoring compared with 2.6% 2 years earlier (p=0.118). The total number of DKA admissions was also not significantly different (36 vs 49, p=0.143). When stratified by start cohort, there was a significant DKA reduction in the early start group (7 vs 18 individuals, p=0.046) compared with later starts (22 vs 28 individuals, p=0.417). The proportion of people admitted due to hypoglycemia was small (1.1%) but was greater than 2 years previously (0.3%, p=0.006). The total number of hypoglycemia admissions was also greater in the year following flash monitoring (17 vs 5, p=0.014). Prior attendance at a DAFNE course was associated with a lower risk of being admitted for hypoglycemia in the year after flash monitoring prescription (OR 0.23, p=0.040). No other clinical or demographic factors were associated with risk of hypoglycemia admission.
Discussion
We have demonstrated that flash monitoring is associated with significant reductions in HbA1c in people with type 1 diabetes, although this is largely confined to people with HbA1c >58 (7.5) mmol/mol (%) at baseline. The magnitude of change in the total cohort (−1 (−0.1) mmol/mol (%)) is not as great as demonstrated in our previous assessment of flash monitoring (−4 (−0.4) mmol/mol (%)), which was limited to the earliest adopters of NHS-funded flash monitoring (corresponding to the early start group in this study).4 Commencement of flash monitoring at the earliest opportunity after NHS funding was introduced, was a significant independent predictor of an HbA1c fall of ≥5 (0.5) mmol/mol (%). Early commencement of flash monitoring was associated with a number of parameters which are typically associated with lower HbA1c, such as CSII use,8 DAFNE attendance7 and lower socioeconomic deprivation.9 However, the association of early flash monitoring commencement and HbA1c response was independent of these parameters and suggests that the individual’s motivation to use this technology is critical. Early flash monitoring users had a higher utilization of glucose test strips prior to flash monitoring and were also more likely to scan frequently when using flash monitoring, suggesting more intensive self-management in this group, both at baseline and during flash monitoring use.
Socioeconomic deprivation has a clear negative influence on the likelihood of HbA1c falling after flash monitoring commencement, greatest for those in the most deprived SIMD quintile. Socioeconomic deprivation is therefore a predictor of suboptimal HbA1c9 and reduces the likelihood of benefiting from flash monitoring. It may be the case that socioeconomic deprivation is a proxy for poorer numeracy skills, which are associated with higher HbA1c and may limit the usefulness of the profusion of new data generated from flash monitoring.10 It is also likely that other life challenges faced by those in the most deprived socioeconomic groups produce barriers to glycemic management which are not addressed by access to glucose data. These findings should prompt reflection on how best to support this cohort to maximize the benefits of flash monitoring.
As previously demonstrated,4 the largest flash monitoring benefits, in terms of HbA1c reduction, were realized by those with the highest baseline HbA1c. There was actually a significant increase in HbA1c in those with baseline HbA1c below 58 (7.5) mmol/mol (%). The data available in this study did not permit us to assess potential reductions in hypoglycemia and improvement in hypoglycemia awareness, which may have been the primary goal in many individuals with lower baseline HbA1c. Observational studies are unlikely to fully resolve this issue and only a randomized controlled trial, in a genuinely representative population with type 1 diabetes, could offer conclusive evidence of hypoglycemia reduction. Interestingly, a recent large prospective observational study in Belgium has shown reduced rates of hypoglycemia in flash monitoring users but little effect on HbA1c.5 These differences may reflect the slightly higher mean HbA1c in our cohort (65 mmol/mol (8.1%) vs 62 mmol/mol (7.8%)) as well as lower baseline rates of hospital admission for hypoglycemia in our population (0.3% vs 1.9%), therefore the primary focus of therapy may have been skewed toward HbA1c reduction rather than hypoglycemia avoidance.
Older age at flash monitoring commencement was independently associated with a lower likelihood of HbA1c response. This contrasts with the JDRF study of CGM, which demonstrated maximum HbA1c lowering in older adults.11 The association between male gender and glycemic response to flash monitoring has not, to our knowledge, been previously reported and is difficult to explain. Men had marginally lower levels of test strip use prior to flash monitoring use but this did not appear to influence the association and, comparing men and women, flash monitoring daily scanning trended toward being higher in women (data not shown). It is not surprising to find that individuals in whom fewer than two sensors were collected per month (the minimum number to ensure complete flash monitoring coverage) were less likely to see a substantial reduction in HbA1c. This is consistent with previous studies of CGM which demonstrate a relationship between percentage sensor use and reduction in HbA1c.11
Glucose test strip prescribing fell significantly following commencement of flash monitoring, as would be expected. The approximate threefold reduction in test strip prescribing will offset some of the excess healthcare expenditure associated with flash monitoring. Glucose test strip use may fall further following changes to UK driving regulations, which now permit the use of flash monitoring glucose in most circumstances (https://www.gov.uk/guidance/diabetes-mellitus-assessing-fitness-to-drive%23insulin-treated-diabetes).
The slight increase in total admissions, following flash monitoring, is potentially attributable to the greater likelihood of admission as the cohort ages. The smaller number of DKA admissions following flash monitoring did not reach statistical significance. This is in contrast to the findings in our earlier publication which focused on the earliest cohort of flash monitoring users and did suggest a decrease in rates of DKA.4 Indeed, within the current study cohort, those in the early start group had a significant reduction in DKA admissions not replicated in later users. Whether flash monitoring has a significant impact on DKA may only become clear on assessment of larger national cohorts.
Admissions for hypoglycemia were rare but increased significantly following flash monitoring. While hospital admission data for severe hypoglycemia fail to capture the majority of episodes,12 our findings are consistent with the observation that real-time CGM is superior to flash monitoring in reducing hypoglycemia in high-risk individuals.13
An assessment of the effect of CGM on hospital admissions in Belgium showed CGM to be effective in a population with high rates of impaired awareness of hypoglycemia (47%) and glucose-related hospital admissions (16%).14 Although this was a substantially different cohort from the one reported in our study, it does raise the question of whether alarms are necessary, where hypoglycemia reduction is the primary goal of therapy. However, a subsequent Belgian assessment of flash monitoring was associated with lower rates of self-reported severe hypoglycemia and a non-significant decrease in hypoglycemia hospital admissions.5 Our study was limited by the absence of detailed information on hypoglycemia awareness and hypoglycemia event rates. Interestingly, the only factor which predicted an admission for hypoglycemia in flash monitoring users was not having attended a DAFNE course. DAFNE is known to reduce rates of severe hypoglycemia as well as improving hypoglycemia awareness15 and our observation reinforces the importance of adequate self-management education in conjunction with new technologies.
The key strength of this study is the large number of individuals assessed, making it the largest prospective report of HbA1c change following flash monitoring to date. As a single-center study, we have been able to report comprehensive data on HbA1c monitoring and hospital admissions. On the other hand, a single-center assessment is open to questions of generalizability, although our clinic demographics are transparently similar to other centers within the UK. This study is also open to the typical criticisms of observational studies, including whether the observed changes in HbA1c can be attributed to flash monitoring. We have addressed this criticism in an earlier publication where we were able to show that individuals within our center never exposed to flash monitoring did not show any significant reduction in HbA1c across the same period.4 We did not have detailed information on potential self-funded use of flash monitoring, within our cohort, prior to NHS funding becoming available, we therefore made a pragmatic decision to use 2016 HbA1c data as baseline. This was based on an earlier study4 showing that a significant proportion of our patients were self-funding in 2017 and using these data as baseline would lead to a significant underestimate of the impact of flash monitoring. Another limitation of our study, as noted earlier, is that reliance on hospital admissions to capture severe hypoglycemia will have resulted in a significant underestimation of total severe hypoglycemic episodes.
We have shown that flash monitoring is associated with significant improvements in HbA1c, largely confined to those with above target HbA1c at baseline. The magnitude of the HbA1c effect in this study is smaller than in previous reports and may be explained by the fact that early adoption of this technology is a predictor of benefit. Unlike this study, previous reports have largely been limited to early flash monitoring users and may not be generalizable to all individuals with type 1 diabetes.4 6 Although the observational study design cannot confirm flash monitoring as the cause for change in HbA1c, we have previously shown that individuals not exposed to flash monitoring, in our center, had no change in HbA1c across a similar time scale.4 We present a number of other factors associated with HbA1c lowering in flash monitoring users, although none is sufficiently predictive to justify limiting the use of flash monitoring to particular cohorts. These factors do, however, suggest areas where resources could be directed to ensure the benefits of flash monitoring are realized equitably. Patterns of hospital admission following flash monitoring use suggest a small but significant increase in severe hypoglycemia and a trend toward reduced DKA, although this would benefit from validation in larger cohorts.
References
Footnotes
Contributors All authors were involved in the study design. Data analysis and interpretation was by FWG. The document was drafted by FWG and all authors were involved in subsequent revisions and final approval. The study guarantor is FWG.
Funding The authors have not declared a specific grant for this research from any funding agency in the public, commercial or not-for-profit sectors.
Competing interests FWG and ARD have received speaker fees from Abbott.
Patient consent for publication Not required.
Provenance and peer review Not commissioned; externally peer reviewed.
Data availability statement The datasets generated during and/or analyzed during the current study are available from the corresponding author on reasonable request.