Article Text

Abstract
Introduction The study aimed to evaluate Choroidal Vascularity Index (CVI) of Haller’s and Sattler’s layers and their relationships with choroidal and retinal thickness, volumes measured on enhanced depth imaging–optical coherence tomography (OCT) scans in the eyes of patients without diabetes, patients with diabetes with no diabetic retinopathy (DR) and patients with diabetes and DR.
Research design and methods Retrospective analysis of 165 eyes from 84 Singapore Indian Eye Study-2 study participants (group 1: no diabetes, group 2: diabetes with no DR and group 3: with DR). Groups 1 and 2 were matched by age and gender from group 3.
Results In the eyes of patients with diabetes without DR, the macular CVI of Haller’s but not Sattler’s layer was significantly reduced compared with eyes of patients without diabetes. Eyes with >5 years of diabetes have significantly decreased CVI of Sattler’s layers (mean difference=0.06 ± 0.10, p=0.04) and also decreased subfoveal choroidal volume (mean difference=0.89 ± 0.16 mm3, p=0.02), compared with those with ≤5 years of diabetes.
Conclusion Diabetic eyes without DR had significantly lower CVI of macular Haller’s layer than those of healthy controls. With a longer duration of diabetes, CVI of subfoveal Sattler’s layer and choroidal volume continue to decrease, irrespective of diabetic control, suggesting that early diabetic choroidopathy mainly affects larger choroidal veins initially before medium-sized arterioles. The CVI of macular Haller’s layer could potentially be used as a marker on spectral domain OCT imaging in newly diagnosed patients with diabetes for the onset of DR and as a possible prognostication tool in diabetic eyes. Future prospective longitudinal studies in diabetic eyes would be useful in establishing the relationship between CVIs of Haller’s and Sattler’s layer with visual acuity as a marker of photoreceptor health and visual prognosis.
- retinopathy
- A1C
- pathophysiological processes
- acute and late complications
This is an open access article distributed in accordance with the Creative Commons Attribution Non Commercial (CC BY-NC 4.0) license, which permits others to distribute, remix, adapt, build upon this work non-commercially, and license their derivative works on different terms, provided the original work is properly cited, appropriate credit is given, any changes made indicated, and the use is non-commercial. See: http://creativecommons.org/licenses/by-nc/4.0/.
Statistics from Altmetric.com
Significance of this study
What is already known about this subject?
Diabetic retinopathy (DR) is a major cause of visual loss worldwide and affects up to 35% of patients with diabetes.
However, the pathogenesis of early diabetic choroidopathy (DC) is still not well understood.
Earlier studies have reported choroidal thinning in the eyes of patients with diabetes compared with those of patients without diabetes, and a thinner choroid in eyes with a longer duration of diabetes. Furthermore, the Choroidal Vascularity Index (CVI) is decreased in the eyes of patients with diabetes compared with those of patients without diabetes.
No other study has looked at the differential changes of CVI of Haller’s and Sattler’s layers separately in relation to changes in choroidal thickness (CT) in early DC. The relationships of CT, retinal thickness (RT), and their volumes with the vascular sublayers of Sattler and Haller have also not been established in the pathogenesis of DC.
What are the new findings?
Eyes of patients with diabetes with no DR have a lower macular CVI of Haller’s layer, but not Sattler’s layer, compared with those of healthy control eyes, although there were no significant differences in CTs and RTs or volumes between these two groups.
Interestingly, patients with diabetes with a disease duration of more than 5 years had a decreased choroidal volume and subfoveal CVI of Sattler’s layer, but not CT or CVI of Haller’s layer compared with patients with diabetes with a disease duration of less than 5 years.
Glycosylated hemoglobin levels were not associated with changes of CTs, RTs or volumes or CVI.
Significance of this study
How might these results change the focus of research or clinical practice?
Our results suggest that DC mainly affects larger choroidal veins initially before medium-sized arterioles in the early pathogenesis of DR.
The CVI of macular Haller’s layer could potentially be used as a marker on spectral domain optical coherence tomography imaging in newly diagnosed diabetics for the onset of DR and as a possible prognostication tool in the eyes of patients with diabetes.
Future prospective longitudinal studies in the eyes of patients with diabetes would be useful in establishing the relationship between CVIs of Haller’s and Sattler’s layer with visual acuity as a marker of photoreceptor health and visual prognosis.
Introduction
Diabetic retinopathy (DR) is a major cause of visual loss worldwide and is estimated to affect up to 35% of patients with diabetes.1 The pathogenesis of DR is primarily attributed to a dysregulation of the retinal vasculature involving a breakdown of the blood–retinal barrier.2 Recently, the role of diabetic choroidopathy (DC) in the pathogenesis of DR3 4 and its complications of choroidal thinning and decreased vision in DR have been of interest. The choroid is essential is providing nutrients and oxygenation to the outer retina layers.5 The choroidal vasculature is subdivided into small vessels in the superficial choriocapillaris, medium-sized vessels in the Sattler’s layer consisting of mostly choroidal arterioles and deeper large-sized vessels in the Haller’s layer composed of mostly choroidal veins.6 Histopathological analysis of diabetic choroids revealed changes such as microaneurysms, loss of choriocapillaris, drusenoid deposits on Bruch’s membrane, polymorphonuclear leukocytes in the choriocapillaris and choroidal neovascularization.7–10 Indocyanine green angiography has affirmed the findings of histopathological studies demonstrating reduced blood flow in the subfoveal choroid as evidenced by hypofluorescence and late filling that represent areas of vascular compromise.11 Choroidal perfusion is found to be associated with photoreceptor function, and it is hypothesised that choroidal hypoperfusion may lead to a reduced supply of oxygen and nutrients to the retinal pigment epithelium (RPE) and photoreceptors and have a subsequent profound impact on vision.12 13 This suggests that DC should be evaluated in detail for prognostication purposes, and as a potential therapeutic target in improving choroidal perfusion that could potentially attenuate photoreceptor damage and improve visual prognosis.
The usage of enhanced depth imaging (EDI) protocol for spectral domain optical coherence tomography (SD-OCT) has allowed detailed non-invasive imaging of the choroid.14 Studies have been published earlier to assess choroidal thickness (CT) in DR, with conflicting results. While a few studies showed the thickening of CT in eyes with DR compared with healthy eyes,15 16 most studies report a decrease in CT in the eyes of patients with diabetes compared with patients without diabetes.15 17–20 The longer the duration of diabetes, the thinner the choroid in these eyes.15 21 Of recent, the Choroidal Vascularity Index (CVI) has been proposed to be a more robust and stable measure of the vascularity of the choroid and choroidal health compared with measuring CT alone due to physiological and systemic-related variations in the CT.22 23 CVI is decreased in the eyes of patients with diabetes compared with those without diabetes.24 25 However, the pathogenesis of early DC is still not well understood. To our knowledge, no other study has looked at the differential changes of CVI of Haller’s and Sattler’s layers separately in relation to changes in CT in the early DC. The relationships of CT, retinal thickness (RT), and their volumes with the vascular sublayers of Sattler’s and Haller’s have also not been established in the pathogenesis of DC.
Thus, we aimed to evaluate the CVIs of Haller’s and Sattler’s layers and their relationships with CT, RT, and volumes in eyes of patients without diabetes, patients with diabetes with no DR, and patients with diabetes and DR.
Methods
This study was conducted as part of a study cohort from the Singapore Indian Eye Study-2 (SINDI-2), a population-based survey of major eye diseases in ethnic Indians aged 40–80 years living in the southwestern part of Singapore conducted from August 2007 to December 2009.26 Written informed consent was obtained from the subjects after explanation about the details of the study and any potential risks and consequences involved with the study. Details of the study design and methodology have been reported elsewhere.26
In this study, we selected patients from SINDI-2 with at least mild non-proliferative DR and then selected age-matched, gender-matched, and ethnicity-matched controls. We divided the subjects into three groups as follows: group 1: healthy subjects without diabetes; group 2: subjects with diabetes without DR; and group 3: subjects with diabetes with at least mild or worse DR status. Subjects who met the following exclusion criteria were not included: any subjects with diabetic macular oedema, any treatment for DR previously, such as focal laser, panretinal photocoagulation or intravitreal injections, previous retinal surgery and other retinal or choroidal pathology, such as age-related macular degeneration, vitreomacular traction, epiretinal membrane, macula hole, uveitis, or systemic disease that might affect CT (eg, uncontrolled hypertension, systemic lupus erythematosus, anemia, leukemia, and obstructive sleep apnea).
Each participant underwent a standardized examination. Ocular biometry, including axial length (AL), was measured using non-contact partial coherence interferometry (IOL Master V3.01, Carl Zeiss Meditec AG, Jena, Germany). A detailed interviewer-administered questionnaire was used to collect demographic data, medical history (eg, hypertension, diabetes, and hyperlipidemia), ocular history, and medication use from all participants. Non-fasting venous blood samples were analyzed at the National University Hospital Reference Laboratory for biochemical testing of serum total cholesterol, triglycerides, and glycosylated hemoglobin (HbA1C). DR was graded as no DR, ‘mild/moderate DR’, ‘severe non-proliferative diabetic retinopathy (NPDR)’ or ‘proliferative DR’ based on the modified Early Treatment Diabetic Retinopathy Study (ETDRS) retinopathy severity scale.27
Retinal and choroidal optical coherence tomography (OCT) imaging acquisition
The retinal and choroidal architectural parameters were determined using EDI mode of Spectralis SD-OCT (Spectralis, wavelength: 870 nm; Heidelberg Engineering, Heidelberg, Germany). OCT raster scans with EDI were acquired at the 3×3 mm macular region of both eyes of each subject. A volume scan of 20°×20° containing at least 31 B-scans (each composed of 1536 A-scans) centering at the fovea was obtained for each eye. Individual B-scan was an average of 25 frames and 240 mm apart from the consecutive B-scan. All the scans included in the study had a quality index of at least 18, which is considered an acceptable quality.
Following Spectralis user manual guidelines, subjects’ keratometry readings and refraction were entered into the Spectralis software before imaging the retina and choroid to estimate optical magnification, thus allowing for more accurate comparisons across individuals. However, Spectralis OCT does not allow AL to be entered, and hence our methods might still have residual errors (2%–7%)21 due to ocular magnification from methods that additionally use AL.28
The RT and CT were measured using the in-built callipers tool at five points (subfoveal, 0.5 and 1.0 mm temporal and nasal to the fovea each). The subfoveal CT was defined as the vertical distance between the ocular surface of the RPE and the choroidal–scleral interface (CSI) at the fovea, defined by a hyper-reflective dot echo at the innermost retinal layer. The macular CT was defined as the CT within the entire 3×3 mm macular area. The RT was measured manually using the calliper tool in the software from the inner surface of the RPE to the inner limiting membrane. Subfoveal choroidal and retinal volumes were recorded from the volume map with the ETDRS grid (central 1 mm). Thickness and volume of each of the following retinal layers were individually measured by the automatic segmentation algorithm on the imaging software Heyex (Heyex SP-X V.6.4.8.116): retinal nerve fiber layer, retinal ganglion cell, inner plexiform layer, inner nuclear layer, outer plexiform layer, outer nuclear layer RPE and photoceptor layer.
Image delineation
Raw OCT images were loaded on a custom-written application on MATLAB that enabled delineation for detailed morphological and vascular analyses.29–31 Three structures were delineated: the Bruch’s membrane, the junction between the Sattler’s and the Haller’s layer, and the CSI. Bruch’s membrane was delineated automatically by the Spectralis OCT device, whereas the foveal centre and three to four most prominent points corresponding to the junction between the Sattler’s and the Haller’s layers, and the CSI were manually marked by a single author (PG) using our custom application.
Measurement of choroidal vascular parameters using MATLAB
For each eye, the horizontal cross-sectional scan passing through the fovea was identified. Based on this cross-sectional scan, we defined and calculated (in MATLAB) the following choroidal vascular parameters.
Choroidal vascular area within foveal and macular regions
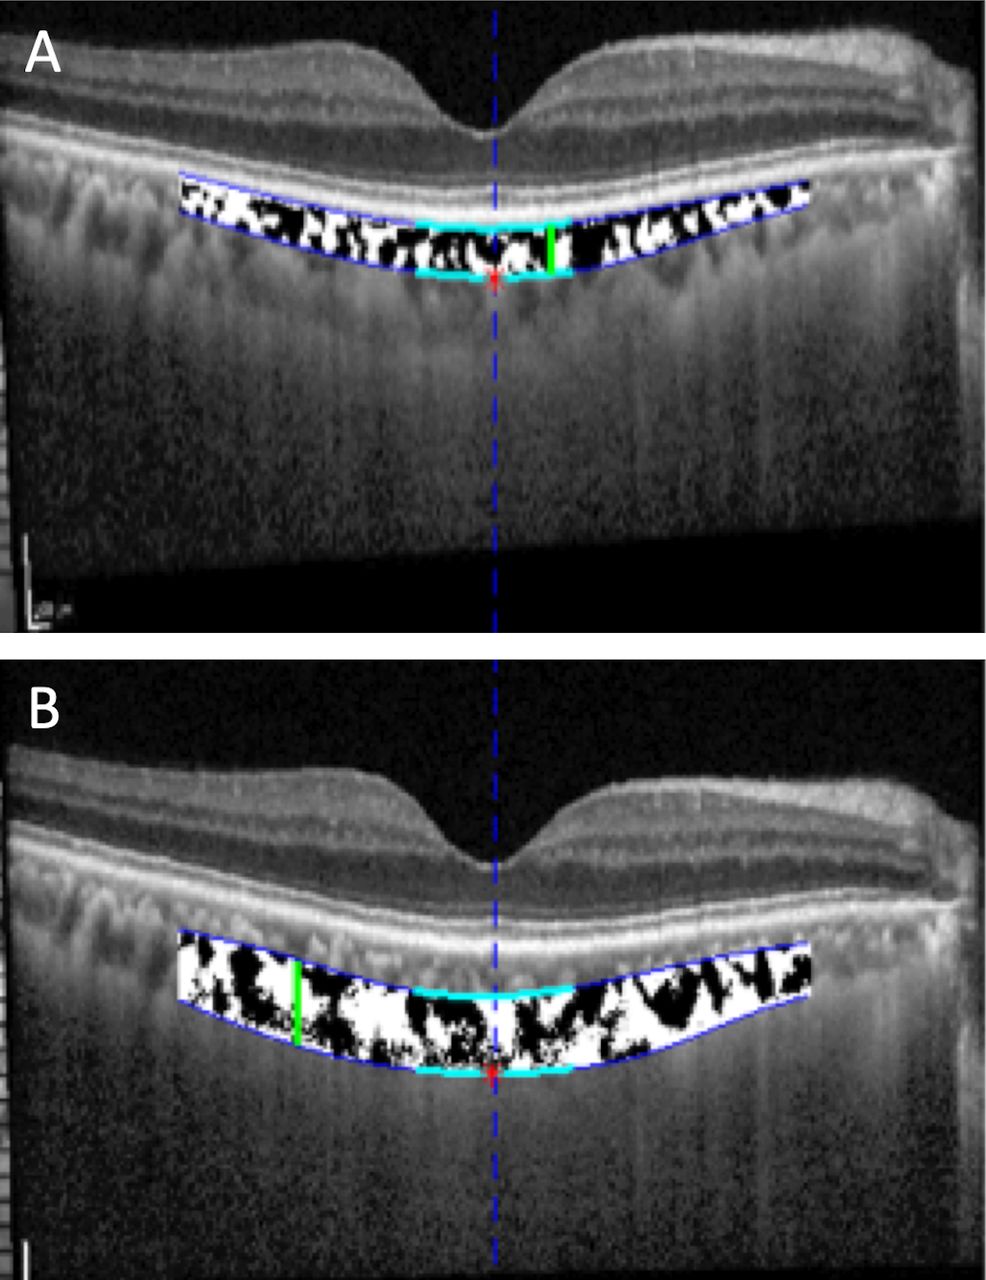
To measure the CVI, image binarization was performed using our custom-written application on MATLAB, as described previously.29 The choroidal area of interest was selected using the polygon tool and was added to the region of interest manager. After converting the image into 8 bit, Niblack autolocal thresholding was applied,32 which gave the mean pixel value with SD for all the points. On the OCT scans, the luminal area (LA) was highlighted by applying the colour threshold. Black areas within the choroid after binarization were assumed to represent stromal area (SA), which corresponds to the interstitial or stromal component of the choroid. The CVI was calculated respectively for the Sattler’s layer (defined as the region between the Bruch’s membrane and the lower border of the Sattler’s layer) and Haller’s layer (defined as the region between the lower border of the Sattler’s layer and the CSI (figure 1). The area of this region was measured within the subfovea as well as the macula, as described previously.29
Delineation of choroid (A) Sattler’s and (B) Haller’s layers obtained by our custom-written application on MATLAB on choroidal images acquired by enhanced depth imaging spectral domain optical coherence tomography. Black areas indicate vascular areas and white areas indicate stromal areas.
In the previous work published by our group, we had demonstrated excellent intragrader (interclass correlation (ICC): 0.97–0.99 for TCA and ICC: 0.91–0.98 for LA) and intergrader reliability (ICC: 0.90–0.97 for TCA and ICC: 0.89–0.97 for LA) for CVI measurements using the same binarization method.22
Statistical analysis
All analyses were performed in SPSS V.20.0 (IBM Corp.) and statistical significance was evaluated at the 5% level. All quantitative variables were estimated using mean and SD. Qualitative or categorical variables were described as frequencies (n) and percentages (%). Independent t-test and χ2 tests were used for continuous and categorical variables, respectively, across all groups (overall), model 1 (group 1 vs group 2), and model 2 (group 2 vs group 3). CT and CVI were analyzed independently using a generalised linear effects model, adjusted separately for age, gender, hypertension, duration of diabetes, and AL.
Data and resource availability
The datasets and resources generated and analyzed during the current study are not publicly available as it belongs to the Singapore Eye Research Institute but are available from the corresponding author on reasonable request.
Results
A total of 167 eyes from 84 patients which were age-matched and gender-matched across three different groups with EDI-OCT scans were included in the study. The overall mean age was 50.8±5.8 years (age range 43–66), and the mean age was 50.8±6.1 (age range 44–61), 50.3±5.1 (age range 43–62), and 53.6±7.5 (age range 44–62) years for groups 1, 2 and 3, respectively. The baseline demographic characteristics of the study group are shown in table 1. There are significantly more subjects with hypertension in group 2 (68.0%) and group 3 (83.3%) compared with group 1 (39.2%) (p<0.001), and group 3 subjects had a significantly longer duration of diabetes than group 2 subjects (12.33±7.14 vs 4.24±6.76 years, p<0.001).
Baseline characteristics of participants in the study (N=167)
Comparing the three groups, we found that there were no significant differences in terms of volume and thickness of all retinal layers (table 2). In eyes with DR (group 3), subfoveal CT (269.50±64.67 μm) and choroidal volume (7.38±1.52 mm3) were significantly reduced compared with eyes without DR (subfoveal CT: 307.16±62.47 μm vs 312.14±68.61 μm in groups 2 and 1, respectively, p=0.0047; choroidal volume: 8.35±1.50 mm3 vs 8.61±1.69 mm3 in groups 2 and 1, respectively, p=0.02), respectively (table 2). There were no significant differences in CT and volume between groups 1 and 2 (model 1, p>0.05 for all). After adjusting for age, gender, hypertension, AL, and groups of eyes, we found that decreased choroidal volume was still associated with group 3 (OR −1.10, 95% CI −1.88 to to 0.33) but not subfoveal CT (table 3).
Retinal and CT and volume measurements and CVI of macular and subfoveal layers (N=167)
Relationships of choroidal thickness, volume, CVI of Haller’s and Sattler’s layers and diabetic retinopathy status
In eyes with DR (group 3), CVI of the macula’s Haller’s layer was also significantly reduced compared with eyes without DR (group 1 and group 2 separately) (0.42±0.06 um vs 0.44±0.05 vs 0.45±0.05, respectively, p=0.02) (table 2). In models 1 and 2, the CVI of macular Haller’s layer was found to be reduced in group 2 compared with group 1, and in group 3 compared with group 2, separately (p<0.05, table 2). There were no significant differences in the subfoveal or macular CVI of the Sattler’s layer across all three groups (overall) or in model 1 or 2. After adjusting for age, gender, hypertension, AL and groups of eyes in separate models, CVI of macular Haller’s layers was significantly associated with group 2 (OR −0.02, 95% CI −0.03 to 0) and group 3 (OR −0.03, 95% CI −0.05 to 0). The CVIs of subfoveal and macular Sattler’s layers and subfoveal Haller’s layers were not associated with either group (p>0.05).
We did a subanalysis comparing patients with diabetes with diabetes duration of ≤5 years and those >5 years of the disease. Patients with diabetes with a duration of diabetes of >5 years had a significantly decreased subfoveal choroidal volume (8.10±1.41 mm3 vs 8.99±1.57 mm3, p=0.02) and CVI of subfoveal Sattler’s layers (0.41±0.11 vs 0.47±0.01, p=0.04), compared with those with a duration of diabetes of 5 years or less. CT, CVI of macular Sattler’s layer and CVI of subfoveal and macular Haller’s layer were not significantly different between these two groups (p>0.05 for all) (table 4). HbA1c levels had no significant associations with the choroidal thickness or CVI (not shown).
Choroidal thickness and volume measurements and CVI comparing subjects segregated according to the duration of diabetes (N=75, excluding patients without diabetes)
Discussion
In the current study, we evaluated the CVI of Haller’s and Sattler’s layers at the subfoveal and entire macular region and their relationships with choroidal and RT and volumes across a spectrum of eyes (normal, diabetic eyes with no DR and eyes with DR). CT and choroidal volume were decreased in eyes with DR compared with those with no DR. Diabetic eyes with no DR have a lower macular CVI of Haller’s layer, but not Sattler’s layer, compared with that of healthy control eyes. There were no significant differences in choroidal and RT or volumes between these two groups. The CVI of subfoveal Haller’s layer is significantly associated with DR. Interestingly, patients with diabetes with a disease duration of more than 5 years had a decreased choroidal volume and subfoveal CVI of Sattler’s layer, but not CT or CVI of Haller’s layer, compared with patients with diabetes with a disease duration of fewer than 5 years. HbA1c levels were not associated with changes of CT, RT, or volumes or CVI.
We found a decrease in CT and choroidal volume in eyes with at least mild NPDR compared with eyes with no DR. The relationship between CT and volume and DR severity remains controversial in treatment-naïve eyes in the current literature. Earlier studies have proposed that CT is reduced in eyes with DR compared with eyes with no DR due to possible vascular sclerosis and connective tissue changes in the aging unhealthy choroid in type 2 diabetes.33 Also, type 2 diabetes is often accompanied by systemic pathologies such as hypertension or hypercholesterolemia, which have cumulative effects on the choroidal thickness and resultant choroidal thinning.19 20 On the contrary, Kim et al showed an increase in CT in eyes with mild NPDR before its decrease with worsening DR severity, but concluded that thickening of the choroid in the early stages of DR is likely due to stromal thickening and not contributed by the vascular component.34 Borrelli et al described the association between foveal choriocapillaris perfusion and choroidal structural OCT parameters (LA, SA and CVI) in healthy subjects as a reference for comparison of disease states.35 His findings suggested that while an initial expansion of the choroid is accompanied by an increase in choriocapillaris perfusion, a further increase in LA and SA values seems to be associated with a progressive reduction in choriocapillaris perfusion, explaining why initial choroidal thickening in early DR might eventually compromise choriocapillaris perfusion and lead to choroidal thinning.35 In our study, we did not manage to assess the CVI of the choriocapillaris, and future studies would be needed to confirm such a finding. Nonetheless, other inciting physiological and systemic factors affecting CT are likely to account for the discrepancies in the relationship between CT and DR.
What is novel in our study is that we found a differential decrease of macula CVI of Haller’s layer first between diabetic eyes with no DR compared with healthy eyes, but not of CVI of Sattler’s layer. Previously, Tan et al24 evaluated the CVI in patients with diabetes (both with and without DR) and showed reduced CVI values compared with controls. However, they analyzed a smaller group of 38 eyes. Gupta et al25 and Kim et al36 showed that CVI was significantly decreased in eyes with worsening DR and DME compared with controls. Our current study demonstrated that patients with diabetes with a disease duration of more than 5 years had a decreased subfoveal CVI of Sattler’s layer compared with those with shorter disease duration. From this, we cautiously speculate that a decrease in CVI of macular Haller’s layer precedes an actual decrease in CT in diabetic eyes before the onset of DR. To the best of our knowledge, this is the first study to suggest that in DC, choroidal vascularity is decreased, affecting Haller’s layer first as shown by the initial part of our results, followed by a decrease in CVI of Sattler’s layer after a longer duration of disease.
The sequential involvement of decreased vascularity of Haller’s layer followed by Sattler’s layer in the pathogenesis of DR needs to be further explored. Evidence of pre-DR choroidal microvasculature parameter disturbances in patients with diabetes have been reported.18 Choroidal blood flow deficit is an early pathological change in DR in an animal model,26 with a reduction in the size and density of choroidal vessels37 38 and an associated decrease in choroidal blood flow in diabetic eyes before DR manifestation.39 Choroidal abnormalities in diabetic eyes include microaneurysms, choriocapillaris obstruction, vascular remodelling with increased tortuosity, vascular dropout and areas of vascular non-perfusion.11 Ferrara et al40 demonstrated in a histological study a loss of intermediate and large blood vessels in the Sattler’s and Haller’s layer in diabetic eyes. Adhi et al41 showed that on SD-OCT, the mean subfoveal large and medium choroidal vessel layer thickness and subfoveal CT were significantly reduced in eyes with DR compared with controls. In a subgroup analysis of eyes with more severe DR such as in proliferative DR, subfoveal choriocapillaris thickness was further reduced compared with control eyes. Borrelli et al compared OCT angiography changes in healthy and NPDR eyes and found that both retinal and choroidal perfusions were affected in NPDR eyes. There was, however, a strong relationship between choriocapillaris perfusion and photoreceptor health measured by ellipzoid zone reflectivity in NPDR but not healthy eyes, implying that choriocapillaris perfusion was affected early on in diabetes even before retinal vessels’ changes manifested.42 Together with our study findings, these observations suggest that DC might preferentially affect larger choroidal veins (Haller’s layer) initially before medium-sized arterioles (Sattler’s layer) and smaller-sized choriocapillaris in the early pathogenesis of DC. Although no histological evidence has been documented in the literature on the exact temporal sequence of decreased choroidal vascularity of different choroidal layers in DR pathogenesis, we postulate that with time, the decrease in intermediate and large blood vessels in patients with diabetes would eventually lead to a decrease in CT.
The duration of the disease had an effect on CVI that is independent of HbA1c levels in diabetics. Endo et al showed similar findings to our study of decreased CVI in eyes with a longer duration compared with eyes with a shorter duration of diabetes.21 Also, there were no significant differences in RT or volume across all three groups of eyes, suggesting that the retinal layers are relatively preserved in the pathogenesis of DR at the early onset.
The strengths of our study include the inclusion of only treatment-naïve patients, and inclusion of AL in the adjustment of analyses for retinal and choroidal thickness and volumes. The main limitation is that our study is cross-sectional and we are unable to confirm the temporality of the results. The analysis of choroidal changes using CT may have some limitations due to various factors such as age, sex, diurnal variation, smoking, systolic blood pressure, and AL, which might affect CT. In these respects, the CVI of Haller’s layer might be a more stable and objective quantitative marker in diabetic eyes and a possible predictor for the onset of DR. Also, due to the small number of eyes with more severe DR, we were not able to observe the differences between these groups and propose further insights on the continuous changes of CVI and CT. Furthermore, we chose to evaluate the CVI only at the subfoveal and macular region instead of that beyond the posterior pole. We are also unable to evaluate the CVI of the choriocapillaris, which is not resolved enough in cross-sectional OCT.
In conclusion, we have established greater insight into the pathophysiology of DC by indirectly comparing changes of choroidal vascularity and thickness as the disease progresses from healthy to affected eyes with DR. CT and choroidal volume were decreased in eyes with DR compared with those without DR. Diabetic eyes with no DR have a lower macular CVI of Haller’s layer compared with that of healthy control eyes, although there were no significant differences in CT and RT or volumes between these two groups. The CVI of macula Haller’s layer is significantly associated with DR. With a longer duration of diabetes, the CVI of subfoveal Sattler’s layer and the choroidal volume are reduced, irrespective of the level of diabetic control, suggesting DC mainly affects larger choroidal veins initially before medium-sized arterioles in the early pathogenesis of DC. The CVI of macular Haller’s layer could potentially be used as a marker for onset of DR in newly diagnosed patients on SD-OCT imaging. Future prospective longitudinal studies in diabetic eyes would be useful in establishing the relationship between CVIs of Haller’s and Sattler’s layers with visual acuity as a marker of photoreceptor health and visual prognosis.
References
Footnotes
Contributors VHXF, PG, RA, C-YC and YY helped to conceptualize and design the study. QDN and CCYC contributed to the statistical analysis and discussion of the manuscript. VHXF, PG, RA, C-YC and YY analyzed, interpreted the data, and wrote the manuscript. YY is the guarantor of this work and, as such, had full access to all the data in the study and takes responsibility for the integrity of the data and the accuracy of the data analysis.
Funding This project was supported by TAAP (NMRC/OFLCG/004/2018).
Competing interests None declared.
Patient consent for publication Not required.
Ethics approval The research adhered to the tenets of the Declaration of Helsinki and ethics approval was obtained (Singhealth Centralised Institutional Review Board approval number R1107/9/2014) from the institutional review board of Singhealth and Singapore Eye Research Institute.
Provenance and peer review Not commissioned; externally peer reviewed.
Data availability statement Data are available upon reasonable request. YY is the guarantor of this work and, as such, had full access to all the data in the study and takes responsibility for the integrity of the data and the accuracy of the data analysis. He can be contacted at yasuo.yanagi@snec.com.sg.