Article Text

Abstract
Introduction Treatment using sodium-glucose cotransporter (SGLT) 2 inhibitor and low-carbohydrate diet (LCD) for obesity and type 2 diabetes are similar in terms of carbohydrate limitation. However, their mechanisms of action differ, and the effects on the body remain unclear. We investigated the effects of SGLT2 inhibitor and LCD on body composition and metabolic profile using the db/db mouse model for obesity and type 2 diabetes.
Research design and methods Eight-week-old male db/db mice were divided into four groups: mice receiving normal diet and vehicle or canagliflozin (Cana) administration and mice receiving LCD and vehicle or Cana administration for 8 weeks. Consumed calories were adjusted to be equal among the groups.
Results Both Cana administration and LCD feeding resulted in significant weight gain. Cana administration significantly decreased plasma glucose levels and increased plasma insulin levels with preservation of pancreatic β cells. However, LCD feeding did not improve plasma glucose levels but deteriorated insulin sensitivity. LCD feeding significantly reduced liver weight and hepatic triglyceride content; these effects were not observed with Cana administration. Combined treatment with LCD did not lead to an additive increase in blood β-ketone levels.
Conclusions SGLT2 inhibitors and LCD exert differential effects on the body. Their combined use may achieve better metabolic improvements in obesity and type 2 diabetes.
- sodium glucose cotransporter
- insulin secretion
- fatty liver
- carbohydrates
This is an open access article distributed in accordance with the Creative Commons Attribution Non Commercial (CC BY-NC 4.0) license, which permits others to distribute, remix, adapt, build upon this work non-commercially, and license their derivative works on different terms, provided the original work is properly cited, appropriate credit is given, any changes made indicated, and the use is non-commercial. See: http://creativecommons.org/licenses/by-nc/4.0/.
Statistics from Altmetric.com
Significance of this study
What is already known about this subject?
Although treatment using sodium-glucose cotransporter 2 (SGLT2) inhibitor and low-carbohydrate diet (LCD) for obesity and type 2 diabetes are similar in that both limit carbohydrates in the body, their mechanisms of action differ.
Few studies have examined the differences between SGLT2 inhibitor and LCD as a treatment for obesity and type 2 diabetes.
What are the new findings?
Treatment with SGLT2 inhibitor strongly ameliorated glucose metabolism with preservation of pancreatic β cells, while LCD improved fatty liver.
Although treatment with SGLT2 inhibitor and LCD increased blood β-ketone levels, their combined used did not lead to an additive increase in blood β-ketone levels.
How might these results change the focus of research or clinical practice?
Treatment with SGLT2 inhibitor and LCD had differential effects on body composition and metabolic profile.
Combined use of the two treatments may lead to better metabolic improvement in the treatment of obesity and type 2 diabetes.
INTRODUCTION
The effectiveness of the use of sodium-glucose cotransporter (SGLT) 2 inhibitor and a low-carbohydrate diet (LCD) in the treatment of obesity and type 2 diabetes has recently attracted attention worldwide.
SGLT2 inhibitors inhibit glucose reabsorption in the kidney and lower blood glucose in an insulin-independent manner. They have recently been shown to have pleiotropic effects, such as the reduction of body weight, blood pressure, glomerular hyperfiltration, and serum uric acid levels,1 resulting in cardioprotective and renal-protective effects, as reported in the Empagliflozin cardiovascular outcome event (EMPA–REG OUTCOME) Trial,2 3 Canagliflozin cardiovascular assessment study (CANVAS) Program,4 Comparative effectiveness of cardiovascular outcomes in new users of sodium-glucose cotransporter-2 inhibitors (CVD-REAL) Study,5 Canagliflozin and renal events in diabetes with established nephropathy clinical evaluation (CREDENCE) Trial,6 and dapagliflozin effect on cardiovascular events (DECLARE-TIMI 58) Trial.7 Moreover, we have reported that treatment with SGLT2 inhibitor maintained skeletal muscle mass, with a reduction in serum myostatin levels.8
LCD has been shown to reduce body weight, comparable with the effects observed with a low-fat diet according to the Dietary Intervention Randomized Controlled Trial9 and a meta-analysis of named diet programs.10 In addition to body weight reduction, LCD reportedly improves cardiovascular risk factors such as systolic/diastolic blood pressure as well as plasma levels of glucose, insulin, triglyceride (TG), high-density lipoprotein, and C reactive protein.11 Furthermore, vegetable-based LCD is associated with lower all-cause and cardiovascular disease mortality.12 13
Although treatment using SGLT2 inhibitor and LCD for obesity and type 2 diabetes are similar in that both limit carbohydrates in the body, their mechanisms of action differ. Few studies have examined the differences between SGLT2 inhibitor and LCD as a treatment for obesity and type 2 diabetes.14 Furthermore, there are safety concerns that the combined use of SGLT2 inhibitor and LCD may further increase levels of ketone bodies because this effect has been reported for both treatments.15 16
The present study investigated the effects of SGLT2 inhibitor and LCD on body composition and metabolic profile using the db/db mouse model of obesity and type 2 diabetes.
Research design and methods
Animals and experimental design
Six-week-old male db/db mice were purchased from CLEA Japan (Tokyo, Japan). Mice were individually caged and kept at a constant room temperature of 23°C±1°C under a 12 hours/12 hours light dark cycle (lights on at 07:00) with free access to water. Mice were fed either normal diet (ND) (D10001, 3.9 kcal/g, Research Diets, New Brunswick, New Jersey, USA) or LCD (D14012301, 4.7 kcal/g, Research Diets) and treated with either vehicle (0.5% hydroxypropyl methylcellulose (Wako, Osaka, Japan)) or canagliflozin (Cana) (equivalent to 30 mg/kg body weight). Cana was provided by Mitsubishi Tanabe Pharma (Osaka, Japan). Mice were randomly divided into four groups as follows: ND group, fed ND and administered with vehicle; ND+Cana group, fed ND and administered with Cana; LCD group, fed LCD and administered with vehicle; and LCD+Cana group, fed LCD and administered with Cana. The formulas for the experimental diets used in this study are shown in online supplementary table 1. Vehicle and Cana were administered by oral gavage once daily. All animal care and animal experiments were conducted in accordance with the institutional guidelines.
Supplemental material
Ad libitum food intake
Six-week-old male db/db mice were fed either ND or LCD and administered with either vehicle or Cana. Food intake was measured for 4 days under ad libitum conditions and the average calorie intake was calculated for each group.
Pair-feeding experiments
Pair-feeding experiments were performed to exclude the influence of calorie intake. Pair-fed mice in the ND+Cana, LCD, and LCD+Cana groups were fed the same amount of calories as consumed by mice in the ND group on the previous day. Pair-feeding experiments began at 8 weeks of age and continued for 8 weeks.
Body weight
The body weights of the mice in each group were measured between 14:00 and 16:00 every week for 8 weeks.
Rectal temperature
Rectal temperature was measured using a thermometer (Physitemp BAT7001H, Fisher scientific, Clifton, New Jersey, USA) on week 6 after the start of the experiment.
Biochemical analysis
During the experimental period, blood was obtained from the tail vein to measure plasma glucose levels between 14:00 and 16:00 every week. At the end of the experiment, blood was obtained from the inferior vena cava between 14:00 and 16:00. Plasma levels of glucose, insulin, TG, total cholesterol, and non-esterified fatty acid (NEFA) were measured using a standard enzymatic assay or commercially available ELISA kits (Glucose CII-test (Wako Pure Chemical Industries, Osaka, Japan); Morinaga Ultra Sensitive Mouse Insulin ELISA kit (Morinaga Institute of Biological Science, Kanagawa, Japan); TG E-test (Wako Pure Chemical Industries); Cholesterol E-test (Wako Pure Chemical Industries); NEFA C-test (Wako Pure Chemical Industries)) according to the manufacturer’s instructions. Blood β-ketone levels were measured using the FreeStyle Precision Neo meter with FreeStyle Precision Blood β-Ketone Test Strips (Abbott Japan, Tokyo, Japan).
Intraperitoneal glucose tolerance test
Intraperitoneal glucose tolerance tests (IPGTTs) were performed at week 6 after the start of the experiment. After an overnight fast, mice were intraperitoneally injected with glucose (1.0 g/kg). Blood samples were collected from the tail vein at 0, 30, 60, 90, and 120 min after glucose injection. Plasma levels of glucose and insulin were measured using the commercially available kits described above. Secreted insulin levels per plasma glucose level during the IPGTT were calculated by dividing the area under the curve (AUC) of insulin levels by the AUC of glucose levels from 0 min to 120 min (AUCIns/AUCGlu). Homeostasis model assessment (HOMA) of insulin resistance was calculated as (fasting plasma glucose (mg/dL)×fasting plasma insulin (ng/mL)) to assess insulin resistance.17
Liver and skeletal muscle TG content
Mouse liver and tibialis anterior muscle were isolated at the end of the experiment, immediately frozen in liquid nitrogen, and lipids extracted using 1:1 isopropyl alcohol/heptane (v/v). After evaporating the solvent, lipids were resuspended in 99.5% ethanol, and TG content was measured using the TG E-test Wako kit (Wako Pure Chemical Industries).
Liver and pancreas histology
Mouse liver and pancreas were sampled at the end of the experiment and immediately fixed in 10% neutral buffered formalin. After fixing, the organs were routinely dehydrated using a graded series of ethanol concentrations, embedded in paraffin, sectioned, stained, and examined microscopically. Liver sections were stained with H&E. For immunohistochemical staining for insulin, pancreas sections were incubated with guinea pig polyclonal antiporcine insulin antibody (Dako, Carpinteria, California, USA). Immunolocalization was demonstrated using the EnVision+system (antirabbit horseradish peroxidase (HRP)-labeled polymer) (Dako) and diaminobenzidine (DAB)+substrate kit (Dako). Samples were examined by light microscopy.
RNA extraction and quantitative real-time PCR
Total RNA was extracted from the liver and epididymal white adipose tissue (WAT) using TRIzol (Life Technologies, Carlsbad, California, USA) according to the manufacturer’s instructions. Total RNA (1.0 µg) was reverse transcribed using an iScriptTMcDNA synthesis kit (Bio-Rad Laboratories, Hercules, California, USA). Quantitative real-time PCR was performed with the StepOnePlus real-time PCR system using TaqMan (Applied Biosystems, Foster City, California, USA). Relative amounts of mRNAs were normalized using ribosomal 18 s RNA. The sets of primers and probes used are listed in online supplementary table 2.
Statistical analyses
Data were expressed as mean±SEM. Comparisons were made using one-way analysis of variance (ANOVA) followed by the Tukey-Kramer test. Statistical analysis of changes in body weight, plasma glucose levels, and plasma insulin levels during the IPGTT were performed using two-way ANOVA with repeated measurement followed by the Tukey-Kramer test. Values of p<0.05 were considered statistically significant.
Results
Effect of SGLT2 inhibitor and LCD on body weight
The daily calorie intake of the four groups (ND, ND+Cana, LCD, and LCD+Cana) was measured under ad libitum feeding conditions. The LCD and LCD+Cana groups showed a significant increase in daily calorie intake (figure 1A).
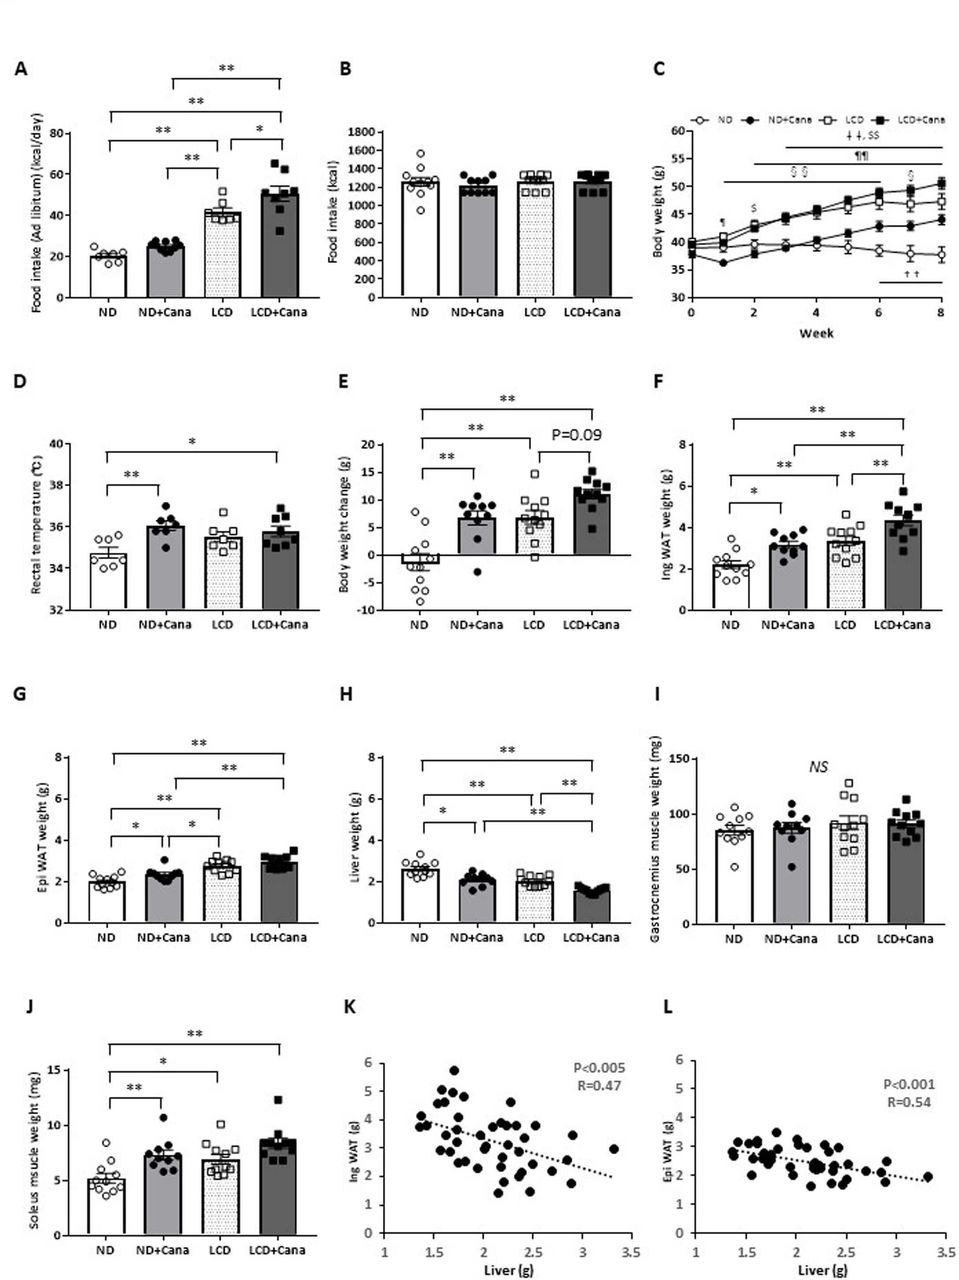
Effect of SGLT2 inhibitor and LCD on body weight and body composition of db/db mice under pair-fed conditions Six-week-old male db/db mice were fed either ND or LCD and treated with vehicle or Cana for 4 days. (A) Ad libitum food intake was measured for 4 days in each group and mean daily calorie consumption was calculated (n=7–10 per group). Data were generated from two independent experiments. Eight-week-old male db/db mice were fed either ND or LCD and treated with vehicle or Cana for 8 weeks. All mice were fed the same amount of calories as the mice in the ND group. Data were generated from two or three independent experiments. (B) Cumulative calorie of food intake during the experimental period (n=10–11 per group). (C) Time course of body weight during the experimental period (n=10–11 per group). (D) Rectal temperature at week 6 after the start of the experiment (n=7–8 per group). (E) Change in body weight at the end of the experimental period compared with that at the beginning. Tissue weight of (F) inguinal WAT, (G) epididymal WAT, (H) liver, (I) soleus muscle, and (J) gastrocnemius muscle at the end of the experimental period (n=10–11 per group). (K, L) correlation between inguinal WAT and epididymal WAT weights and liver weight (n=43). *p<0.05; **p<0.01. ††p<0.01, ND vs ND+Cana; ‡‡p<0.01, ND vs LCD+Cana; §p<0.05, LCD vs ND+Cana; §§p<0.01, LCD vs ND+Cana; $p<0.05, ND vs LCD; $$p<0.01, ND vs LCD; ¶p<0.05, ND+Cana vs LCD+Cana; ¶¶p<0.01, ND+Cana vs LCD+Cana. Cana, canagliflozin; LCD, low-carbohydratediet; ND, normal diet; NS, not significant; SGLT2, sodium-glucose cotransporter 2; WAT, white adipose tissue.
Pair-feeding was performed to exclude the influence of increased calorie intake on body composition and metabolic profile. While there was no difference in calorie intake among the four groups (figure 1B), LCD feeding led to a significant increase in body weight of db/db mice from the first week (figure 1C). Cana administration increased the body weights of db/db mice under both ND and LCD feeding. Rectal temperature, which reflects energy consumption,18 was significantly increased in the ND+Cana and LCD+Cana groups compared with that of the ND group (figure 1D).
Effect of SGLT2 inhibitor and LCD on body composition
Organ weights of db/db mice in each group were compared to identify the tissues contributing to body weight changes (figure 1E). LCD feeding significantly increased the weight of inguinal and epididymal WAT, and Cana administration further increased the weight of inguinal WAT (figure 1F,G). On the contrary, LCD feeding significantly reduced liver weight, and was further reduced by administration of Cana (figure 1H). Despite no obvious change in the weight of gastrocnemius muscle, which is composed of white and red muscle (figure 1I), both Cana administration and LCD feeding significantly increased the weight of soleus muscle, which is composed predominantly of red muscle, compared with the weight observed in the ND group (figure 1J).
Interestingly, there was a significant negative correlation between inguinal/epididymal WAT weight and liver weight (figure 1K,L).
Effect of SGLT2 inhibitor and LCD on glucose metabolism
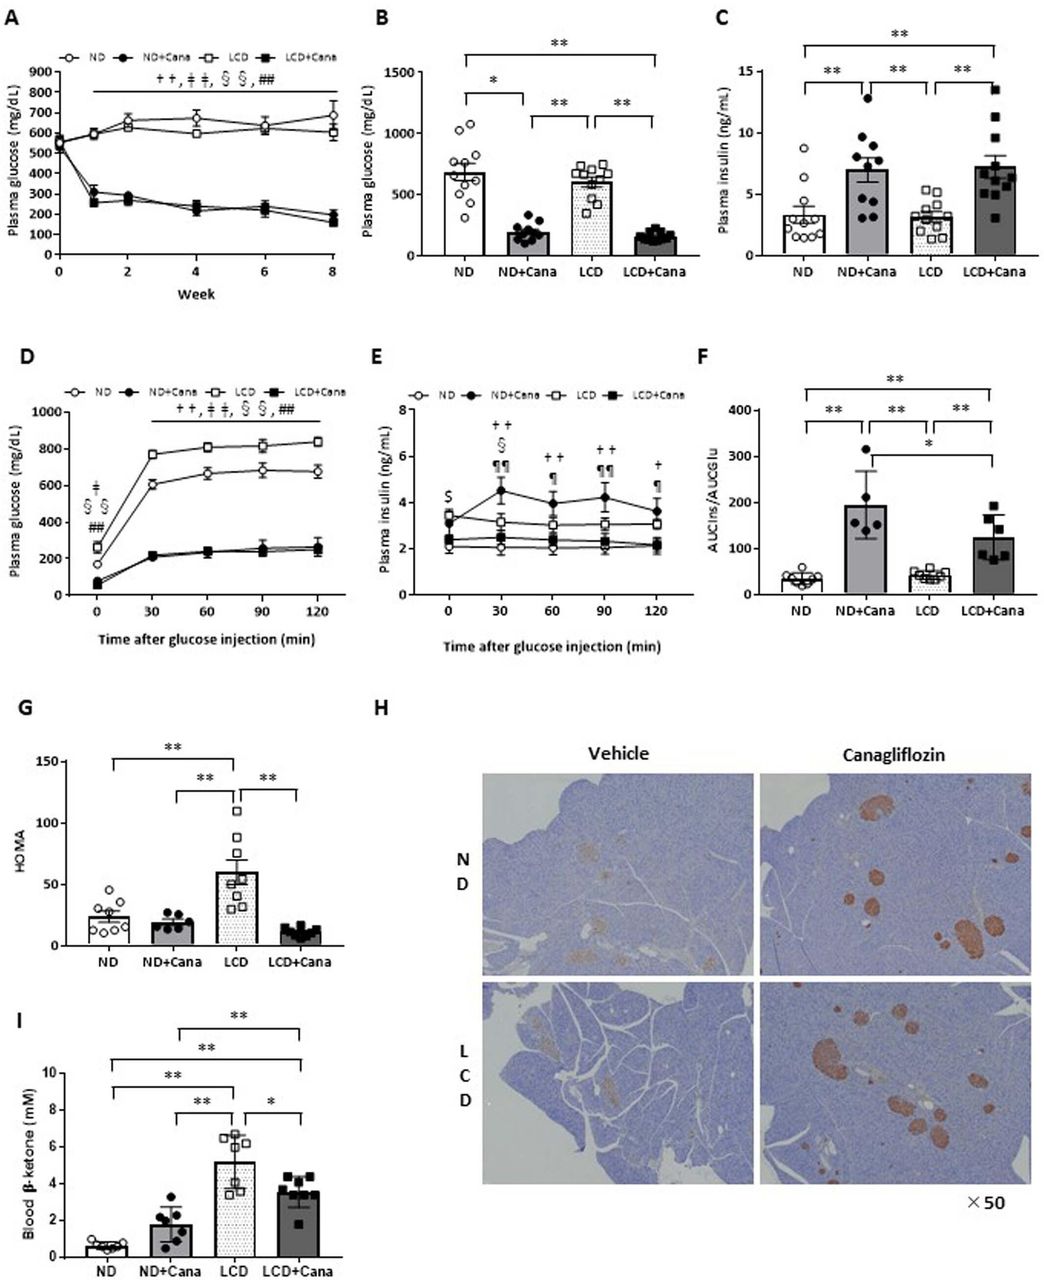
Under both ND and LCD feeding conditions, Cana administration significantly decreased the plasma glucose levels of db/db mice from the first week, and was maintained for 8 weeks (figure 2A). At the end of the experimental period, Cana administration significantly decreased plasma glucose levels, and conversely increased plasma insulin levels under both ND and LCD feeding conditions (figure 2B,C).

Effect of SGLT2 inhibitor and LCD on glucose metabolism of db/db mice under pair-fed conditions. Eight-week-old male db/db mice were fed either ND or LCD and treated with vehicle or Cana for 8 weeks. All mice were fed the same amount of calories as the mice in the ND group. Data were generated from two or three independent experiments. (A) Ad libitum plasma glucose levels during the experiment (n=10–11 per group). Ad libitum plasma glucose levels (B) and plasma insulin levels (C) at the end of the experimental period (n=10–11 per group), plasma glucose levels (D), plasma insulin levels (E), AUCIns/AUCGlu values (F), and HOMA (G) during IPGTT (n=5 per group). (H) Representative images of the pancreas with staining for insulin (×50 magnification). (I) Blood β-ketone levels at the end of the experimental period (n=10–11 per group). *p<0.05; **p<0.01; †p<0.05, ND vs ND+Cana; ††p<0.01, ND vs ND +Cana; ‡p<0.05, ND vs LCD+Cana; ‡‡p<0.01, ND vs LCD+Cana; §p<0.05 LCD vs ND+Cana; §§p<0.01 LCD vs ND+Cana; ##p<0.01, LCD vs LCD+Cana; $p<0.05, ND vs LCD; ¶p<0.05, ND+Cana vs LCD+Cana; ¶¶p<0.01, ND+Cana vs LCD+Cana. Cana, canagliflozin; HOMA, homeostasis model assessment; IPGTT, intraperitoneal glucose tolerance test; LCD, low-carbohydratediet; ND, normal diet; SGLT2, sodium-glucose cotransporter 2.
IPGTTs were performed to investigate the effects of SGLT2 inhibitor and LCD feedinrg on glucose metabolism in detail. Under both ND and LCD feeding conditions, Cana administration significantly improved glucose tolerance (figure 2D). We simultaneously measured plasma insulin levels (figure 2E) and found that Cana administration increased secreted insulin levels per blood glucose levels under both ND and LCD feeding during IPGTT (figure 2F). Histological examination revealed that Cana treatment led to intense staining of insulin in the pancreatic β cells under both ND and LCD feeding conditions (figure 2H). On the other hand, LCD feeding significantly exacerbated insulin sensitivity, whereas Cana administration significantly improved insulin sensitivity under LCD feeding conditions (figure 2G).
Effect of SGLT2 inhibitor and LCD on blood β-ketone levels
LCD feeding significantly increased blood β-ketone levels; however, this was not seen with LCD feeding plus Cana administration (figure 2I). On the contrary, Cana administration significantly reduced blood β-ketone levels under LCD feeding (5.2±0.5 vs 3.6±0.3 mM in the LCD and LCD+Cana groups, respectively; p<0.05).
Effect of SGLT2 inhibitor and LCD on liver lipid accumulation
Compared with wild type mice, db/db mice exhibit an increased liver TG content, known as fatty liver.19 LCD feeding decreased the liver weights of db/db mice (figure 1H), and histological analysis revealed that LCD feeding improved fatty liver (figure 3B). We measured liver TG content and found that LCD feeding significantly decreased liver TG content of db/db mice compared with that of the ND feeding groups (ND and ND+Cana groups) (figure 3A). On the other hand, Cana administration did not affect liver TG content. Furthermore, muscular TG content was not affected by Cana administration or LCD feeding (figure 3C).
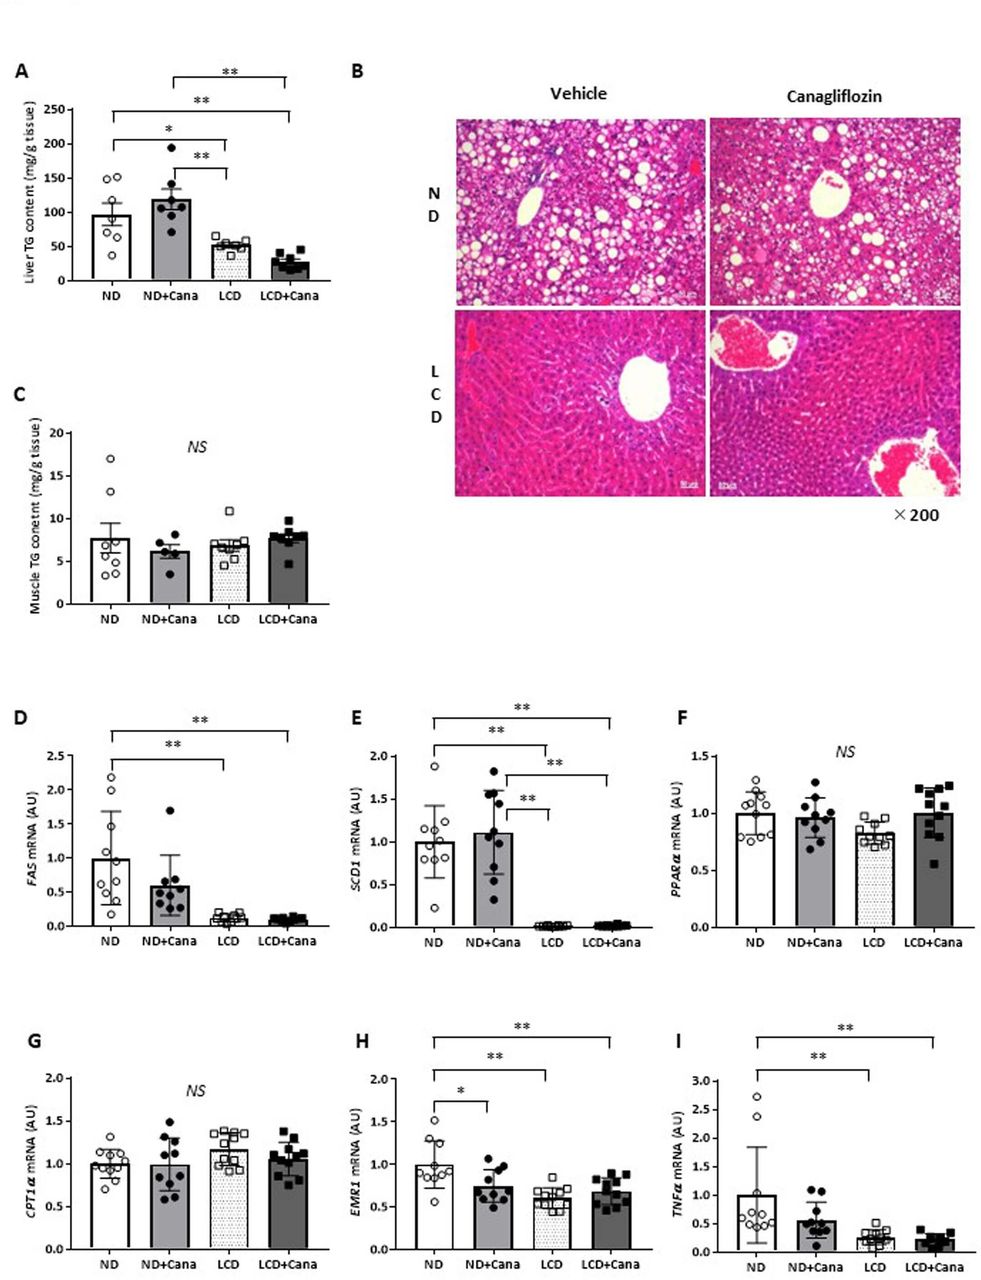
Effect of SGLT2 inhibitor and LCD on fatty liver in db/db mice under pair-fed conditions. (A) Liver triglyceride content, (B) representative images of the liver with H&E staining (×200 magnification), (C) skeletal muscle triglyceride content, and liver gene expression of (D) FAS, (E) SCD1, (F) PPARα, (G) CPT1α, (H) EMR1, and (I) TNFα in each group. Values represent mean±SEM (n=10–11 per group). *p<0.05; **p<0.01. Cana, canagliflozin; CPT1α, carnitine palmitoyltransferase 1 alpha; EMR1, EGF-like module-containing mucin-like hormone receptor-like 1; FAS, fatty acid synthase; LCD, low-carbohydratediet; ND, normal diet; NS, not significant; PPARα, peroxisome proliferator-activated receptor alpha; SCD1, stearoyl-CoA desaturase 1; SGLT2, sodium-glucose cotransporter 2; TG, triglyceride; TNFα, tumor necrosis factor alpha.
Next, we measured gene expression in the liver. LCD feeding decreased expression of the lipid synthesis-related genes, fatty acid synthase (FAS) and stearoyl-CoA desaturase 1 (SCD1), compared with that of the ND group (figure 3D,E), but did not affect expression of the fatty acid oxidation-related genes, peroxisome proliferator-activated receptor alpha, and carnitine palmitoyltransferase 1 alpha (figure 3F,G). In addition, LCD feeding also decreased expression of the inflammation-related genes, EGF-like module-containing mucin-like hormone receptor-like 1 (EMR1) and tumor necrosis factor alpha, compared with that of the ND group (figure 3H,I). On the other hand, Cana administration significantly reduced EMR1 expression under ND feeding (figure 3H), but did not affect expression of genes involved in lipid synthesis or fatty acid oxidation (figure 3D–G).
Effect of SGLT2 inhibitor and LCD on plasma lipid profiles
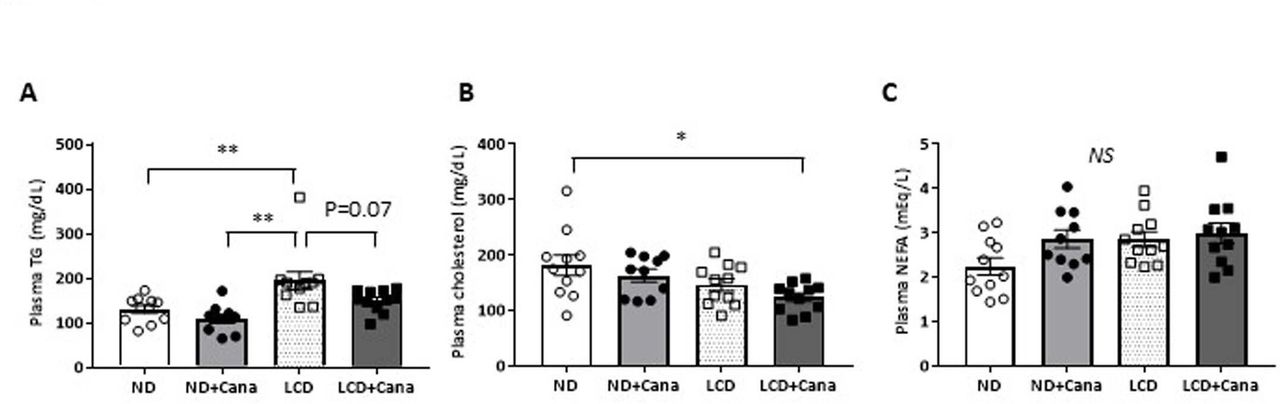
While LCD feeding significantly increased plasma TG levels, Cana administration tended to decrease TG levels under LCD feeding conditions (195±20 vs 151±7 mg/dL in the LCD and LCD+Cana groups, respectively; p=0.07) (figure 4A). In addition, both Cana administration and LCD feeding tended to decrease plasma total cholesterol levels, and combined treatment with Cana and LCD feeding significantly decreased plasma total cholesterol levels compared with that in the ND group (182±18 vs 124±8 mg/dL in the additive increase ND and LCD+Cana group, respectively; p<0.05) (figure 4B). On the other hand, plasma NEFA levels were not affected by Cana administration or LCD feeding (figure 4C).

Effect of SGLT2 inhibitor and LCD on plasma lipid profiles in db/db mice under pair-fed conditions (A) plasma triglycerides levels, (B) plasma cholesterol levels, and (C) plasma non-esterified fatty acids levels at the end of the experimental period in each group. values represent mean±SEM (n=10–11). *p<0.05; **p<0.01. Cana, canagliflozin; LCD, low-carbohydratediet; ND, normal diet; NEFA, non-esterified fatty acid; NS, not significant; SGLT2, sodium-glucose cotransporter 2; TG, triglyceride.
Discussion
Few studies have reported the differences between the use of SGLT2 inhibitor and LCD as a treatment for obesity and type 2 diabetes. The present study investigated the effects of SGLT2 inhibitor and LCD on body composition and metabolic profile using the db/db mouse model mouse of obesity and type 2 diabetes. The amount of calories consumed was adjusted to be equal for all groups to exclude the effects of calorie intake. Contrary to the results from human studies, both SGLT2 inhibitor and LCD feeding increased body weight in the db/db mouse model. However, treatment with SGLT2 inhibitor strongly improved glucose metabolism regardless of the type of diet, and also showed a protective effect on the pancreas. On the other hand, LCD feeding did not improve blood glucose levels, but deteriorated insulin sensitivity. However, LCD feeding was shown to significantly improve fatty liver. Although treatment with SGLT2 inhibitor and LCD increased blood β-ketone levels, their combined use did not lead to an additive increase in blood β-ketone levels. Taken together, combined use of SGLT2 inhibitor and LCD may achieve better metabolic improvement in the treatment of obesity and type 2 diabetes.
SGLT2 administration and LCD intake were previously reported to increase calorie intake in mice.20–22 In the present study, both Cana administration and LCD feeding significantly increased the calorie intake of db/db mice (figure 1A). It is considered difficult to strictly control calorie intake and evaluate the effects of therapeutic agents or dietary components in observational studies, although patients with obesity and type 2 diabetes have received dietary instructions in daily clinical practice. Therefore, in order to examine the precise effects of Cana administration and LCD feeding on body composition and metabolic profile, the calorie intake was adjusted to be equal among the four groups. We believe that a pair feeding experiment using animal disease models is a significant and useful method especially in the metabolic research such as obesity and diabetes. Interestingly, Cana administration and LCD feeding significantly increased body weight, despite comparable calorie intake (figure 1C), which differs from the results observed in humans. However, studies using experimental mice have reported that the administration of SGLT2 inhibitor and LCD feeding increased adipose tissue weight.20–22 Results may vary depending on species, dosage and duration of SGLT2 treatment, and diet (proportion of carbohydrates, proteins, and lipids). Therefore, careful interpretation is necessary. Weight gain has been attributed to increased calorie intake. In this regard, Cana administration and LCD feeding may further increase body weight along with the increase in calorie intake under ad libitum feeding, and the effective improvement of SGLT2 and LCD may be maintained but diminished because of obesity. However, the present study showed that differences in weight gain were independent of calorie intake. It was reported that the gut microbiota changes in response to SGLT2 inhibitor administration and LCD intake.23 24 Further studies are required in the future to determine whether changes in the gut microbiota affect body weight.
LCD feeding showed no apparent effect on rectal temperature, whereas Cana administration tended to increase rectal temperature irrespective of diet type (figure 1D). However, the increase in rectal temperature observed with Cana administration could not explain the change in body weight seen in db/db mice (figure 1C). Increased energy expenditure and reduced respiratory quotient and AMP-activated protein kinase (AMPK) activation in the liver have been reported in SGLT2 knockout mice or Cana-administered mice.25 26 In addition, Xu et al reported that the administration of SGLT2 inhibitor significantly increased rectal temperature and energy expenditure associated with uncoupling protein 1 (UCP1) induction in brown adipose tissue (BAT) and AMPK activation in the skeletal muscle.18 Therefore, we examined the amount of UCP1 protein in BAT and the AMPK activity in soleus muscle using the remaining samples. The amount of UCP1 protein in BAT was significantly increased by Cana administration but not by LCD feeding (online supplementary figure 1). Furthermore, the AMPK activity in soleus muscle tended to be increased by both Cana administration and LCD feeding, and significantly increased by theie combination (online supplementary figure 2). Based on the given data, it was suggested that the increase in rectal temperature resulted from the UCP1 induction in BAT and the AMPK activation in the skeletal muscle.
Supplemental material
Supplemental material
LCD was expected to lower plasma glucose levels;27 28 however, this was not observed in the present study. On the other hand, SGLT2 inhibitor has been reported to have protective effects in the pancreas.25 29–31 In the present study, Cana administration increased secreted insulin per blood glucose levels during IPGTT (figure 2F). Furthermore, insulin was stained intensely in pancreatic β cells in response to treatment with Cana under both ND and LCD feeding conditions (figure 2H), which was consistent with previous reports. It is possible that the reduction of insulin requirements via the improvement of hyperglycemia in an insulin-independent manner led to the protection of pancreatic β cells. Further studies are needed in the future to investigate this.
Cana administration tended to increase blood β-ketone levels under ND feeding conditions. Furthermore, LCD feeding significantly increased blood β-ketone levels (figure 2I). However, Cana administration significantly reduced blood β-ketone under LCD feeding conditions (figure 2I), indicating that SGLT2 inhibitor does not always increase blood β-ketone levels. Ketone body levels are assumed to increase in response to absolute or relative insulin deficiency,16 32 and the preserved insulin secretion seen in db/db mice may suppress a further increase in ketone bodies.
In the present study, LCD feeding improved fatty liver (figure 3A,B). It was reported that LCD intake may improve fatty liver in clinical studies,33 34 although the mechanisms involved remain unclear. Our findings showed that LCD feeding did not affect fatty acid oxidation, but suppressed lipid synthesis (figure 3D–G), which was consistent with a previous report.19 On the other hand, it was reported that SGLT2 inhibitor improves fatty liver,20 30 but this was not shown in this study. The reason for this discrepancy could be due to the dose or duration of SGLT2 inhibitor administration.
LCD feeding influenced insulin resistance as shown by the increase in HOMA (figure 2G). Possible mechanisms of insulin resistance in obesity and diabetes include chronic inflammation in the adipose tissue, ectopic fat accumulation in the liver and skeletal muscle, hyperglycemia, and hypertriglyceridemia.35 In this model, hyperglycemia (figure 2B,D) and hypertriglyceridemia (figure 4A) were considered to have caused insulin resistance induced by LCD feeding. In contrast, ectopic fat accumulation (figure 3A,B) and inflammation in adipose tissue (online supplementary figure 3) were not considered significant. Further study is needed to elucidate the mechanism by which LCD feeding induces insulin resistance. In addition, Cana administration decreased HOMA under LCD feeding (figure 2G). Xu et al reported that SGLT2 inhibitor improves insulin resistance assessed by the insulin tolerance test (ITT) method in diet-induced obese (DIO) mice.18 Moreover, it is reported that SGLT2 knockout mice have enhanced insulin sensitivity assessed by the glucose clamp method.25 These reports are consistent with our data.
In the present study, both Cana administration and LCD feeding increased the body weight of db/db mice (figure 1C,E), and the increase was mainly explained by the increase in weight of the WAT (figure 1F,G). In general, insulin signaling has a crucial role in the control of WAT development.36 Komiya et al reported that administration of SGLT2 inhibitor improved inflammation and insulin resistance in WAT and it increased adipose tissue volume in DIO mice.20 Therefore, we examined the expression of inflammation-related genes in epididymal WAT. Cana administration significantly improved insulin resistance in the LCD group (figure 2G) and reduced the expression of inflammation-related genes in epididymal WAT, although there was no significant difference (online supplementary figure 3). On the contrary, it has been reported that fat intake tends to increase body weight when compared with other dietary components with the same calories.37 38 The components of LCD used in this study had increased lipid mainly from lard (online supplementary table 1). Despite an unknown mechanism, compensatory hyperinsulinemia due to insulin resistance may continue to stimulate insulin signal. Furthermore, we also examined the size of the adipose tissue and found that neither Cana administration nor LCD feeding affected the adipocyte size in the epididymal WAT (online supplementary figure 4A,B). These results were consistent with Komiya's report.20 Interestingly, there was a negative correlation between inguinal/epididymal WAT and liver weight (figure 1K,L), which was consistent with the findings of a previous study.20 These results were obtained with using Cana as well as ipragliflozin, suggesting that the effect of transferring lipids from liver to adipose tissue may be a class effect of SGLT2 inhibitor. A previous clinical study reported that SGLT2 inhibitors improved fatty liver, similar to thiazolidinediones.39
Although LCD feeding decreased the expression of lipid synthesis-related genes, FAS, and SCD1 compared with that of the ND group (figure 3D,E), it increased plasma TG levels at ad libitum feeding (figure 4A). In general, plasma TG levels are controlled by the balance of TG synthesis in the liver, dietary TG uptake, and systemic TG consumption.40 In the present study, since there was no significant change in the AMPK activation in soleus muscle in the LCD group (online supplementary figure 2), it was unlikely that TG consumption was affected by fatty acid β-oxidation. Thereafter, we considered the possibility that LCD feeding with a lot of lard had influenced plasma TG levels at the ad libitum feeding. In the present study, lipids were mainly comprised of lard (online supplementary table 1), which may have increased plasma TG levels. To exclude the increase in plasma TG levels by diet at the ad libitum feeding, we evaluated fasting plasma TG levels in each group. Fasting plasma TG levels were not increased in the LCD group compared with the ND group (online supplementary figure 5). Taken together, LCD feeding with a lot of lard might have increased plasma TG levels at the ad libitum feeding. Olive oil as part of a Mediterranean diet, fish oil, or medium-chain fatty acids are reported to improve metabolic abnormalities.41–43 Future studies should consider the type of lipids consumed.
Use of SGLT2 inhibitor may reduce skeletal muscle mass and increase the development of sarcopenia. On the other hand, intake of a large amount of protein has been reported to increase muscle mass. In the present study, Cana administration and LCD feeding led to increased red muscle mass (figure 1I). Hyperglycemia and insulin resistance have been reported to be mechanisms of muscle atrophy in obesity and type 2 diabetes.44 In the present study, it is possible that the improvements in blood glucose levels and insulin resistance in response to treatment with SGLT2 inhibitor and LCD feeding may have led to the observed increase in skeletal muscle mass. Differences in the effects of SGLT2 inhibitor and LCD on white and red muscles remain to be elucidated.
In conclusion, we demonstrated that treatment with SGLT2 inhibitor and LCD had differential effects on body composition and metabolic profile. Treatment with SGLT2 inhibitor strongly ameliorated glucose metabolism with preservation of pancreatic β cells, while LCD improved fatty liver. Combined use of SGLT2 inhibitor and LCD showed no additive increase in ketone body levels. Taken together, combined use of the two treatments may lead to better metabolic improvement in the treatment of obesity and type 2 diabetes.
Supplemental material
Acknowledgments
The authors thank Hiromi Kusakabe for their secretarial assistance in Clinical Research Institute, National Hospital Organization Kyoto Medical Center, and Enago (www.enago.jp) for the English language review.
References
Footnotes
TK and SY contributed equally.
Contributors TK analyzed the data, contributed to the interpretation of findings, and wrote, reviewed, and edited the manuscript. SY, MS, TI, MT, RO-K, and KM analyzed the data, contributed to the interpretation of findings, and reviewed the manuscript. HY, HW, KH, and NS-A contributed to the interpretation of findings and reviewed the manuscript. All authors have read and approved the final version of the manuscript. TK is the guarantor of this work and, as such, had full access to all the data in the study and takes responsibility for the integrity of the data and the accuracy of the data analysis.
Funding This work was supported in part by Grant-in-Aid for Scientific Research (C) to TK (JSPS KAKENHI Grant Number JP17K09827), TI (JP19K11760), MT (JP19K07927), HY (JP19K07905), and (B) to NS-A (JP18H02737), and by Grant-in-Aid for Exploratory Research to NS-A (JP18K19769), from Japan Society for the Promotion of Science. This study was also supported in part by a grant from Smoking Research Foundation to NS-A (2019T004). The funders played no role in the study design, data collection and analysis, decision to publish, or preparation of the manuscript.
Competing interests None declared.
Patient consent for publication Not required.
Ethics approval All animal care and animal experiments were approved by the Animal Research Experiment of Kyoto Medical Center.
Provenance and peer review Not commissioned; externally peer reviewed.
Data availability statement The data sets analyzed in the current study are available from the corresponding author upon reasonable request.