Article Text

Abstract
Introduction Non-alcoholic fatty liver disease (NAFLD) is a global health problem with high geographic heterogeneity. We aimed to investigate regional-specific concomitant rate of NAFLD and quantitative relationship between liver fat content (LFC) and glucose metabolism parameters in representative clinical populations from six provinces/municipalities of China.
Research design and methods A total of 2420 eligible Han Chinese were enrolled consecutively from 10 clinics of obesity, diabetes and metabolic diseases located at six provinces/municipalities of China, and divided into North (Tianjin, Shandong and Heilongjiang) and South (Shanghai, Jiangsu and Henan) groups according to their geographical latitude and proximity of NAFLD concomitant rate. LFC was assessed by a quantitative ultrasound method. Multivariate regression models and analysis of covariance were used to assess the regional difference in the risk of NAFLD.
Results The concomitant rate of NAFLD was 23.3%, 44.0% and 55.3% in individuals with normal glucose tolerance (NGT), pre-diabetes and diabetes, respectively. A higher concomitant rate of NAFLD was found in the participants from the North comparing with the South group, regardless of glucose metabolism status (34.7% vs 16.2% in NGT, 61.5% vs 34.7% in pre-diabetes and 67.1% vs 48.1% in diabetes). This regional difference remained significant after adjustment for age, gender, alcohol drinking, cigarette smoking, confounding metabolic parameters and liver enzymes. For any given blood glucose, participants from the North had higher LFC than those from the South group.
Conclusions Half of Han Chinese with pre-diabetes/type 2 diabetes had NAFLD, and the individuals from the North cities were more susceptible to NAFLD.
- pre-diabetes
- liver fat
- type 2 diabetes
- non-alcoholic fatty liver disease
This is an open access article distributed in accordance with the Creative Commons Attribution Non Commercial (CC BY-NC 4.0) license, which permits others to distribute, remix, adapt, build upon this work non-commercially, and license their derivative works on different terms, provided the original work is properly cited, appropriate credit is given, any changes made indicated, and the use is non-commercial. See: http://creativecommons.org/licenses/by-nc/4.0/.
Statistics from Altmetric.com
Significance of this study
What is already known about this subject?
Non-alcoholic fatty liver disease (NAFLD) is the most common cause of chronic liver disease around the world and highly correlated with diabetes and other metabolic diseases.
A geographic difference in the prevalence of NAFLD in China has been reported previously, but there were great variations in the diagnostic methods, composition of ethnicity and metabolic status among different studies.
What are the new findings?
This study was the first nationwide multicenter cross-sectional study to examine the regional-specific concomitant rate of NAFLD and quantitative relationship between liver fat content and glucose metabolic parameters in China.
The concomitant rate of NAFLD was 23.3%, 44.0% and 55.3% in individuals with normal glucose tolerance, pre-diabetes and diabetes, respectively, in China.
Northern Han Chinese had higher susceptibility to NAFLD than Southern Han Chinese, even if the factors of ethnicity, body mass index and glucose and lipid metabolic parameters were matched and age, gender and habits of cigarette smoking and alcohol drinking were fully adjusted.
How might these results change the focus of research or clinical practice?
An early assessment of NAFLD might be recommended for Han Chinese with pre-diabetes, especially for the individuals from the typical Northern provinces of China.
Introduction
Non-alcoholic fatty liver disease (NAFLD) is the most common cause of chronic liver disease, with an estimated global prevalence of 24%.1 Type 2 diabetes mellitus (T2DM) is a risk factor for NAFLD and relates to a worse prognosis of NAFLD, including non-alcoholic steatohepatitis (NASH), fibrosis, cirrhosis and even hepatic carcinoma.2 In patients with T2DM, the estimated global prevalence of NAFLD is 55.48%,3 twice that of general population. The prevalence of NASH and advanced fibrosis confirmed by liver biopsy also multiplied to 37.33% and 4.8%, respectively, in patients with T2DM.3 Furthermore, NAFLD in T2DM may lead to a higher risk of developing cardiovascular disease and diabetic vascular complications, independently of other known risk factors.4 In this respect, accurate evaluation of the presence of NAFLD in patients with T2DM is of great importance.
A recent investigation on the global epidemiology of NAFLD in patients with T2DM indicated a geographic heterogeneity of NAFLD prevalence over the world, with highest prevalence of 68.0% in Europe and lowest prevalence of 30.4% in Africa.3 In China, the prevalence of NAFLD in the general population also showed a geographic difference in a recent meta-analysis of 392 independent studies, which was 31.14% in the North of China and 26.86% in the South of China (p<0.001).5 Noticeably, there were great variations in the diagnostic methods and the composition of ethnicity and metabolic status among these studies.
Han Chinese are the largest ethnic group in the world and often develop NAFLD at lower body weight than Caucasians.6 To the best of our knowledge, the concomitant rate of NAFLD in Han Chinese with T2DM has been rarely investigated, and none of the published studies on NAFLD in China has been performed in multiple centers nationwide with a uniform diagnostic method and inclusion criteria.
In the current study, we performed a nationwide multicenter cross-sectional study to examine the regional-specific concomitant rates of NAFLD and quantitative association between liver fat content (LFC) and glucose metabolism parameters in representative samples from 10 clinics of obesity, diabetes and metabolic diseases located at four provinces and two municipalities in mainland China. A uniform standardized ultrasound quantitative method was used to measure LFC,7 and all participants came from Han nationality and were categorized according to their glucose metabolic status.
Methods
Study participants
A total of 2704 participants from 10 clinics of obesity, diabetes and metabolic diseases located at six provinces/municipalities of China were enrolled consecutively and separately between January 2011 and December 2011. Each center was expected to continuously enroll equal number of diabetic and non-diabetic participants, respectively, to a total participant number of 150 to 300. To minimize the selection bias, an online patient registration system was used (http://120.26.47.233:3000/signin) and a unique clinic ID for each participant was recorded in the system to ensure continuous enrollment of participants and to avoid repeated input of individual record. Participants were excluded due to the lack of necessary biochemical or liver ultrasonography data (n=125), concomitant with hepatitis B or hepatitis C (n=48), concomitant with other known liver disease or endocrine diseases (n=6) and excessive alcohol consumption (>20 g/day for men, >10 g/day for women) (n=105). Ultimately, 2420 participants (904 from North of China, 1516 from South) were included in the analysis (figure 1), with the detailed number of participants enrolled from each province/municipality listed in online supplementary table 1. For all statistical analysis, we divided the participants into three groups according to their glucose metabolism status: (1) normal glucose tolerance (NGT): fasting blood glucose (FBG) <5.6 mmol/L and 2-hour postprandial blood glucose (2hPBG) <7.8 mmol/L and without a history of diabetes; (2) impaired glucose regulation (IGR): meeting the diagnostic criteria of impaired fasting glucose (IFG) and/or impaired glucose tolerance (IGT); IFG: FBG ≥5.6 mmol/L and <7.0 mmol/L and 2hPBG <7.8 mmol/L; IGT: FBG <5.6 mmol/L and 2hPBG ≥7.8 mmol/L and <11.1 mmol/L; (3) T2DM: FBG ≥7.0 mmol/L or 2hPBG ≥11.1 mmol/L (confirmed by repeat testing) or previously diagnosed as T2DM or treated with antidiabetic drugs. Geographically, Qinling Mountain-Huai River line divided China into Northern and Southern parts. Tianjin, Shandong and Heilongjiang are typical northern provinces/municipalities, and Shanghai and Jiangsu belong to southern provinces/municipalities. Henan province is located at the boundary of between North and South. Although most region of Henan province is located to the north of Qinling Mountain-Huai River line, intriguingly, the Henan Han population are genetically closer to the Southern Han Chinese,8–10 and the genetic structure of the Han Chinese using genome-wide association study (GWAS) data showed that the genetic background of Henan Han Chinese is closest to people from Jiangsu province.11 As a result, the population metabolic feature of Henan Han Chinese, such as overweight and obesity, is similar to Jiangsu province and significantly different from the typical North provinces.12 ,13 Consistently, the crude concomitant rates of NAFLD in Henan Han Chinese were closer to Jiangsu and Shanghai, and lower than the North provinces, under similar glucose metabolism status (online supplementary table 1). The Henan Han Chinese participants were included in the Southern Han Chinese group based on the similarity of genetic structure and the metabolic features. Therefore, the participants enrolled were divided into Northern (Tianjin, Shandong and Heilongjiang) and Southern (Shanghai, Jiangsu and Henan) Han Chinese groups for all analysis. A written informed consent was obtained from all participants.
Supplemental material

Flow chart of the study participants.
Ultrasound examination of liver and determination of LFC
Liver ultrasonography was performed at 10 centers by trained ultrasonographists who were unaware of the participants’ clinical information using fixed ultrasound machines with 4 MHz probe. All the ultrasound machines were calibrated by a three-dimensional abdominal tissue-mimicking phantom (Model 057; Computerized Imaging Reference Systems, Norfolk, Virginia, USA) to ensure the machine settings consistent. The phantom’s hepatic echo-intensity attenuation rate and hepatic/renal echo-intensity ratio under different ultrasound machines after calibration were listed in online supplementary table 2. Fatty liver was diagnosed according to the same criteria for hepatic steatosis under ultrasonography.14 LFC by quantitative liver ultrasonography was available in 1813 participants (721 from North group, 1092 from South group). The liver ultrasound images were captured and the ultrasound hepatic/renal echo-intensity ratio and ultrasound hepatic echo-intensity attenuation rate were measured using NIH-image software (Image J 1.41o, National Institutes of Health, USA) in a computer program. Both parameters were standardized using the tissue-mimicking phantom’s hepatic/renal ratio and hepatic attenuation rate, respectively, before analysis. The LFC was calculated using the following equation: LFC (%) = (62.592×standardized ultrasound hepatic/renal ratio) + (168.076×standardized ultrasound hepatic attenuation rate) − 27.863.7
Anthropometric and biochemical measurements
We used a standardized questionnaire to interview all participants about their medical history, lifestyle and current use of medications. And then weight, height, waist circumference (WC) and blood pressure (BP) were obtained by a physical examination. Body mass index (BMI) was calculated by dividing the weight in kilograms by the square of height in meters.
For laboratory assessments, blood samples were obtained after fasting overnight ≥10 hours. Serum alanine aminotransferase (ALT), aspartate aminotransferase (AST), gamma-glutamyl transferase (GGT), total cholesterol (TC), high-density lipoprotein cholesterol (HDL-c), triglycerides (TG), uric acid (UA) and liver enzymes were measured by a model 7600 automated bioanalyzer (Hitachi, Tokyo, Japan). Low-density lipoprotein cholesterol (LDL-c) was calculated by the Friedewald equation. The FBG and 2-hour postload blood glucose in oral glucose tolerance test (OGTT 2hBG) were tested following a standard 75 g oral glucose tolerance test and measured using the glucose oxidase method.
Statistical analysis
All statistical analyses were performed using SPSS software V.19.0 (SPSS, Chicago, Illinois, USA). Normally distributed data were presented as the means±SD and non-normally distributed data were shown as median with the IQR given in parentheses. Categorical variables were presented as number with the proportion given in parentheses. General linear models were used for comparisons of continuous data among groups, whereas the χ2 test was used for comparisons of categorical variables. The skewed parameters were log-transformed to approximate normality before analysis. Pearson linear correlation analysis was used to detect the correlation between the LFC and metabolic parameters, and an analysis of covariance was used to compare the slopes and intercepts of regression lines between the North and South groups. Multivariate logistic regression analysis was used to investigate the independent association between geographic regions and risk of NAFLD, with potential confounding parameters (age, gender, history of mild to moderate alcohol drinking, cigarette smoking and statins treatment, BMI, WC, FBG, BP, serum lipid profile, UA and liver enzymes) fully adjusted. Subgroup analysis was performed in participants without mild–moderate alcohol consumption to further exclude the confounding effect of alcohol consumption on North–South difference. A p<0.05 was considered statistically significant.
Results
Characteristics of study participants
Among 2420 enrolled participants (age 54.5±13.8 years; 1174 men and 1246 women), 750 participants were included in NGT group, 425 in IGR group and 1245 in T2DM group. Within T2DM group, 383 (30.8%) participants were newly diagnosed as T2DM within 1 month, and 862 (69.2%) had duration of 8 (25th to 75th percentiles, 3–12) years of T2DM and received antidiabetic treatment previously. The baseline characteristics of all participants are shown in table 1. Participants from North and South groups had similar BMI, WC, diastolic blood pressure, FBG, OGTT 2hBG, TC, TG, HDL-c and UA levels (all p>0.05). Compared with the South group, participants from the North group were younger, had higher proportion of male participants, cigarette smoking, mild to moderate alcohol drinking and statins treatment. After further adjustment for age and gender, the people from the North still had higher proportion of cigarette smoking, alcohol drinking and statins use than South (all p<0.05). For the mild–moderate alcohol drinkers, the average alcohol consumption per week and lifetime alcohol consumption showed no difference between Northern and Southern Han Chinese.
Characteristics of the study participants
Higher proportion of NAFLD in northern Han Chinese
Although the composition of IGR and T2DM had no difference between participants from North and South groups, participants from the North had significantly higher proportion of NAFLD (55.9% vs 35.9%, p<0.001) than participants from the South (table 1, figure 2A). The number and proportion of NAFLD in different provinces were listed in online supplementary table 1. There was a gradual increase in the concomitant rate of NAFLD and LFC in participants with NGT, IGR and T2DM (p<0.001) (figure 2B,C). The percentage of NAFLD in the participants from North was higher than those from the South, regardless of glucose metabolism status (34.7% vs 16.2% in NGT, 61.5% vs 34.7% in IGR and 67.1% vs 48.1% in T2DM, all p<0.001) (figure 2A). Consistently, participants from North group had higher LFC than those from the South group regardless of glucose metabolism status (figure 2D,E). Significantly higher levels of serum ALT, AST and GGT were also observed in participants from the North group after adjustment for age and gender (all p<0.001) (table 1).
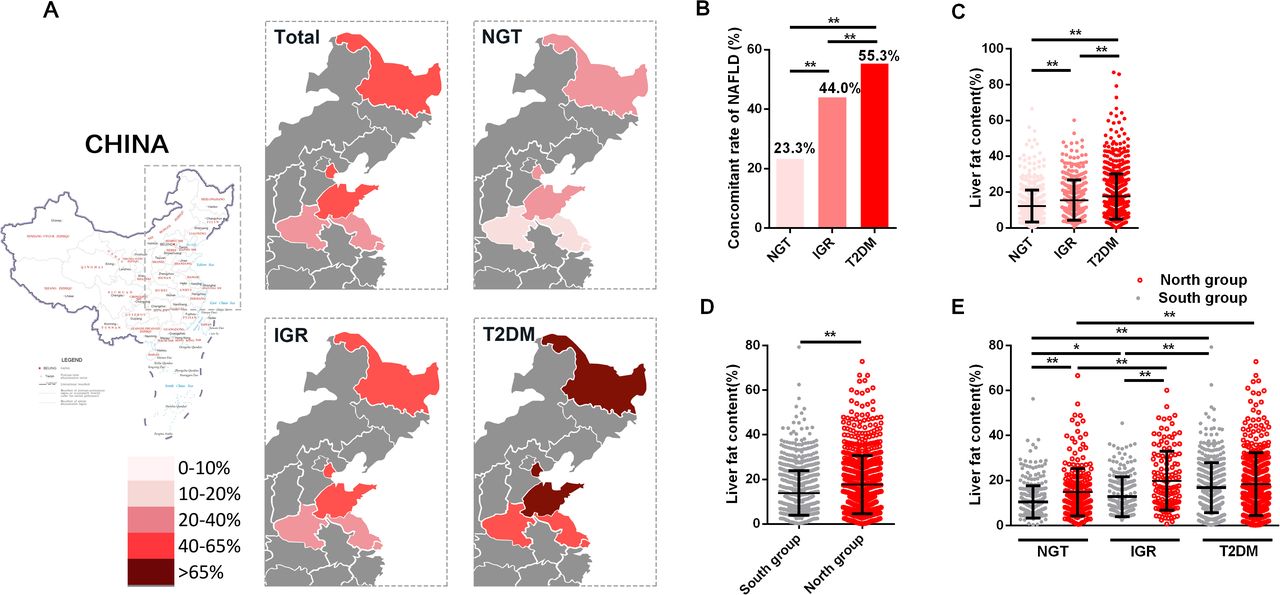
The concomitant rates of non-alcoholic fatty liver disease (NAFLD) and the liver fat content determined using quantitative ultrasound method stratified by glucose metabolism status and by geographical distribution. Participants from Henan province were included in the South group based on their metabolic features and genetic structure. (A) The concomitant rates of NAFLD in population with different glucose metabolism from different geographic regions of China. In Northern Han Chinese, the concomitant rate of NAFLD was 55.9% overall, and 34.7%, 61.5% and 67.1%, respectively, in participants with normal glucose tolerance (NGT), impaired glucose regulation (IGR) and type 2 diabetes mellitus (T2DM). In Southern Han Chinese, the concomitant rate was 35.9% overall, and 16.2%, 34.7% and 48.1%, participants with NGT, IGR and T2DM. The concomitant rate of NAFLD was significantly higher in the North comparing with the South group regardless of glucose metabolism status (all p<0.001). There was a gradual increase in the concomitant rate of NAFLD (B) and a gradual increase in liver fat content (C) in participants with NGT, IGR and T2DM (all p<0.001). The liver fat content was higher in North group overall (D) and in NGT and IGR subgroup (E) than in South group (all p<0.001). In the part figures C–E, the data were presented as the mean±SD. *p<0.05, **p<0.01.
A crude univariate logistic analysis showed that the ORs for NAFLD were 2.25 (1.91–2.67) overall, and 2.74 (1.94–3.89), 3.01 (2.00–4.57) and 2.20 (1.73–2.79) in NGT, IGR and T2DM participants from the North China, respectively, compared with the participants from the South group. After successively adjusting for age, gender, alcohol drinking, cigarette smoking, BMI, WC, FBG, systolic blood pressure, serum TG, TC, LDL-c, HDL-c, UA, statins treatment, ALT, AST and GGT, participants from the North group still had higher risk of NAFLD (OR 3.09 (2.45–3.90)), and the multiadjusted ORs for NAFLD were 4.15 (2.52–6.95), 4.45 (2.49–8.17) and 2.54 (1.86–3.50) under NGT, IGR and T2DM status, respectively (table 2).
Comparison of NAFLD concomitant rates under different glucose metabolism status between South and North group
Relationship between LFC and glucose and lipid metabolic parameters in Northern and Southern Han Chinese
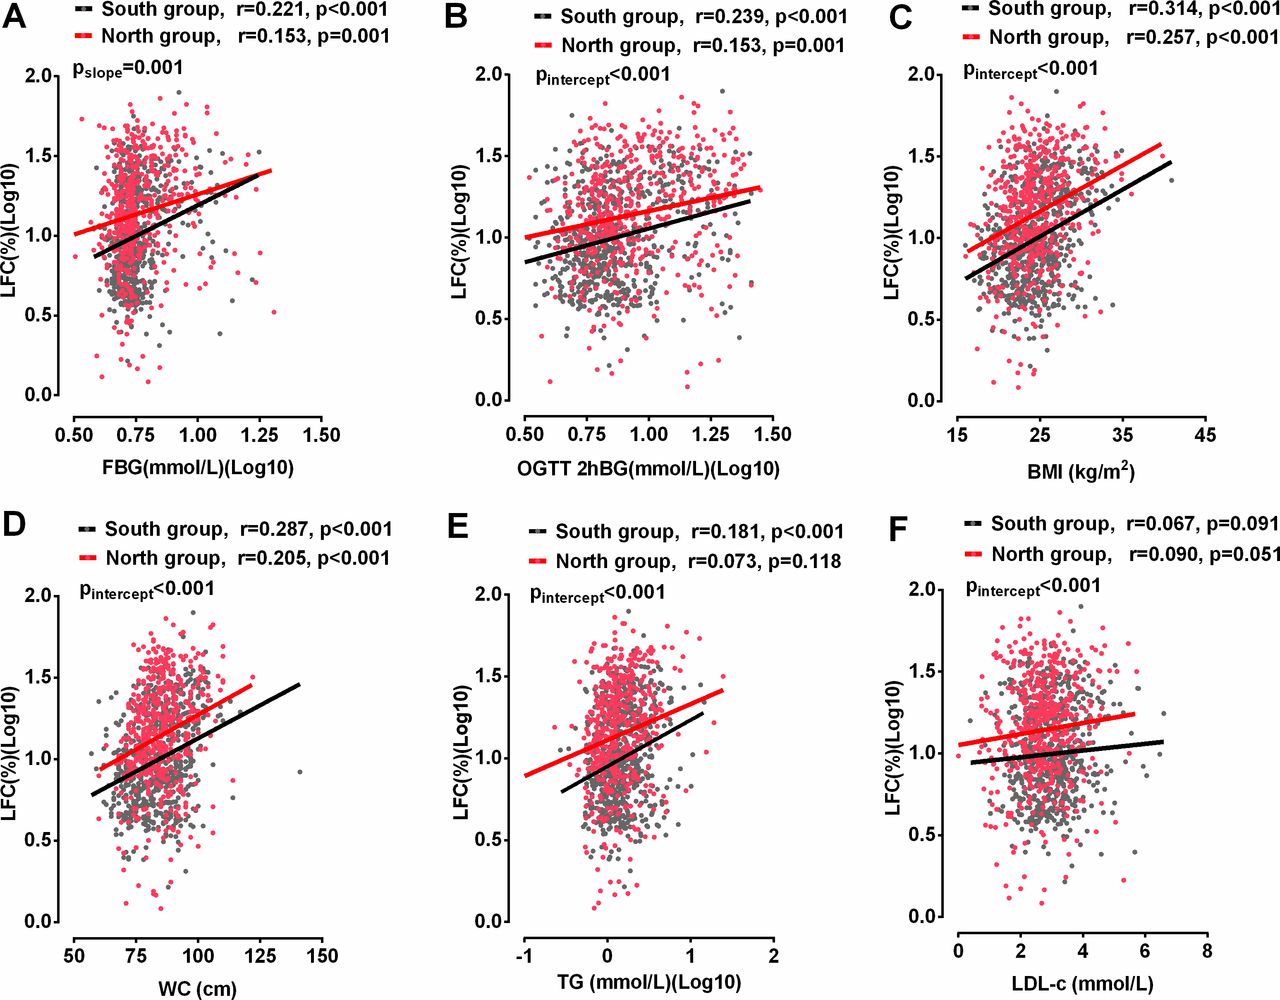
To further explore the influence of geographic region on the associations between LFC and glucose and lipid metabolic parameters, the regression lines relating serum glucose and lipid metabolism parameters to LFC in these two groups were compared. Participants with previous use of antidiabetic medication were not included for comparison to exclude the medication’s influence on the LFC–glucose relationship. Participants from Henan province were included in South group because their metabolic features and genetic structure are closer to Southern Han Chinese. LFC was positively associated with FBG and OGTT 2hBG in participants both from North and South groups (all p≤0.001) (figure 3A,B). At any given level of FBG, the average LFC was higher in participants from the North than the South and the difference in LFC was reduced with increasing FBG, which was reflected by a lower slope of the regression line relating FBG and LFC in the North group and an intersection of the two regression lines at the FBG level of 18 mmol/L (figure 3A). Although there were no differences in the slopes of the regression lines relating OGTT 2hBG to LFC between North and South groups (p>0.05), the intercept of regression line was significantly higher in the North group, which indicated a higher LFC at any given level of OGTT 2hBG in the participants from the North group. A similar pattern was observed in the quantitative association of BMI, WC, serum TG and LDL-c with LFC in participants from the North and South groups (figure 3C–F).

Relationships of liver fat content (LFC) (%) with fasting blood glucose (FBG) (A), 2-hour postload blood glucose in oral glucose tolerance test (OGTT 2hBG) (B), body mass index (BMI) (C), waist circumference (WC) (D), serum triglyceride (TG) (E) and low-density lipoprotein cholesterol (LDL-c) (F) in participants without previous antidiabetic treatment. Participants from Henan province were included in the South group based on their metabolic features and genetic structure. LFC was positively associated with FBG, OGTT 2hBG, BMI and WC in participants from both the North and South groups, and serum TG in participants from the South group (all p<0.05). Participants from the North had higher LFC than those from the South at any given level of FBG, and the difference was narrowed with the increase of FBG (pslope=0.001). Moreover, participants from the North group had significantly higher LFC than those from the South at any given level of OGTT 2hBG, BMI, WC, TG and LDL-c. Black dots and lines represent participants from the South group. Red dots and lines represent participants from the North group.
Liver enzyme profile is the most commonly used serum biomarker for the severity of NAFLD. Participants from the North group had significantly higher levels of serum liver enzymes than those from the South with similar level of blood glucose (online supplementary figure 1), which was consistent with the association between blood glucose and LFC in these two groups.
Subgroup analysis in population without mild–moderate alcohol consumption
A difference in the proportion of mild–moderate alcohol consumption was noticed between the Northern and Southern Han Chinese in our study (table 1), and recent studies indicated that even low alcohol intake will influence the progression of NAFLD.15 To further exclude the confounding effect of mild–moderate alcohol consumption, a subgroup analysis was performed in 1910 non-drinkers (1304 in the South group, 606 in the North group). As shown in online supplementary figure 2, participants without any alcohol consumption from the North had significantly higher LFC than those from the South at any given level of FBG, OGTT 2hBG, BMI or WC (online supplementary figure 2). Multivariate regression analysis indicated that the Han Chinese from the North group had higher risk of NAFLD than those from the South group after multiple adjustment and exclusion of mild–moderate alcohol consumption (online supplementary table 3).
Discussion
Our current multicenter hospital-based study focused on the people with high risk of NAFLD from multiple clinics of obesity, diabetes and metabolic diseases at six provinces/municipalities of China, and found the presence of NAFLD in 23.3% people with NGT, 44.0% with IGR and 55.3% with T2DM. Unexpectedly, the percentage of NAFLD in Northern Han Chinese was approximately twofold of that in Southern Han Chinese, regardless of glucose metabolism status (34.7% vs 16.2% in NGT, 61.5% vs 34.7% in IGR and 67.1% vs 48.1% in T2DM). Our results indicated that risk factors other than metabolic parameters such as body weight, serum glucose or lipid metabolism parameters might lead to the regional difference in the concomitance of NAFLD and diabetes in Han Chinese adults.
Previous studies have shown that the proportion of NAFLD diagnosed by ultrasonography was 22.5%–27% in NGT,16 17 33%–59% in IGR16 18 and 54.5%–80% in T2DM.16 19 20 The results in our current nationwide multicenter study were consistent with the previous studies from other ethnic groups, and we further found a continuous linear correlation between LFC and fasting/postload blood glucose in China. Although it is well known that NAFLD and T2D usually coexist with each other, less attention was paid to the presence of NAFLD at the stage of IGR. In the current study, we found a high proportion of NAFLD with elevated liver enzyme levels in people with IGR, which was close to the level in patients with T2DM. Thus, even a moderately increase in blood glucose was associated with a significant increase in the risk of NAFLD in non-diabetic Han Chinese. As the prevalence of IGR was estimated to be as high as 35.7% in the general Chinese population,21 the evaluation of liver disorders in this special group of people might be important. As it has been reported that hepatic, muscle and adipose insulin sensitivity was affected early on, after a relatively small accumulation of LFC (>1.5%),22 it is not surprising that risk of NAFLD was doubled in individuals with IGR.
NAFLD is a heterogeneous disease, which is influenced not only by individual metabolic status but also by age, gender, ethnicity, dietary composition and genetic polymorphism.23 About 7%–19% of individuals develop NAFLD in the absence of obesity, and this proportion is extremely high in Asian population.24 In other words, Asians might be more susceptible to NAFLD than people from other ethnic groups (such as Caucasians) under the same degree of metabolic disorders. In our study, a geographic difference in the concomitant rate of NAFLD was also found between Northern Han Chinese and Southern Han Chinese, even if the factors of ethnicity, BMI and glucose and lipid metabolic parameters were matched and age, gender, habits of alcohol drinking and cigarette smoking and lipid-lowering drug treatment were adjusted. Our study supported that Northern Han Chinese were more susceptible to NAFLD than Southern Han Chinese at the same degree of metabolic impairment.
The most possible explanation for the regional difference in NAFLD susceptibility was the difference in the frequency of NAFLD-related gene polymorphism between Northern and Southern Han Chinese. Previous GWASs had identified genetic variants associated with NAFLD severity that did not correlate with insulin resistance.25 Individuals carrying specific NAFLD-related gene variants (eg, PNPLA3, TM6SF2 and MBOAT7) are featured of development of NAFLD with a relative conservation of glucose metabolism.26 Although we narrowed our study participants into the range of Han Chinese, a considerable number of subethnicities within the Han classification have been identified with established genetic heterogeneity following a geographical North–South cline, and there is a high degree of resemblance between the genetic and geographic structure of the Han Chinese.11 No previous study has compared the frequency of the major NAFLD-related gene variants between Northern and Southern Han Chinese; however, we can notice the higher frequency of PNPLA3 rs738409 GG variant, the strongest gene variant for NAFLD, in Northern Han Chinese (23.3%)27 than Southern Han Chinese (13.2%)28 in previous studies. In addition, comparison of Han Chinese in Beijing (CHB) (representing Northern Han Chinese, n=103) and Han Chinese South (CHS) (representing Southern Han Chinese, n=105) healthy samples from the 1000 Genomes Project showed a higher prevalence of NCAN rs2228603 C>T variant in CHB (T allele frequency: CHB vs CHS, 0.112 vs 0.030, p<0.05). NCAN rs2228603 C>T variant was reported to be associated with elevated LFC and an increased risk for progression to NASH but paradoxically lower TG and LDL-c levels.29 Therefore, the frequency of several genetic variations may contribute to the geographical differences in susceptibility of NAFLD we found.
Other possible reasons were the differences in lifestyle habits (alcohol consumption and cigarette smoking), lipid-lowering drug use and dietary composition between the North and South group. Although we carefully excluded all participants with excessive alcohol consumption, there was a significant difference in the proportion of alcohol consumer between the North and South groups, even after adjustment for age and gender. To avoid the effect of mild–moderate alcohol consumption to the occurrence of NAFLD and LFC, we performed subgroup analysis in non-drinkers. Participants without alcohol consumption from the North still had significantly higher LFC than those from the South at any given level of FBG, OGTT 2hBG, BMI or WC (online supplementary figure 2). The higher risk of NAFLD in the North group remained significant after we excluded all participants with mild–moderate alcohol consumption, and the regression lines relating blood glucose to LFC showed no difference between alcohol drinkers and non-alcohol drinkers as shown in online supplementary figure 3. Cigarette smoking was associated with NAFLD in several previous studies30 31; therefore we also adjusted cigarette smoking in our regression model, and the higher risk of NAFLD in the Northern Han Chinese remained significant, and the regression lines relating blood glucose to LFC showed no difference between cigarette smokers and non-smokers (online supplementary figure 4). To exclude the confounding effect of lipid-lowering drug treatment, use of lipid-lowering drug was adjusted in our regression model, and the risk of concomitant NAFLD was still higher in North group. The regression lines relating blood glucose to LFC showed no difference between participants with and without previous statins treatment in the North group (online supplementary figure 5). Therefore, the habit of cigarette smoking and alcohol drinking as well as the lipid-lowering drug treatment were not likely responsible for the regional difference in NAFLD susceptibility between Northern and Southern Han Chinese. As for dietary composition, the dietary pattern in the South has more varieties and higher concentration of omega-3 fatty acid, which might be protective against liver steatosis independent of its beneficial effect on other metabolic disorders.32 However, the detailed dietary information was not available in our study.
To the best of our knowledge, our current study is the first multicenter study to investigate the quantitative association between LFC and blood glucose in Han Chinese. The use of a phantom standardized ultrasound quantitative method for LFC well controlled the variation in the measurement of LFC among different medical centers. The finding of the large geographical difference in the concomitant rate of NAFLD in Han Chinese with IGR and T2DM also had great significance in clinical practice.
Several limitations are associated with our current study. First, all the study participants were Han Chinese and enrolled from clinics of obesity, diabetes and metabolic diseases in tertiary hospitals with high risk of NAFLD, so the prevalence of NAFLD in patients with pre-diabetes and diabetes from general population and other ethnic groups still need further investigation. Second, as a large-scale multicenter study, the information on NAFLD-related gene variants and dietary composition information was not available, which might help to explain the geographic difference in the susceptibility for NAFLD in Han Chinese. Third, this is a cross-sectional study that could not permit an evaluation of the causal and temporal relationships between NAFLD and abnormal glucose metabolism.
In conclusion, we found a high concomitant rate of NAFLD in Han Chinese population with IGR (44.0%) and T2DM (55.3%) but their body weight only slightly increased (BMI: 24.7±3.6 kg/m2). There is a remarkable difference in the proportion of NAFLD between the Northern and Southern Han Chinese under the same metabolic status. Therefore, an early assessment of NAFLD might be necessary for Han Chinese at the stage of pre-diabetes, especially for the individuals from the North provinces of China.
Acknowledgments
We thank the study participants for all the works done for this study.
References
Footnotes
MX and XS are joint first authors.
MX and XS contributed equally.
Contributors XG takes responsibility for the integrity of the work as a whole, from inception to published article. XG and HB designed the research study. HB, MX, LZ, YBi, QL, LS, FD, HL, DZ, YG, YBa, YW and LH performed the research. HB, MX and XS collected and checked the data. MX, BW and SW analyzed the data of quantitative liver ultrasonography. MX and XS analyzed the statistic data and wrote the paper, and XG and HB edited the manuscript. JG helped to revise the manuscript. All authors approved the final version of the manuscript.
Funding This work was supported by the financial support of National Natural Science Foundation of China (81471073 to HB).
Map disclaimer The depiction of boundaries on the map(s) in this article do not imply the expression of any opinion whatsoever on the part of BMJ (or any member of its group) concerning the legal status of any country, territory, jurisdiction or area or of its authorities. The map(s) are provided without any warranty of any kind, either express or implied.
Competing interests None declared.
Patient consent for publication Not required.
Ethics approval The study protocol followed the guidelines of Research Ethics Committees of Zhongshan Hospital affiliated to Fudan University (approval number: 2011-6) and protocols in other involved hospitals were performed in accordance with the ethical principles of the Declaration of Helsinki and approved by local Research Ethics Committees.
Provenance and peer review Not commissioned; externally peer reviewed.
Data availability statement All data relevant to the study are included in the article or uploaded as supplementary information.