Article Text

Abstract
Introduction Identification of physiological factors influencing susceptibility to insulin resistance and type 2 diabetes (T2D) remains an important challenge for biology and medicine. Numerous studies reported energy expenditures as one of those components directly linked to T2D, with noticeable increase of basal metabolic rate (BMR) associated with the progression of insulin resistance. Conversely, the putative link between genetic, rather than phenotypic, determination of BMR and predisposition to development of T2D remains little studied. In particular, low BMR may constitute a considerable risk factor predisposing to development of T2D.
Research design and methods We analyzed the development of insulin resistance and T2D in 20-week-old male laboratory mice originating from three independent genetic line types. Two of those lines were subjected to divergent, non-replicated selection towards high or low body mass-corrected BMR. The third line type was non-selected and consisted of randomly bred animals serving as an outgroup (reference) to the selected line types. To induce insulin resistance, mice were fed for 8 weeks with a high fat diet; the T2D was induced by injection with a single dose of streptozotocin and further promotion with high fat diet. As markers for insulin resistance and T2D advancement, we followed the changes in body mass, fasting blood glucose, insulin level, lipid profile and mTOR expression.
Results We found BMR-associated differentiation in standard diabetic indexes between studied metabolic lines. In particular, mice with low BMR were characterized by faster body mass gain, blood glucose gain and deterioration in lipid profile. In contrast, high BMR mice were characterized by markedly higher expression of the mTOR, which may be associated with much slower development of T2D.
Conclusions Our study suggests that genetically determined low BMR makeup involves metabolism-specific pathways increasing the risk of development of insulin resistance and T2D.
- basal metabolism
- diabetes mellitus, experimental
- obesity
- insulin resistance
This is an open access article distributed in accordance with the Creative Commons Attribution Non Commercial (CC BY-NC 4.0) license, which permits others to distribute, remix, adapt, build upon this work non-commercially, and license their derivative works on different terms, provided the original work is properly cited, appropriate credit is given, any changes made indicated, and the use is non-commercial. See: http://creativecommons.org/licenses/by-nc/4.0/.
Statistics from Altmetric.com
Significance of this study
What is already known about this subject?
Type 2 diabetes (T2D) development is underlined by both genetic and environmental factors affecting energy balance and leading to a nexus of weight gain and insulin resistance.
Interpretation of observational study results is usually confounded by the lack of clear discrimination of genetic and environmental factors, as well as their overall correlative character.
What are the new findings?
Individuals with genetically determined low basal metabolic rate (BMR) have higher propensity to spontaneous weight gain and insulin resistance, while their high BMR counterparts manifested much slower development of T2D.
Increase in liver mTOR expression fosters a transition toward catabolic processes enabling the maintenance of high metabolism rate, acting as a protection shield against disturbances in glucose homeostasis.
How might these results change the focus of research or clinical practice?
Incorporation of BMR-related approach in studies of metabolic diseases, including diabetes, should be of significant importance to indicate patients with predisposition to insulin resistance and T2D.
Introduction
Diabetes mellitus is a chronic metabolic disease, which has become a leading health concern worldwide.1–3 The two types of diabetes are type 1 diabetes and type two diabetes (T2D), with much higher prevalence of T2D, which increases general multimorbidity posing social and economic burden.4
T2D development is underlined by both genetic and environmental factors affecting energy balance and leading to a nexus of weight gain and insulin resistance (IR).5–8 In humans, no less than 70% of the total energy expenditures constitutes basal metabolic rate (BMR) or resting metabolic rate (RMR), which comprises of energy expended for vital functions in a resting, postabsorptive state.9 It is therefore unsurprising that the link between variation in BMR/RMR and weight gain has received a lot of attention.5 7 10–13 However, the results of observational studies were largely inconclusive. For example, several authors concluded that individuals characterized by lower energy expenditures and sedentary lifestyle may be at higher risk of weight gain and impaired insulin sensitivity.5 7 14–16 Conversely, there is even evidence for positive association between RMR, weight gain and/or diabetes of both types,14 17 18 whereas Katzmarzyk et al19 and Morino et al20 found no association between RMR and changes in body mass, fatness, or diabetes prevalence.
Interpretation of observational study results is usually confounded by the lack of clear discrimination of genetic and environmental factors, as well as their overall correlative character. Well-established research paradigms addressing such inconsistencies include the use of animal models tailored to pinpoint physiological and molecular mechanisms driving the observed correlations. To date, various animal models of diabetes have been developed.1 3 21 22 Yet, to our knowledge, no animal model has ever been applied to study the putative link between genetically determined variation in BMR/RMR and predisposition to T2D development. Here, we analyzed this link using lines of laboratory mice divergently selected for high and low BMR, currently characterized by a 50% differentiation in BMR that is unmatched by any other animal model.16 23 Apart from the difference in BMR, the lines differ distinctly with respect to the relative sizes of metabolically active internal organs,23 as well as metabolic risk indicators, such as percent of body fat mass, blood lipid profile, and fasting blood glucose levels.16 Thus, both physiological and anatomical properties of our selection lines make them a suitable model for testing the effect of genetically determined BMR on susceptibility of metabolic disorders, including T2D.
At the genetic and molecular level, the most important intracellular pathway that coordinates both glucose and insulin homeostasis is the mechanistic target of the rapamycin (mTOR) signaling pathway. mTOR is a conserved serine/threonine kinase belonging to the PI3K-related kinase family, which senses and integrates a variety of metabolic and nutrient cues to regulate basic biological processes such as cell metabolism, growth, and survival.2 24–26 An increasing number of studies indicate that mTOR activity is involved in development of metabolic disorders, including obesity, and T2D.2 24 25 27 28 However, the effect of mTOR on progression of IR and T2D seems ambiguous.2 28 29 Under physiological conditions, the high concentration of cellular nutrients (especially glucose and proteins) leads to the activation of the mTOR gene in metabolically active organs like liver or muscles, contributing to cellular glucose intake and protecting against hyperglycemia.2 24 26 27 Numerous studies also reported the positive effect of the mTOR protein on the regulation of insulin excretion, β-cells survival, and proliferation.25 27 Conversely, hyperactivation of mTOR may lead to the degradation of membrane insulin receptors, disrupting glucose transportation and promoting IR.2 25
In the present study, we examined the putative link between genetic determination of BMR and predisposition to development of T2D using lines of mice introduced above. In particular, we analyzed the between-line difference in expression of the mTOR gene following T2D progression. As markers for IR and T2D advancement, we followed the changes in concentration of fasting blood glucose, insulin level, and lipid profile in two experimental setups, that is, mice fed with high fat diet alone or with a streptozotocin (STZ)-promoted high-fat diet (HFD), emulating IR and T2D development, respectively. Thus, using this specific animal model, we directly tested the significance of genetically determined metabolic variation as a risk factor of susceptibility to develop IR and T2D, which may help to clarify inconsistencies of longitudinal cohort studies on humans.
Research design and methods
Animals and experimental setup
We analyzed the development of IR and T2D in 20-week-old male laboratory mice (Mus musculus) originating from three independent genetic line types. Two of those lines were subjected to divergent, non-replicated artificial selection towards high (H-) or low (L-) body mass-corrected BMR (for more details see ref 30). The third line type was non-selected (NS) and consisted of randomly bred animals serving as an outgroup (reference) to the selected line types.30 We used 156 mice, where 120 originated from the 53rd generation of a long-term selection (60 from each BMR line type) and 36 mice from the 18th generation of the NS line type.
Following measurements of BMR, animals in each line type were randomly assigned to one of the experimental group: IR, T2D, and standard control (20 per group from each BMR line type and 12 per group from the NS line type). To induce IR, mice from the IR group were fed for 8 weeks with an HFD (chow no. D12492, Labofeed, Poland) with 60% fat content.31 For the T2D group, our objective was to elicit the state of severe hyperglycemia, as reported in our previous studies (eg, see ref 32). In a classic study models (eg, refs 3, 22), this is achieved by means of the exposure to the HFD followed by STZ treatment. However, in comparison with the L-BMR line, the H-BMR mice are much more resistant to development of prediabetic condition elicited by the HFD.16 To equalize the initial conditions, we therefore reversed the sequence of treatments and subject the T2D mice to STZ followed by 8 weeks of HFD. We used a single dose of STZ (100 mg/kg; Sigma-Aldrich, St Louis, Missouri, USA) selected in a pilot study carried out with doses of STZ of 80, 100, and 120 mg/kg. The control group received the standard murine chow containing 7% fat (Labofeed, Poland).
To measure fasting blood glucose level, the tail vein of all animals was punctured with a sterile needle every 2 weeks, and a blood droplet was used to perform blood glucose test (Diagomat, Diagnosis, Poland). Additionally, hyperglycemia was checked (blood glucose over 130 mg/dL) in T2D group 72 hours after STZ injection. In the control group, the fasting blood glucose levels were measured at the beginning and at the end of the experiment only.
Throughout the experiment, animals were maintained individually in plastic cages at 23°C and 12d:12 n photoperiod. Body mass was recorded every 2 weeks. At the end of the 8th week, they were anesthetized by intraperitoneal administration of a mixture of ketamine and xylazine at a dose of 50 mg /kg and 5 mg/kg, respectively. The whole blood was taken directly from the heart, centrifuged immediately, and serum was collected. A piece of liver (~50 mg) was taken and suspended in RNA stabilization solution in order to be used for genetic analyses (RNA later, Invitrogen, Lithuania). The serum and liver were stored at −80°C until analyzed.
Metabolic rate measurements
Following standard procedure, BMR was measured in all animals, before the experiment.30 Briefly, we used a positive-pressure open-circuit respirometry system with dried and warmed atmospheric air pushed through the system. The system sequentially monitored oxygen consumption rate of mice placed individually in three 350 cm3 chambers. The chambers were submerged in a water bath set at 32°C±0.1°C (thermoneutral zone for mice). The airstream from the chambers was directed to a computer-controlled channel multiplexer, a part of a Sable Systems TR-1 oxygen analyzer (Henderson, Nevada, USA). The air was sampled at a rate of 75 mL/min, and prior to passing through an oxygen sensor (S-3A/I Applied Electrochemistry, Pittsburgh, PA, USA), it was scrubbed off CO2 (Carboabsorb AS, BDH Laboratory Supplies, Lutterworth, UK) and moisture (Drierite, Drierite Co. LTD, Xenia, Ohio, USA). Each metabolic measurement trial lasted 3 hours, and oxygen concentrations in each chamber were recorded every second for 2 hours. Animals were fasted for 6 hours before BMR measurements. We defined BMR (mL O2/h ±0.0013) as the lowest rate of oxygen consumption that did not change for at least 4 min by more than 0.01%. Metabolic data were analyzed with a Sable System DATACAN V software.
Biochemical parameters
The plasma insulin level was determined with an ELISA (Mercodia AB, Uppsala, Sweden). High-density lipoprotein (HDL) and low-density lipoprotein (LDL) cholesterol fractions and triglycerides (TGs) blood concentration were measured with the BioAssay Systems (HDL/LDL assay kit E2H:−100 and TG assay kit ETGA-200, respectively). Homeostasis model assessment-insulin resistance (HOMA-IR) was used to assess β-cell function and IR from basal glucose and insulin according to the formula: fasting glucose (mmol/L) × fasting insulin (µU/mL) / 22.5.3
mTOR expression
The total tissue RNA was isolated from the liver sample with a use of standard commercial kit (Total RNA mini plus, A&A Biotechnology, Poland). DNAse I treatment with Clean-up RNA concentrator (A&A Biotechnology, Poland) was applied to remove traces of DNA from all samples. RNA purity was checked using the NanoDrop 2000 (ThermoFisher). Primer specific, high capacity cDNA reverse transcription kit was used to convert RNA to cDNA (TranScriba 1 step PCR Mix, A&A Biotechnology, Poland). All RNA samples were adjusted to a starting concentration of 50 ng/µL. The expression levels of mTOR and β-actin genes (as a reference) were estimated with SYBR Green on real-time PCR (Applied Biosystems). ΔCt values for mTOR in experimental groups were corrected for untreated controls with average ΔCt as the calibrator, according to 2-ΔΔCt method.33
Statistical analyses
BMR was analyzed by means of analysis of covariance with the line type and experimental group as fixed factors and body mass as a covariate. The differences in the body mass and blood parameters were analyzed with two-way analysis of variance, with the line type and experimental group as fixed factors. The changes in blood glucose during the experiment were analyzed with ANOVA for repeated measurements with line type and experimental group as fixed factors. Post hoc comparisons were performed with a Fisher’s LSD test. All statistical analyses were carried out with Statistica V.13.3 software (StatSoft, Poland). P<0.05 was considered statistically significant.
Data and resource availability
The data sets generated and/or analyzed during the current study are available from the corresponding author on request.
Results
BMRs and body mass
Mice originating from each specific line type differed significantly with respect to the metabolic rate (F2,148=768.71; p<0.0001). The average BMR values in high line type were 63.7±0.71 mL O2/hour, while individuals from the L-BMR line were characterized with values 60% lower, that is, 40.3±0.50 mL O2/hour (table 1). Animals from the NS line type had intermediate values for this trait (52.6±0.50 mL O2/hour; table 1).
Mean values for basal metabolic rate and body mass on the beginning (ST) and the end (END) of experiment (least square means±SE) in H-BMR, L-BMR, and NS-BMR line type mice originated from insulin resistant (IR), type 2 diabetes (T2D), and control group
Initial body mass did not differ between line types (F2,147=2.62; p=0.076) nor experimental groups (F2,147=0.71; p=0.493). However, body mass gain rate differed during the experiment (time × line type interaction: F8,272=2.15; p<0.0001) with the L-BMR individuals gaining weight faster (figure 1A).

Body mass (A) and fasting blood glucose levels (B) during the experiment in H-BMR (solid lines), L-BMR (dashed lines), and NS-BMR (spotted lines) mice originated from insulin resistant (circles) and type 2 diabetes (triangles) group. Arrows indicate the average blood glucose level above 130 mg/dL (insulin resistance) for L-BMR (third week) and H-BMR (fifth week). Data are expressed as least square means. Solid horizontal line indicates hyperglycemic (ie, 130 mg/dL) state for Swiss Webster laboratory mice. H-BMR, high basal metabolic rate; L-BMR, low basal metabolic rate; NS-BMR, non-selected basal metabolic rate.
Carbohydrate profile and IR
Plasma glucose level increased significantly in all experimental groups (the effect of time in repeated measures ANOVA: F4,276=123.1, p<0.0001) but also differed between the IR and T2D treatment groups (F1,69=41.88, p<0.0001) and between the line types (F2,69=4.96, p<0.01), with L-BMR mice gaining blood glucose significantly faster than other mice (time × line type interaction: F8,276=5.23; p<0.000, figure 1B). The hyperglycemic state (fasting blood glucose over 130 mg/dL) was achieved on third, fourth, and fifth consecutive week in L, NS, and H -BMR line respectively (figure 1B).
The final blood glucose level during the 8th week of the experiment was significantly affected by the line type and experimental group (F2,116=10.35; p<0.0001 and F2,116=60.25; p<0.0001, respectively; figure 2A), with insignificant line type by group interaction (F4,116=2.44; p=0.051). Interestingly, the L-BMR glucose level was slightly higher than in other line types in both the IR and T2D groups (figure 2A). Conversely, insulin level differed between experimental groups but not between genetic lines (F2,104=5.67; p=0.005 and F2,104=2.49; p=0.09, respectively). In general, animals kept on an HFD only (IR group) were characterized by the highest concentration of insulin in peripheral blood, while individuals originated from T2D group had lower level of this hormone compared with control groups (figure 2B).

Final fasting blood glucose levels (A), insulin blood level (B), and HOMA-IR index (C) in three different metabolic lines (H-, L-, NS-; high, low, non-selected basal metabolic rate, respectively) of mice originated from insulin resistant (IR), type two diabetes (T2D), and control group. Data are expressed as least square means (solid boxes)±SE (open boxes) with ±doubled SD (whiskers). Dashed lines depict means in each experimental group. a,b,c show significant differences between line types within the control, IR and T2D groups. Asterisks indicate statistical significance of the difference between the respective experimental groups and their controls within each line type (*p<0.05, **p<0.01, ***p<0.001; ns, not significant). HOMA-IR, homeostasis model assessment-insulin resistance.
The adopted experimental model led to development of IR and T2D in all groups studied. The estimation of IR expressed by HOMA-IR index was significantly affected by both, experimental group and line type (F2,105=17.09; p<0.0001 and F2,105=3.55; p=0.032, respectively with HOMA-IR >2.5 in all experimental groups; figure 2C). Line type by group interaction was not significant (F4,105=1.10; p=0.362). HOMA-IR was markedly higher in low BMR animals fed with fat rich diet (figure 2C), which indicated rapid progression of IR leading to T2D in these animals.
Lipid profile
Cholesterol fractions differed significantly between experimental groups (F2,67=23.12; p<0.0001; F2,78=8.75; p<0.001 for HDL and LDL, respectively), with the highest values found in T2D groups (figure 3). Line type affiliation had significant impact on the concentration of low density lipoproteins (F2,78=5.00; p<0.01), with markedly higher level of LDL in LBMR individuals (figure 3A). HDL concentration remained statistically insignificant in all groups studied (F2,67=0.02; p=0.98; figure 3B). Line type by group interaction was insignificant for both HDL (F4,67=1.24; p=0.30) and LDL (F4,78=0.65; p=0.63). Exposure of studied animals to a high fat and STZ-promoted high fat diet led to significant increase in the amount of TGs in all line types (F2,82=8.82; p<0.001), with the highest concentrations of TG in the T2D groups (except for the NS-T2D group; figure 3C). Line type by treatment interaction was significant (F4,82=3.93; p=0.006).
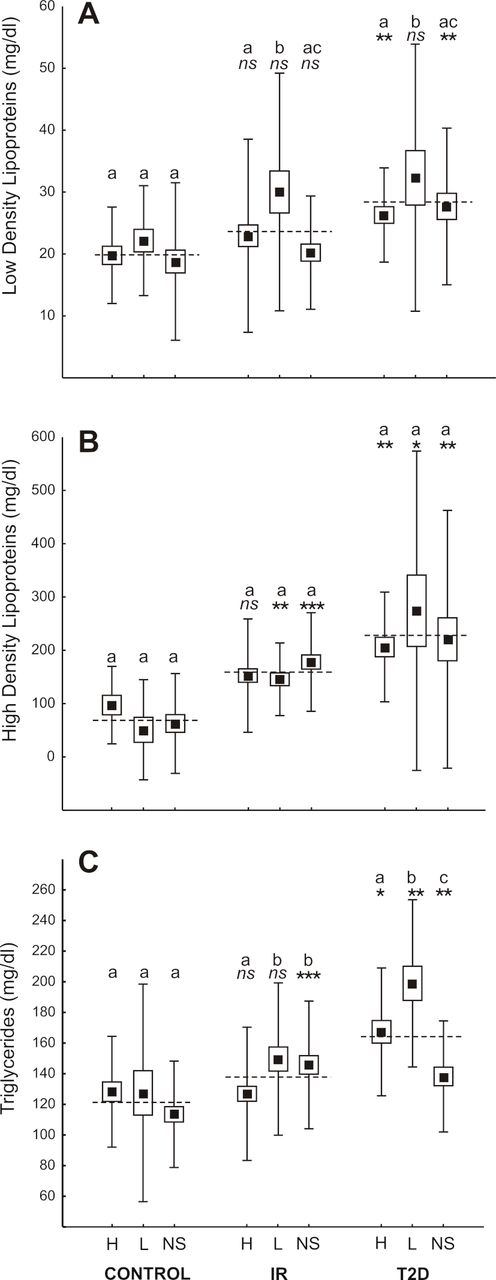
Lipids profile (LDL cholesterol (A), HDL cholesterol (B), and triglycerides (C)) in three different metabolic lines (H-, L-, NS-; high, low, non selected basal metabolic rate, respectively) of mice originated from insulin resistant (IR), type 2 diabetes (T2D), and control group. Data are expressed as least square means (solid boxes)±SE (open boxes) with ±doubled SD (whiskers). Dashed lines depict means in each experimental group. a,b,c show significant differences between line types within the control, IR and T2D groups. Asterisks indicate statistical significance of the difference between the respective experimental groups and their controls within each line type (*p<0.05, **p<0.01, ***p<0.001; ns, not significant). HDL, high-density lipoprotein; LDL, low-density lipoprotein.
mTOR expression
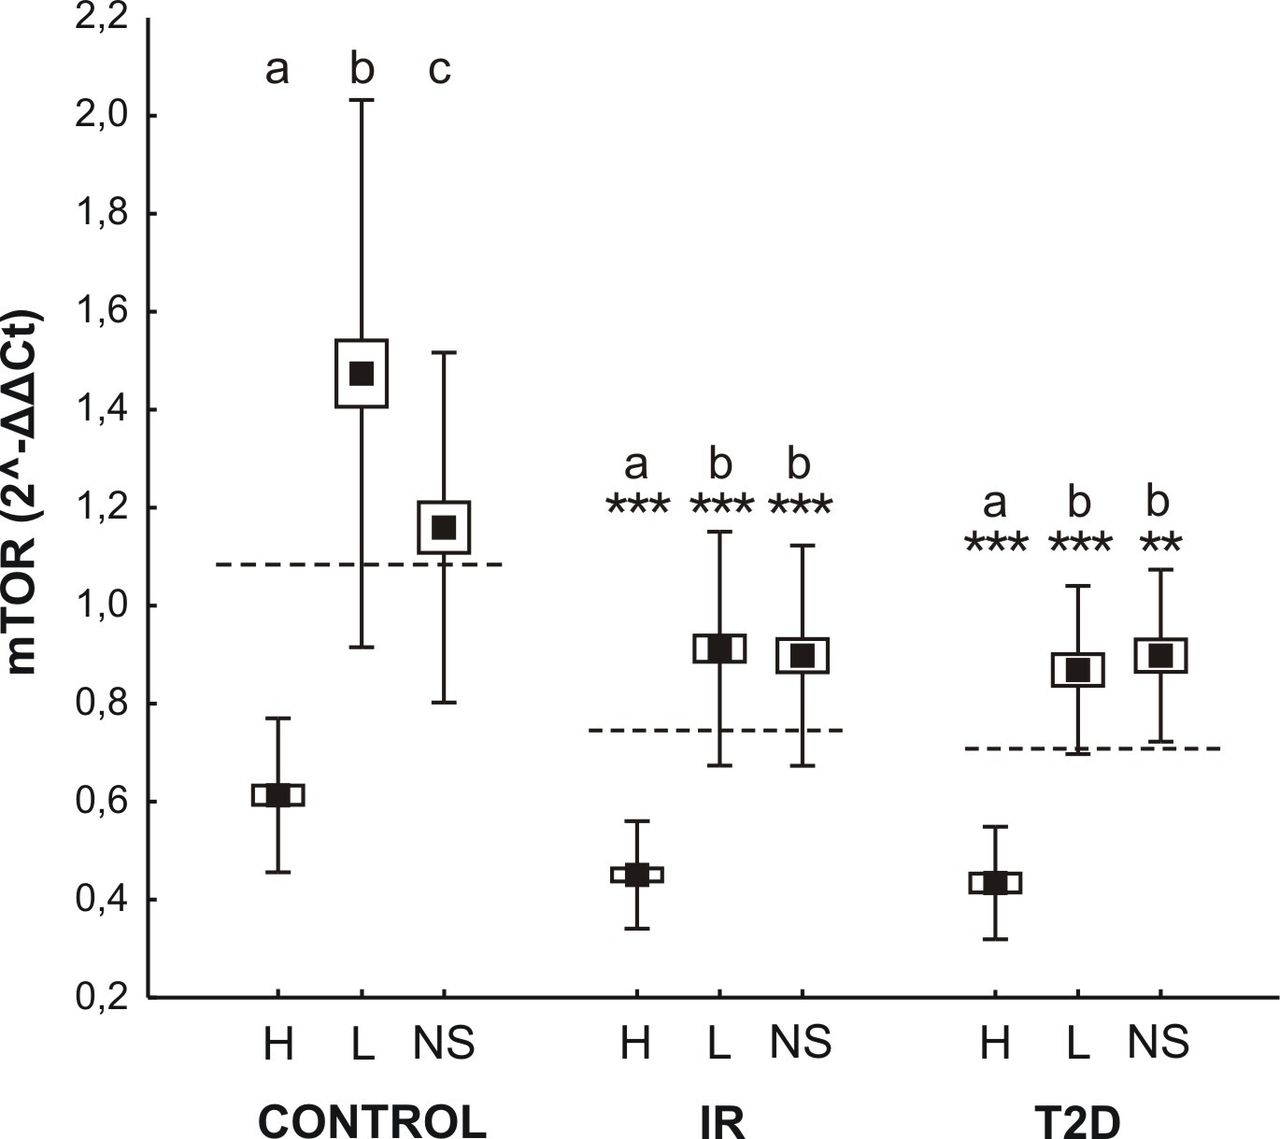
Both the HFD and STZ promoted HFD were characterized by an increase in the expression of mTOR in all metabolic groups (F2,107=71.11; p<0.0001; figure 4). Between-line differences in the amount of mRNA for a specific gene were also observed (F2,107=172.25; p<0.0001), with markedly higher expression in groups characterized by high BMR (figure 4). The line type by group interaction was statistically significant (F4,107=10.92; p<0.0001). Presented results may suggest an enhanced mechanism of glucose turnover in organisms with genetically higher BMR which, in turn, may delay IR and T2D.

mTOR expression in three metabolic lines (H-, L-, NS-; high, low, non selected basal metabolic rate, respectively) of mice originated from insulin resistant (IR), type two diabetes (T2D), and control group. Data are expressed as least square means (solid boxes)±SE (open boxes) with ±doubled SD (whiskers). Dashed lines depict means in each experimental group. a,b,c show significant differences between line types within the control, IR and T2D groups. Asterisks indicate statistical significance of the difference between the respective experimental groups and their controls within each line type (**p<0.01, ***p<0.001).
Discussion
Recent genome-wide association studies have identified more than 90 loci implicated in human obesity and the propensity to develop T2D.8 34 35 Despite this clearly polygenetic nature, the great majority of animal models of human obesity and/or diabetes are purposely monogenetic and therefore mimic only a narrow spectrum of mechanisms underlying T2D progression.21 22 36 37 Most importantly, to our knowledge, none of the mouse models of T2D in use today have been developed with variation of BMR in mind. Since BMR constitutes an important risk factor for development of T2D in humans, the lack of consideration for BMR variation in the animal models may undermine their clinical relevance.11 13 38 As both obesity39 40 and BMR23 are highly heritable, selection on traits directly related to variation in the rate of energy expenditures should provide an ample opportunity for identification of metabolic risk factors of development of T2D. Here, we demonstrated that mice with genetically determined low BMR have higher propensity to spontaneous weight gain and IR, while their high BMR counterparts manifested much slower development of T2D. Thus, the line types of mice used therein may be a useful model for clarification of the mechanisms linking BMR, the major component of human energy budgets, with T2D.
BMR-related glucose changes in high fat and STZ treated mice
Several previous studies have compared glycemic and insulinogenic responses of different strains of mice fed a high fat or regular diet. In general, an increase in fasting glucose level in most HFD models is observed after 4 weeks of treatment, with C57Bl/6J mouse line developing a more severe diabetic phenotype than other lines.37 41 42 In our study, LBMR mice displayed hyperglycemia much faster than the HBMR animals that maintained initial blood sugar levels until the fifth week of the experiment (figure 1B). Furthermore, although STZ application resulted in a rapid development of hyperglycemia in all experimental groups, blood glucose levels were still highest in the LBMR line (figure 1B). Interestingly, the glucose profiles were strongly linked to body mass throughout the experiments, particularly in the L-BMR individuals (figure 1A). Thus, individuals with genetically determined low BMR have much less efficient glucose turnover and are therefore considerably more prone to develop obesity and hyperglycemic states than mice of the other two line types.
Studies on C57BL/6J mice fed HFD revealed that their fast weight gain is due to increased energy intake and linked to a reduced metabolic rate, as compared with the mice fed a normal diet.41 The nature of this reduction was nonetheless unidentified. Recent studies on our selected mouse line types demonstrated that HFD diet causes a significant drop in total spontaneous physical activity (SPA), and ultimately, energy expenditure, which may explain the metabolic reduction observed in Winzell and Ahrén’s study.16 41 Nevertheless, irrespective of the energy density of a diet, HBMR mice manifested higher SPA (or conversely, LBMR mice manifested lower), which indicates the existence of a strong, positive link between BMR and SPA.16 This corresponds well with studies on humans showing that the nexus of low energy expenditures and sedentary lifestyle is associated with reduced activity of lipoprotein lipase, severe dyslipidemia, altered glucose uptake and, finally, IR.5 43 44
Metabolism-related lipid profile in IR and T2D groups
Lipid profile abnormalities are the hallmark of development of obesity and IR.26 44 When compared with controls, all animals studied showed an increasing lipid index under the HFD treatment, except for the level of TGs in H-BMR mice (figure 3). This may suggest that the HBMR animals have a superior ability to use fat, which delays the development of prodiabetic syndromes including hyperlipidemia and enhanced gluconeogenesis. The most likely involved intracellular pathways is that of the mTOR, which plays a fundamental role in de novo lipogenesis through the SREBPB1 dependent pathway in hepatocytes and white adipose tissue.24 26 31 Recent studies on rat models show overexpression of SREBP1 gene in HFD-fed animals.31 Analogically, in our study, we found significantly greater activity of mTOR in both high fat and STZ stimulated mice, particularly in the H-BMR line (figure 4). This suggests that triggered lipogenesis based on the mTOR-SREBPB1 signaling pathway may constitute a significant part of the molecular mechanism underlying genetically determined high BMR, which acts as a compensatory mechanism lowering propensity to the detrimental effects of western-type diet and sedentary lifestyle.12 16 45 Conversely, a reduction in metabolic rate may stimulate weight gain, excess adiposity, and favor the development of IR and T2D.
mTOR and glucose metabolism
The results presented herein demonstrate BMR-related variation in the level of liver mTOR protein, with the HBMR mice manifesting higher mTOR expression than low BMR individuals (figure 4). Moreover, in both selected lines, we found a significant increase in the amount of mTOR mRNA in HFD and T2D groups. As demonstrated in studies using mTOR inhibitors, the reduction of mTOR activity results in a deterioration in carbohydrate balance due to impaired insulin secretion, IR, or a combination of both.27 Inhibition of mTOR is associated with an increased incidence of hyperglycemia and new-onset diabetes, ranging from 13% to 50% in clinical trials.27 46 However, an increase in activity of nutrient and insulin-sensing mTOR pathways stimulate glycolysis, glucose uptake, and glycogen synthesis while reducing protein breakdown and gluconeogenesis mostly in muscle and liver.24 26 Moreover, the mTOR1 complex is a positive regulator of β-cell function, since its constitutive activation in pancreatic cells improves insulin secretion.2 27 It is therefore possible that a significantly higher food consumption rate of the HBMR animals promotes greater concentration of liver mTOR, which in turn, fosters a transition toward catabolic processes enabling the maintenance of high physical activity and increased level of general metabolism.16 23 Such physiological adjustment may then act as a protection shield against disturbances in glucose homeostasis.
However, the effects of mTOR on glucose turnover remain complex, and many studies suggest that its role in promotion and development of IR and T2D is ambiguous.2 24 28 Besides the role of mTOR in restoring patency of carbohydrates homeostasis, its chronic activation may also promote symptoms of IR.2 27 For example, several studies showed that mTOR activity may be elevated in many organs of genetically obese or high-fat fed mice.24 47 Impairment of the PI3K-Akt pathway because of mTOR overactivity disrupts transport of insulin-regulated glucose transporter (GLUT4) to the cell membrane and therefore lowers the efficiency of glucose uptake.2 25 27 It seems that the relationship between mTOR activity and metabolic homeostasis follows a U-shaped curve, where too low or too high activity of mTOR has a deleterious effect on systemic metabolism.2 24
Organismal metabolism as a risk factor for IR and T2D
Although several studies indicate that above average energy intake may constitute a significant risk factor for many diseases (eg, cardiovascular diseases and cancer) or general multimorbidity, the relation between basal/resting metabolism and propensity to weight gain and T2D development in humans is equivocal.7 48 49 However, the majority of studies report phenotypic effects, usually in obese patients often with already diagnosed diabetes of each type.14 18 39 The observed associations between BMR, weight gain, and T2D may be a result of condition-related pathologies (eg, glycosuria and increased protein turnover) rather than genetically determined variation in energy expenditures. Moreover, Anthanont and Jensen50 analyzed a large database of volunteers participating in 17 years of monitoring and found that initial low BMR did not affect weight gain in a typical Western populations that were under study. Although Anthanont and Jensen’s study suggests the lack of causative link between low BMR and subsequent weight gain, their results should be treated with caution, as all other correlative analyses lacking a control of genetic background. To bring progress to this field of study, the animal model presented may significantly contribute toward a better understanding of the causality between metabolic expenditures, body mass gain, and T2D.
Conclusions
There is still much to learn about the contribution of genetically conditioned metabolic rates to the susceptibility to develop metabolism-related diseases. In this study, we demonstrated that the HFD lines of mice divergently selected for BMR are a robust animal model for unraveling the associations between energy expenditures and T2D progression. Low energy expenditures of the L-BMR mice maintained at ad lib conditions and limited locomotory activity faithfully emulate the so-called sedentary lifestyle of the great majority of contemporary humans. H-BMR type mice defy this scenario as they maintain range-stable glucose homeostasis. Undoubtedly, incorporation of BMR-related approach in studies of metabolic diseases, including diabetes, should be of significant importance to indicate patients with predisposition to IR and T2D.
Acknowledgments
The authors are grateful to N Ochman for correcting the English.
References
Footnotes
Contributors SM contributed to the design of the study, performed research, analyzed data, contributed to the discussion, wrote and edited the manuscript; DS and AS performed research and contributed to the discussion; SP, SB, MB, and GN performed research; MK and HC contributed to the design of the study, analyzed data, contributed to the discussion, and reviewed the manuscript. All authors approved the final version of the manuscript. SM is the guarantor of this work and, as such, had full access to all the data in the study and takes responsibility for the integrity of the data and the accuracy of the data analysis.
Funding This work was supported by Miniatura 1-DEC_2017/01/X/NZ4/00315 from the National Science Center, Poland.
Competing interests None declared.
Patient consent for publication Not required.
Ethics approval All procedures were approved by the Local Ethical Committee on Testing Animals in Olsztyn (approval 22/2017).
Provenance and peer review Not commissioned; externally peer reviewed.
Data availability statement Data are available on reasonable request.