Article Text

Abstract
Introduction Diabetes-associated endothelium dysfunction might be linked to disturbances in Ca2+ homeostasis. Our main objective is to reveal the potential mechanisms by which high-glucose (HG) exposure promotes increased proliferation of human coronary artery endothelial cells (HCAECs) in culture, and that store-operated Ca2+ entry (SOCE) and insulin-like growth factor binding protein 3 (IGFBP3) contribute to this proliferation.
Research design and methods We detected the expression levels of Ca2+ release-activated calcium channel proteins (Orais), IGFBP3 and proliferating cell nuclear antigen of HCAECs cultured in HG medium for 1, 3, 7, and 14 days and in streptozotocin-induced diabetic mouse coronary endothelial cells. Coimmunoprecipitation and immunofluorescence technologies were used to detect the interactions between Orais and IGFBP3 of HCAECs exposed to HG environment, and to detect IGFBP3 expression and proliferation after treatment of HCAECs cultured in HG medium with an agonist or inhibitor of SOCE. Similarly, after transfection of specific small interfering RNA to knock down IGFBP3 protein expression, SOCE activity and Orais expression were tested. Some processes related to endothelial dysfunction, such as migration, barrier function and adhesion marker expression, are also measured.
Results HG exposure promoted increased proliferation of HCAECs in culture and that SOCE and IGFBP3 contributed to this proliferation. In addition, we also found that Orais and IGFBP3 were physically associated and regulated each other’s expression levels. Besides, their expression levels and interactions were enhanced in HCAECs after exposure to HG. HG exposure promotes cell migration, but reduces barrier function and adherens junction protein expression levels in HCAECs.
Conclusion Orais and IGFBP3 formed a signaling complex that mediated HCAEC proliferation during HG exposure in culture. Meanwhile, we also found that SOCE stimulates proliferation of HCAECs by regulating IGFBP3, thereby promoting the occurrence and progression of coronary atherosclerosis in diabetes. It is worth noting that our findings may shed new light on the mechanisms of increased proliferation in HCAECs in diabetes and suggest the potential value of SOCE and IGFBP3 as therapeutic targets for coronary atherosclerosis in individuals with diabetes.
- diabetes complications
- cell proliferation
- calcium channels
This is an open access article distributed in accordance with the Creative Commons Attribution Non Commercial (CC BY-NC 4.0) license, which permits others to distribute, remix, adapt, build upon this work non-commercially, and license their derivative works on different terms, provided the original work is properly cited, appropriate credit is given, any changes made indicated, and the use is non-commercial. See: http://creativecommons.org/licenses/by-nc/4.0/.
Statistics from Altmetric.com
Significance of this study
What is already known about this subject?
Imbalanced growth of vascular endothelial cells is one of the important causes of vascular disease complicated by hyperglycemia.
What are the new findings?
Store-operated Ca2+ entry (SOCE) and insulin-like growth factor binding protein 3 (IGFBP3) are involved in the regulation of coronary artery endothelial cell proliferation under high-glucose environment.
In coronary artery endothelial cells, Orais, key channel proteins of SOCE, interact with IGFBP3, and the interactions are enhanced under high glucose.
In coronary artery endothelial cells, Orais can regulate the expression of IGFBP3, and IGFBP3 can also regulate the expression of Orais and activity of SOCE.
How might these results change the focus of research or clinical practice?
The Orais-IGFBP3 complex plays an important role in the abnormal proliferation of coronary artery endothelial cells caused by high glucose.
Targeting the Orais-IGFBP3 complex could slow down the occurrence and development of atherosclerosis in patients with diabetes.
Introduction
The risk of heart and blood vessel disease is apparently higher in people with diabetes mellitus (DM) compared with individuals without DM. Cardiac and vascular complications account for 70% of diabetes-associated death, making these complications the leading cause of death in DM.1 A major component of DM-associated coronary artery disease is coronary microvascular dysfunction. Although the pathogenesis underlying this dysfunction is incompletely understood, DM-induced progressive endothelial dysfunction is thought to be a key player in this process. Abnormal proliferation and apoptosis of endothelial cells are involved in endothelial dysfunction, damage, and repair, thus contributing to the premature development of atherosclerosis and vascular complications in diabetes. Therefore, it is important to understand the influence of currently used antidiabetic and cardioprotective agents on endothelial function.
Some studies have reported that the diabetes-associated endothelium dysfunction may be linked to disturbances in Ca2+ homeostasis.2 3 Store-operated Ca2+ entry (SOCE) secondary to depletion of the endoplasmic reticulum (ER) Ca2+ stores is a principal mechanism thought to underpin endothelium-dependent responses to agonists. Inhibitors of the sarcoplasmic ER Ca2+-ATPase deplete Ca2+ stores by preventing ER Ca2+ uptake and induce increased Ca2+ influx and intracellular Ca2+ concentration rise, which contribute to regulation of vascular endothelial cell functions. Some studies have reported that prolonged exposure of endothelial cells to a medium with high glucose (HG) increases SOCE and the abundance of Ca2+ release-activated calcium channel (Orai1–3) and stromal interaction molecule (STIM) 1–2 proteins.4–6
Insulin-like growth factor binding protein 3 (IGFBP3) is the most abundant IGFBP. Although it binds to IGF1 (insulin-like growth factor-1) to elicit multiple physiological functions,7–9 IGFBP3 also has actions independent from IGF1.10 11
Elucidation of the molecular mechanisms underlying endothelial physiology is crucial for a better understanding of the pathophysiology involved in endothelial dysfunction in diabetes. Because SOCE and IGFBP3 contribute to regulation of endothelial function induced by HG, the aims of the present study were to investigate whether IGFBP3 and SOCE interact in coronary endothelial cells, and if so what roles these interactions may play in hyperglycemia and diabetes.
Materials and methods
Cell culture and cell transfection
Human coronary artery endothelial cell (HCAEC) line was obtained from KINDU (Shanghai, China) and cultured in Dulbecco’s modified Eagle medium supplemented with 10% fetal bovine serum, 100 µg/mL penicillin, and 100 units/mL streptomycin. HCAECs were cultured at 37℃ in a humidity-controlled incubator with 5% CO2. The HG medium contained 25 mM D-glucose. For the normal glucose (NG) osmotic control group, 19.5 mM α-mannitol was added to the culture medium containing 5.6 mM D-glucose. The media were changed every 3 days. HCAECs were cultured for 1, 3, 7, or 14 days in NG or HG medium prior to experiments. The specific conditions for each experiment are described in the figure legends.
HCAECs were seeded in plates. A small interfering RNA (siRNA) against human IGFBP3 (siIGFBP3: 5′-GCACAGAUACCCAGAACUUUU-3′) was chemically synthesized by Shanghai GenePharma (Shanghai, China). Specific knockdown of IGFBP3 was achieved by transfecting HCAECs with IGFBP3 siRNA (200 nM) using Lipofectamine 3000 and Opti-MEM (Invitrogen; Thermo Fisher Scientific) and incubating the cells for 48 hours according to the manufacturer’s instructions. A scrambled siRNA was used as negative control. Cell viability and proliferation, western blot analysis, and measurement of intracellular Ca2+ concentration experiments were performed 48 hours post-transfection.
Western blotting and coimmunoprecipitation assay
The whole-cell lysates from HCAECs were extracted with lysis buffer (in mM: 20 Tris, 150 NaCl, 1 EDTA, 1 EGTA (ethylene glycol-bis-(beta-aminoethyl ether)-N,N,N',N'-tetraacetic acid), 1% Triton, 0.1% SDS (sodium dodecyl sulfate), and 1% protease inhibitor cocktail; pH 7.4). The samples were fractionated by 7.5% SDS-PAGE (sodium dodecyl-sulfate polyacrylamide gel electrophoresis), transferred to PVDF (Polyvinylidene Fluoride) membranes and probed with the indicated primary antibodies at 1:250 dilution in a PBST (phosphate buffer solution with 0.05% Tween 20) buffer that contained 0.1% Tween-20 and 5% non-fat dry milk. Primary antibodies included anti-IGFBP3 (Affinity Biosciences, Ohio, USA), Orai1–3 (ProteinTech Group, Chicago, Illinois, USA), STIM1 (Affinity Biosciences), caspase 3 (Affinity Biosciences), Bax (Affinity Biosciences), Bcl-2 (Affinity Biosciences), vascular endothelial cadherin (VE-cadherin; Affinity Biosciences), or proliferating cell nuclear antigen (PCNA) (Affinity Biosciences), a marker commonly used to indicate cell proliferation (diluted 1:250). The immunosignals were visualized using an enhanced chemiluminescence plus detection system (Peiqing, Shanghai, China). The results were analyzed quantitatively using Quantity One analysis software (Bio-Rad). The optical density of each blot was normalized to that of β-tubulin or glyceraldehyde 3-phosphate dehydrogenase analyzed in the same lane and is presented as relative optical density.
Coimmunoprecipitation and immunoblots were as described previously.12 Briefly, the HCAECs were lysed on ice with protein lysis buffer and then centrifuged at 12 000 rpm (revolutions per minute) at 4°C for 20 min. IGFBP3 or Orai1–3 proteins were immunoprecipitated by incubating 800 µg of extracted proteins with 5 µg of anti-IGFBP3 or anti-Orai1–3 antibodies on a rocking platform overnight at 4℃. Protein A agarose was then added and incubated for an additional 3 hours at 4℃. The immunoprecipitates were washed with cell lysis solution three times before cell lysates (100 µL) and loading buffer (25 µL) were added. The sample was boiled at 100℃ for 10 min, and the obtained supernatant was used for protein electrophoresis followed by western blotting.
Cell viability and proliferation
HCAECs were seeded in 96-well plates at a density of 2.0×10⁴/cm2 and cultured for 24 hours. A Cell Count Kit-8 (CCK-8) (Vazyme, Nanjing, China) was used to assess cell viability. Briefly, 10 µL of CCK-8 in 100 µL of medium was added to the cells in each well and incubated for 1 hour at 37°C. The amount of formazan dye produced, which is directly proportional to the number of living cells, was detected at an absorbance wavelength of 450 nm and quantified using an automatic enzyme-labeling instrument (Rayto, Shandong, China).
Generation of a mouse model of diabetes
Male C57BL/6J mice (18–20 g) were obtained from the Experimental Animal Center of Anhui Medical University and used in accordance with the guidelines of the US National Institutes of Health (publication no 8523). Twelve mice were obtained at 4 weeks of age, randomized and blinded to the model group (n=6) or normal control group (n=6). The mice in the model group were fasted for 12 hours and then injected intraperitoneally with 40 mg/kg streptozotocin (STZ; Biosharp). The STZ solution was dissolved to a solution of 2% STZ with citrate buffer (0.01 M) at pH 4.2 and filter-sterilized through a 0.22 µm microporous membrane. Mice were injected with STZ once a day for 5 days. The normal control group was fasted for 12 hours and then injected with an equivalent volume of citrate buffer during the same period. One week after the last injection, blood glucose measurements were obtained daily. Mice in the model group with fasting blood glucose levels higher than 11.1 mM for 3 consecutive days were selected for the study. All mice were supplied ample food and water. All experiments were performed after 8 weeks from when the animals first received an STZ injection.
Immunohistochemistry assay
The methods were similar to those described elsewhere.13 Briefly, mice were humanely euthanized via inhalation of CO2. The heart tissues were excised and fixed for 24 hours in 4% paraformaldehyde (Ebiogo, Hefei, China). The samples were dehydrated through a series of graded ethanol and embedded in paraffin using standard methods. Tissues were sectioned at a thickness of 5 µm. After being dewaxed, the sections were placed in distilled water, and antigen retrieval was achieved by heating. After the sections cooled naturally, they were washed with PBS (phosphate buffer solution) (pH 7.4) and incubated with 3% hydrogen peroxide solution at 37℃ for 30 min. The sections were again washed in PBS and incubated in a humid chamber with a blocking solution for 30 min. After this, the sections were incubated with or without primary antibodies for anti-IGFBP3, Orai1–3, or PCNA (diluted 1:250) at 4°C overnight. The sections were washed with PBS and incubated with a horseradish peroxidase-labeled secondary antibody. Sufficient 3,3′-diaminobenzidine to cover the section was added. The rinsed sections were counterstained with hematoxylin for 15 s and then mounted onto glass slides. Histological images were obtained using a digital camera mounted on an Olympus BX51 microscope (Olympus).
Immunofluorescence assay
HCAECs were seeded on cover glass at an appropriate density and cultured in an incubator. After being washed with PBS, the cells were fixed with 4% paraformaldehyde and permeabilized with 0.2% Triton X-100 and 3% BSA (Bovine Serum Albumin) at room temperature. They were blocked for 30 min, washed with PBS, and incubated with anti-IGFBP3 or Orai1–3 primary antibodies overnight at 4°C in a humid chamber. An FITC (fluorescein isothiocyanate)-conjugated secondary antibody (diluted 1:100; Invitrogen) was incubated with the cells for 2 hours at room temperature. The nucleus of the cells was labeled with DAPI (4',6-diamidino-2-phenylindole). The immunofluorescence signals were detected and captured using an LSM 880 confocal microscopy system (Zeiss, Germany).
Measurement of intracellular Ca2+ concentration
HCAECs were plated on 30 mm glass cover slips. The changes in cytosolic Ca2+ concentration ([Ca2+]i) were measured after HCAECs were treated with the HG medium. HCAECs were incubated with 6 µM Fluo-8 AM and 0.02% Pluronic F-127 (Invitrogen) for 30 min in an incubator. Subsequently, the Ca2+ stores were depleted by treatment with 2 µM thapsigargin (TG) or 100 µM ATP for 10 min in a Ca2+-free saline solution (in mM: NaCl 118, KCl 4.7, MgSO4 1.2, KH2PO4 1.2, NaHCO3 25, and glucose 11.1, at pH 7.4). Ca2+ influx was induced by the application of 2 mM extracellular Ca2+. Fluorescence was detected and recorded using a fluorescence microscope (Nikon T200, Tokyo, Japan) having a xenon lamp with excitation and emission wavelengths of 488 and 515 nm, respectively. The [Ca2+]i changes were analyzed as the ratio of the fluorescence intensity after the extracellular Ca2+ addition relative to the intensity before the application of extracellular Ca2+ (F1/F0).
Monolayer permeability assays
Permeability of HCAECs was performed using confluent monolayers after being cultured in NG or HG medium for 7 days. Transendothelial electrical resistance (TER) of the confluent monolayers was measured using a Millicell ERS-2 (Millipore, USA). The HCAEC monolayers were treated with ATP (100 µM) or BTP2 (N-[4-[3,5-Bis(trifluoromethyl)-1H-pyrazol-1-yl]phenyl]-4-methyl-1,2,3-thiadiazole-5-carboxamide) (10 µM). The TER of HCAEC monolayers was calculated using the following equation: TER (Ω/cm2 monolayer)=(average resistance of well–average resistance of blank well) (Ω)×area (cm2 monolayer). The integrity of the confluent monolayers was investigated by measuring the permeability of fluorescein isothiocyanate-dextran (FD20 was purchased from Sigma, USA) solution (25 mg/mL in DMEM (Dulbecco's Modified Eagle's medium) NG or HG medium) at different time intervals (5 min, 10 min and 20 min). The medium on the apical side of the transwell chamber was replaced with 200 µL of FD20 solution. Then the transwell inserts were moved into new wells with 500 µL control medium containing the SOCE agonist ATP (100 µM) or the SOCE inhibitor BTP2 (10 µM). Thirty minutes after incubation, 100 µL medium was aspirated from the apical or basolateral compartments for determination of fluorescence intensity using a fluorescent microplate reader (Flexstation 3, Molecular Devices, USA) (excitation/emission of 492/515 nm, slit width=1.5 nm, slit width=10 nm). The permeability of the confluent monolayers is expressed as the fluorescence intensity of FD20.
Migration assays
The HCAECs were cultured to confluent monolayers after in NG or HG medium for 7 days and starved overnight. The cell monolayers were scratched using sterile 200 µL pipette tips. The wounded monolayers were incubated in the control medium containing the SOCE agonist ATP (100 µM) or the SOCE inhibitor BTP2 (10 µM) for 30 min. The migration of HCAECs was photographed 24 hours after scratching at the same location along the scratched edges with an inverted microscope. The results are expressed as (S0−St)/S0, where S0 indicates the area of the scratched edges at the beginning, and St indicates the area of the scratched edges after treatment.
Statistical analysis
Data are expressed as mean±SEM of the indicated number of samples. Statistical analyses of t-tests were performed using GraphPad Prism V.5 software (GraphPad Software, San Diego, California). A two-sided value of p<0.05 was considered statistically significant.
Results
Effect of HG exposure on coronary artery endothelial cell proliferation and viability
We used an HG medium (containing 25 mM D-glucose) to mimic diabetic hyperglycemia in vitro and an NG medium (containing 5.6 mM D-glucose and 19.5 mM α-mannitol) as a control. After culturing HCAECs in NG or HG medium for various times, we used western blotting to investigate the change in the expression level of the PCNA protein, a marker of cell proliferation. As shown in figure 1, the PCNA protein expression level was significantly increased in HG-cultured HCAECs on days 3, 7, and 14 compared with cells cultured in NG medium during the same periods (figure 1A–E). PCNA expression was significantly increased in coronary artery endothelial cells of STZ-induced diabetic mice by immunohistochemistry (figure 1F,G). HCAEC viability was determined using CCK-8 assay. Cell viability increased with HG exposure at 7 and 14 days and was highest at 7 days (figure 1H). These results suggested that HG exposure increased HCAEC proliferation, and this effect was time-dependent. Therefore, subsequent experiments examining underlying mechanisms used HCAECs cultured in HG medium for 7 days. There was no significant difference in the effect of HG exposure on apoptotic proteins (Bax/Bcl-2, caspase 3) (p>0.05), as shown in online supplemental figure 1A–D.
Supplemental material
Supplemental material

HG exposure increases viability and proliferating cell nuclear antigen (PCNA) protein expression level in HCAECs and coronary artery endothelial cells of streptozotocin-induced diabetic mice. PCNA protein expression levels in HCAECs cultured in HG (for 1, 3, 7, and 14 days). Representative western blot images (A) and summary data (B–E) of PCNA protein levels in HCAECs cultured in NG medium (5.6 mM+19.5 mM α-mannitol) or HG medium (25 mM). β-tubulin was used as the loading control. (F) Representative images of coronary artery endothelium immunostaining (brown; eg, red arrowheads) for protein expression levels of PCNA. (G) Quantification of PCNA protein expression levels in the coronary artery endothelium of a mouse model of DM and control mice. (H) Results of Cell Count Kit-8 assay detection of living HCAECs exposed to HG for 1, 3, 7, or 14 days. Values are mean±SEM (n=6–8 samples). *P<0.05, **P<0.01, ***P<0.001 compared with NG-cultured cells or control group. DM, diabetes mellitus; HCAECs, human coronary artery endothelial cells; HG, high glucose; IOD, integrated optical density; NG, normal glucose; OD, optical density.
Effect of HG exposure on SOCE and expression level of IGFBP3 protein in coronary artery endothelial cells, and the contribution of SOCE and IGFBP3 to regulating HCAEC proliferation and viability
Previous studies have reported that HG medium markedly enhances SOCE in some cell types, such as in neonatal rat ventricular muscle cells and mesangial cells.14 15 Thus, to investigate the role of SOCE in the increased proliferation and viability of HCAECs induced by HG, we cultured HCAECs in NG or HG medium for 7 days and then determined SOCE levels as well as Orai1–3 and STIM1 protein expression levels before and at various times after different treatments. As shown in figure 2A–D, treatment of HCAECs with 2 µM TG, an ER Ca2+-ATPase inhibitor, or with 100 µM ATP resulted in a rapid rise in intracellular Ca2+ levels, consistent with the depletion of ER Ca2+ stores. Subsequent addition of 2 mM Ca2+ to the extracellular bath solution triggered an increase in the Ca2+ level, consistent with Ca2+ influx from the extracellular solution, as SOCE. The Ca2+ influx in HCAECs cultured in HG for 7 days was markedly increased and sustained relative to that in cells cultured in NG (figure 2B,D); however, the SOCE of HG-cultured HCAECs for 1, 3, or 14 days did not change compared with that in HCAECs cultured in NG for the same time (online supplemental figure 2A–F). These results suggested that HG exposure increased SOCE in HCAECs. We next investigated whether HG exposure enhanced the expression levels of key proteins that mediate SOCE. Orais are the pore-forming protein of store-operated calcium channels,16 and STIM1 has been shown to be a key component of SOCE by gating SOCE as a Ca2+ sensor in the ER.17 As shown in figure 2E–L, cells cultured in HG medium for 7 days had significantly higher protein expression levels of Orai1–3, but not of STIM1, compared with cells cultured in NG. However, expression levels of Orais and STIM1 proteins are not significantly changed in HCAECs cultured in HG compared with NG for 1, 3, or 14 days (online supplemental figure 3A–F). Orai1–3 expression was significantly increased in coronary artery endothelial cells of STZ-induced diabetic mice (figure 2M–R). The SOCE activator ATP increased PCNA expression level and cell viability, whereas the SOCE inhibitor BTP2 decreased PCNA expression level and viability of HCAECs cultured in either NG or HG (figure 2S–U). In addition, ATP and BTP2 did not affect apoptosis-related expression, as shown in online supplemental figure 1E–H.

Orai1–3 protein and IGFBP3 expression levels and SOCE activity are significantly increased in HCAECs cultured in HG for 7 days and coronary artery endothelial cells of streptozotocin-induced diabetic mice with no change in STIM1 expression levels; increased Orais promotes proliferation of HCAECs and decreased IGFBP3 reduces proliferation of HCAECs. (A, C) Representative traces and (B, D) summary data showing the maximum increase in SOCE in HG-cultured HCAECs. After treatment of HCAECs with either 2 µM TG or 100 µM ATP for 10 min, application of 2 mM Ca2+ induces significant increase in [Ca2+]i through SOCE. (E, G, I, K, A') Representative western blot images and (F, H, J, L, B'–E') summary data showing Orai1, Orai2, Orai3, STIM1 and IGFBP3 expression levels in HCAECs cultured in NG or HG medium. (M, O, Q, F') Representative images of coronary artery endothelium immunostaining (brown; eg, red arrowheads) for protein expression levels of Orai1–3 and IGFBP3 in a mouse model of DM and control mice. Magnification, ×400. Scale bar, 50 µm, applies to all panels. (N, P, R, G') Quantification of Orai1–3 and IGFBP3 protein expression levels in the coronary artery endothelium of a mouse model of DM and control mice. (S) Representative western blot images and (T) summary data showing PCNA protein expression levels in HCAECs cultured in HG or NG medium for 7 days in the presence or absence of the SOCE agonist ATP (100 µM) or the SOCE inhibitor BTP2 (10 µM). (H') Representative western blot images and (I') summary data showing IGFBP3 siRNA knockdown of PCNA protein level. (U) Viability of HCAECs cultured in NG or HG medium for 7 days in the presence or absence of ATP (100 µM) or BTP2 (10 µM) as detected using the CCK-8 assay. (J') Results of CCK-8 assay examining HCAEC viability after cells were cultured in either NG or HG medium for 7 days and then transfected with either IGFBP3-specific siRNA or scrambled siRNA. β-tubulin or GAPDH was used as loading controls. Values represent mean±SEM (n=4–21 samples). *P<0.05, **P<0.01, ***P<0.001 compared with NG-cultured cells or control groups. BTP2, N-[4-[3,5-Bis(trifluoromethyl)-1H-pyrazol-1-yl]phenyl]-4-methyl-1,2,3-thiadiazole-5-carboxamide; CCK-8, Cell Count Kit-8; DM, diabetes mellitus; GAPDH, glyceraldehyde 3-phosphate dehydrogenase; HCAECs, human coronary artery endothelial cells; HG, high glucose; IGFBP3, insulin-like growth factor binding protein 3; IOD, integrated optical density; NG, normal glucose; PCNA, proliferating cell nuclear antigen; siRNA, small interfering RNA; SOCE, store-operated Ca2+ entry; STIM1, stromal interaction molecule 1; TG, thapsigargin.
The expression level of IGFBP3 protein was significantly increased in HCAECs cultured for 7 days in HG versus NG media (figure 3A'–E'). In STZ-induced diabetic mice, IGFBP3 expression was significantly increased in coronary artery endothelial cells (figure 2F', G'). We then examined the effects of a human siRNA specific to IGFBP3 and found that this siRNA significantly and substantially knocked down the expression of IGFBP3 compared with the levels after transfection with a scrambled siRNA (online supplemental figure 4). IGFBP3 knockdown reduced PCNA protein expression level and viability of HCAECs cultured in HG medium, but not NG medium, for 7 days compared with those following transfection of scrambled siRNA (figure 3H'–J').
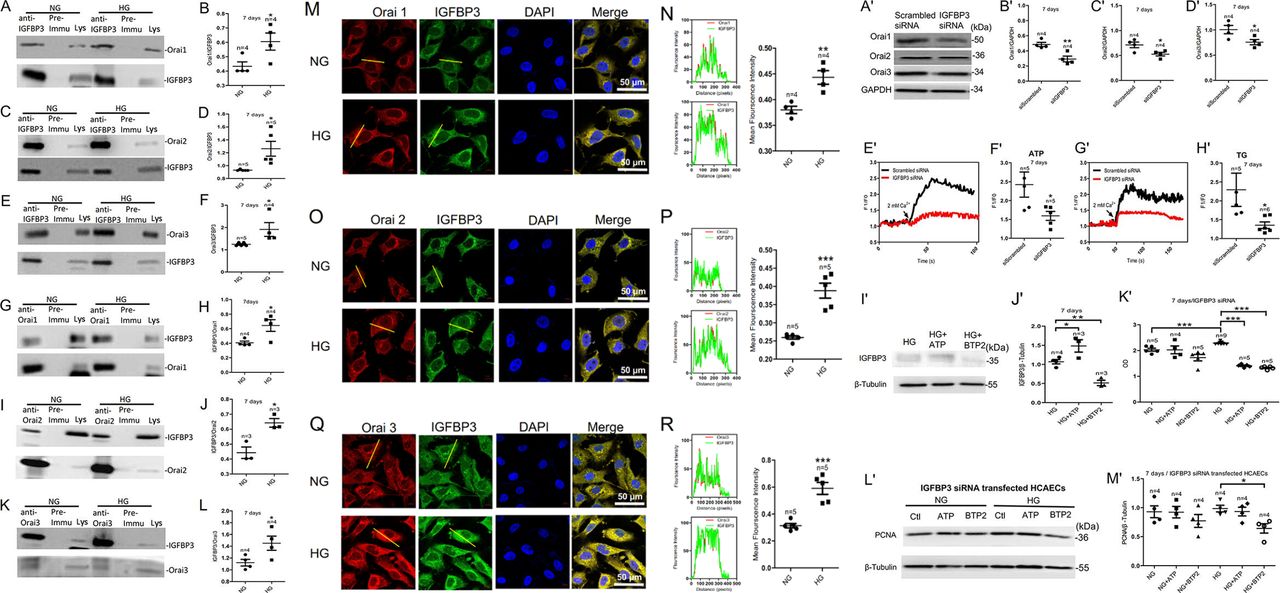
Physical interactions between the Orais and IGFBP3 proteins as examined by coimmunoprecipitation and immunofluorescence assays; SOCE regulates the expression level of IGFBP3 protein, which regulates the expression level of the Orai proteins in HCAECs cultured in HG medium. (A, C, E) HCAECs were cultured in HG medium for 7 days and then subjected to immunoprecipitation. Assays positive for Orai1, Orai2, or Orai3 proteins were used to pull down IGFBP3. (G, I, K) For reverse coimmunoprecipitation, immunoprecipitation assays positive for IGFBP3 were used to pull down Orai1, Orai2, or Orai3. (B, D, F, H, J, L) Summary data showing the statistical results of the corresponding coimmunoprecipitations. (M, O, Q) Representative confocal microscopy images showing co-localization analysis of anti-Orai1, 2, or 3 antibodies (red) and anti-IGFBP3 antibody (green). HCAECs were cultured in HG medium for 7 days and then fixed and incubated with the anti-Orai antibodies (red) and the anti-IGFBP3 antibody (green) and imaged using confocal microscopy. Representative confocal microscopy images of each antibody and the final merged images are shown. Nuclei are labeled blue with DAPI. (N, P, R) Fluorescence intensity profiles and summary data of anti-Orai antibodies (red) and the anti-IGFBP3 antibody (green) in the regions delineated by the corresponding yellow line. Scale bar, 10 mm. Co-localization area per cell was quantified using ImageJ. Representative western blot images (A') and summary data (B'–D') showing expression levels of the Orai proteins and SOCE activity induced by 100 µM ATP or 2 µM TG in HCAECs cultured in HG medium for 7 days after transfection with IGFBP3-specific siRNA or scrambled siRNA (siScrambled). Representative traces (E', G') and summary data (F', H') showing ATP-induced or TG-induced SOCE activity in HG-cultured HCAECs. Representative western blot images (I') and summary data (J') of IGFBP3 expression level in HCAECs cultured in HG medium for 7 days after the addition of the SOCE agonist ATP (100 µM) or the SOCE inhibitor BTP2 (10 µM). The same amount of solvent (ATP solvent was ddH2O (deionized distilled water); BTP2 solvent was DMSO (Dimethyl sulfoxide)) was used as control. (K') CCK-8 assay was used to detect the viability of HCAECs transfected with IGFBP3 siRNA (siIGFBP3) and cultured in medium with NG or HG for 7 days and treated with the SOCE agonist ATP (100 µM) or the SOCE inhibitor BTP2 (10 µM). Representative western blot images (L') and summary data (M') showing the expression levels of PCNA protein in HCAECs transfected with IGFBP3 siRNA and cultured in NG or HG medium for 7 days and then treated with ATP (100 µM) or BTP2 (10 µM). Values are mean±SEM (n=3–9 samples). *P<0.05, **P<0.01, ***P<0.001 compared with NG-cultured cells or control groups. BTP2, N-[4-[3,5-Bis(trifluoromethyl)-1H-pyrazol-1-yl]phenyl]-4-methyl-1,2,3-thiadiazole-5-carboxamide; CCK-8, Cell Count Kit-8; DAPI, 4',6-diamidino-2-phenylindole; GAPDH, glyceraldehyde 3-phosphate dehydrogenase; HCAECs, human coronary artery endothelial cells; HG, high glucose; IGFBP3, insulin-like growth factor binding protein 3; NG, normal glucose; PCNA, proliferating cell nuclear antigen; siRNA, small interfering RNA; SOCE, store-operated Ca2+ entry; TG, thapsigargin.
These data demonstrated that SOCE and IGFBP3 contributed to the regulation of HG stimulation-induced increased proliferation and viability of HCAECs.
Physical association of IGFBP3 and Orai channels in HCAECs, the effect of HG on this association, and the roles of IGFBP3-Orai signaling complexes in proliferation and viability of HCAECs cultured in HG medium
To detect whether IGFBP3 and the Orai channel proteins physically interact and the effect of HG exposure on any interaction, we preformed coimmunoprecipitation and double immunofluorescence assays. In coimmunoprecipitation experiments, the anti-IGFBP3 antibody pulled down Orai1, 2, or 3 in protein lysates freshly prepared from HCAECs (figure 3A–F). Furthermore, the anti-Orai1, 2, or 3 antibody reciprocally pulled down IGFBP3 (figure 3G–L). In control experiments in which immunoprecipitation was performed with IgG purified from preimmune serum, no band was observed. In addition, following HG exposure of the cells for 7 days, the ratio of the interactions between IGFBP3 and Orai1, 2, or 3 significantly increased (figure 3A–L). The selective interaction of IGFBP3 with Orai1, 2, or 3 was supported by double immunofluorescence assays. Immunofluorescence signals for IGFBP3 and for Orai1, 2, or 3 were observed in HCAECs cultured in NG or HG medium (figure 3M–R). Overlaying the IGFBP3 signal (green) with that of the Orai1, 2, or 3 signal (red) showed clear co-localization (yellow) of IGFBP3 and Orai1, 2, or 3 (figure 3M, O and Q) in the plasma membrane and cytosol. In agreement with our coimmunoprecipitation data, HG increased the strength of the signals for IGFBP3 and Orai1, 2, or 3 as well as the merged signal indicating co-localization of IGFBP3 and Orai1, 2, or 3 in HCAECs (figure 3N, P and R). Taken together, these data indicated that IGFBP3 physically associated with Orai1, 2, or 3 in HCAECs, and that HG exposure not only increased the expression levels of IGFBP3 and Orai1, 2, or 3 but also increased the interactions between these proteins.
We assessed whether the association between IGFBP3 and the Orai channel proteins was functional by examining their contributions to the HG effect on regulation of proliferation and viability of HCAECs. To examine whether there was association between SOCE and IGFBP3, we used the specific IGFBP3 siRNA as well as an activator and inhibitor of SOCE. As shown in figure 3A'–H', IGFBP3 knockdown not only markedly reduced the expression levels of the Orai channel proteins (the key components of SOCE) (figure 3A'–D') but also substantially and significantly decreased ATP-induced or TG-induced SOCE (figure 3E'–H') in the HG-cultured HCAECs. The expression levels of the IGFBP3 protein were enhanced by the SOCE activator ATP and were reduced by the SOCE inhibitor BTP2 in cultured HCAECs (figure 3I',J'). These data suggested that IGFBP3 and the Orai channels formed signaling complexes and that these proteins regulated the expression levels as well as the functions of each other.
Figure 2S–U and figure 3K'–M' show that ATP increased and BTP2 decreased proliferation and viability in NG-cultured and HG-cultured HCAECs. However, knockdown of IGFBP3 decreased the ATP-induced or HG-induced increase in viability and proliferation. IGFBP3 knockdown also blocked the BTP2-induced decrease in viability and proliferation of HCAECs (figure 3K'–M'). Taken together, these results indicated that SOCE and IGFBP3 formed a signaling complex that contributed to the regulation of HG-stimulated increased proliferation and viability of HCAECs.
Roles of IGFBP3-Orai signaling complexes in some processes related to endothelial dysfunction such as adhesion marker expression, barrier function and migration of HCAECs cultured in HG medium
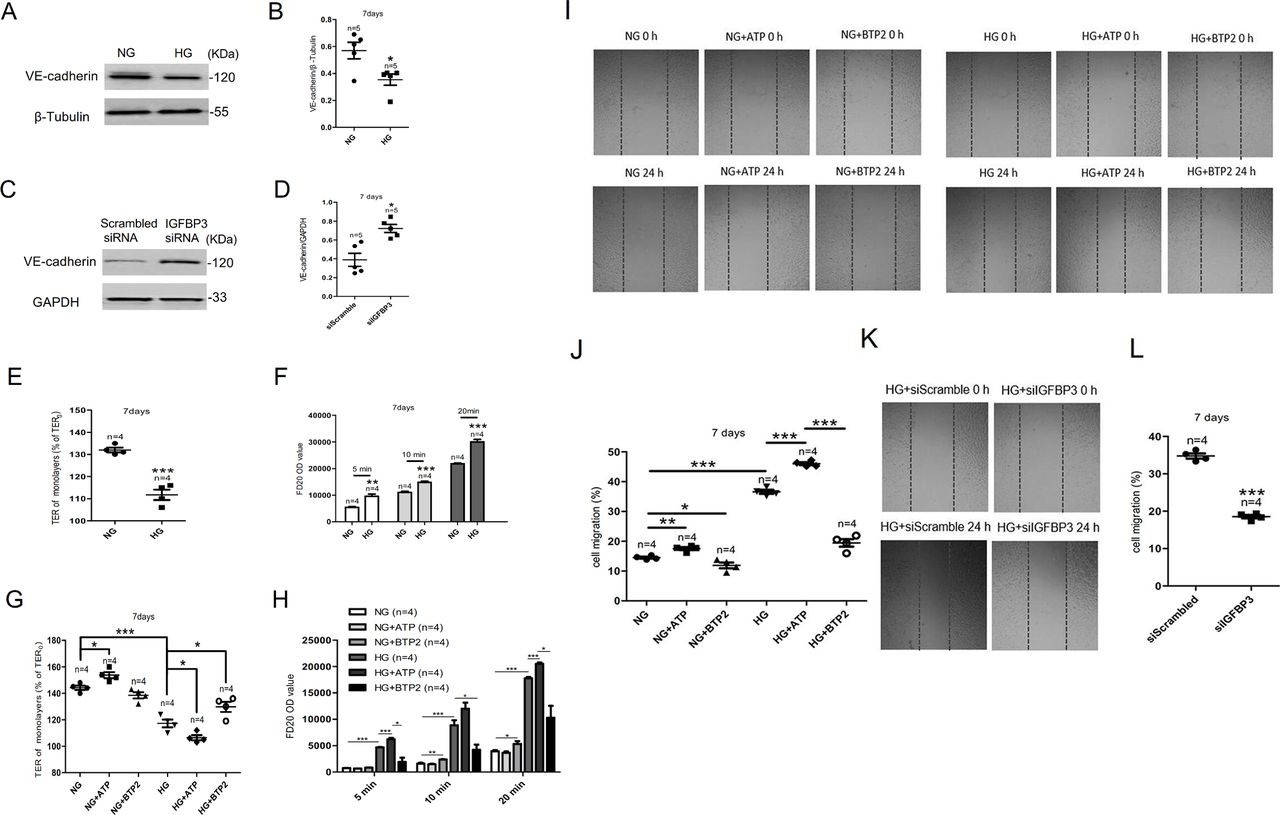
VE-cadherin is a vascular endothelial-specific adherens junction protein related to cell–cell permeability.18 To explore the effect of HG exposure on VE-cadherin expression, western blotting was carried out after HCAECs were cultured in HG for 7 days. As shown in figure 4A,B, VE-cadherin expression decreased in HCAECs. IGFBP3 knockdown markedly enhanced the expression levels of VE-cadherin (figure 4C,D).

The IGFBP3-Orai signaling complexes affected the endothelial barrier and migration of HCAECs. (A) Representative western blot images and (B) summary data showing VE-cadherin expression level in HCAECs cultured in NG or HG medium. (C) Representative western blot images and (D) summary data showing IGFBP3 siRNA knockdown of VE-cadherin level. (E) High glucose-induced TER was examined via transendothelial electrical resistance in vitro after HCAECs were cultured in HG medium for 7 days. (F) FD20 permeability was tested in monolayer aortic endothelial cells through transwell permeability assay. (G, H) Summary data showing TER and FD20 permeability in HCAECs cultured in HG or NG medium for 7 days in the presence or absence of the SOCE agonist ATP (100 µM) or the SOCE inhibitor BTP2 (10 µM). The migration of human colonic cells was investigated using the wound-repair ratio. (I) Representative photos showing cell migration of HCAECs cultured in HG or NG medium for 7 days in the presence or absence of ATP (100 µM) or BTP2 (10 µM), and the ratios of cell migration are shown in (J). (K) Representative photos showing cell migration of HCAECs transfected with IGFBP3 siRNA and cultured in HG medium for 7 days, and the ratios of cell migration are shown in (L). β-tubulin or GAPDH was used as loading controls. Values represent mean±SEM (n=4–5 samples). *P<0.05, **P<0.01, ***P<0.001 compared with NG-cultured cells or control groups. FD20, fluorescein isothiocyanate (FITC)-labeled dextran 20 kDa; GAPDH, glyceraldehyde 3-phosphate dehydrogenase; HCAECs, human coronary artery endothelial cells; HG, high glucose; IGFBP3, insulin-like growth factor binding protein 3; NG, normal glucose; OD, optical density; siRNA, small interfering RNA; SOCE, store-operated Ca2+ entry; TER, transendothelial electrical resistance; VE-cadherin, vascular endothelial cadherin.
TER is an index used to evaluate endothelial barrier function.19 In monolayer aortic endothelial cells, HG exposure decreased the TER compared with the control group (figure 4E). Figure 4G shows that ATP decreased and BTP2 increased TER in HG-cultured HCAECs. The above experimental results indicated that HG exposure enhancing the permeability of HCAECs which SOCE could adjust.
Furthermore, we detected FD20 permeability in monolayer endothelial cells to demonstrate the effect of HG exposure on endothelial barrier function. As shown in figure 4F, HG exposure significantly increased FD20 permeability in monolayer coronary artery endothelial cells. Meanwhile, the SOCE activator ATP increased FD20 permeability whereas the SOCE inhibitor BTP2 decreased FD20 permeability of HCAECs cultured in HG medium (figure 4H). The above experimental results indicated that HG exposure enhancing the permeability of HCAECs and the IGFBP3-Orai signaling complexes can regulate permeability.
The migration of HCAECs was determined using the wound-repair ratio. As shown in figure 4I–J, HG exposure significantly decreased the migration of HCAECs compared with that of the NG-treated groups. Moreover, ATP increased cell migration whereas BTP2 decreased cell migration of HCAECs cultured in either NG or HG (figure 4I–J). However, knocking down the expression of IGFBP3 can reduce the enhanced cell migration caused by HG exposure (figure 4K–L). These experimental results indicated that HG exposure enhancing the migration of HCAECs and the IGFBP3-Orai signaling complexes can regulate cell migration.
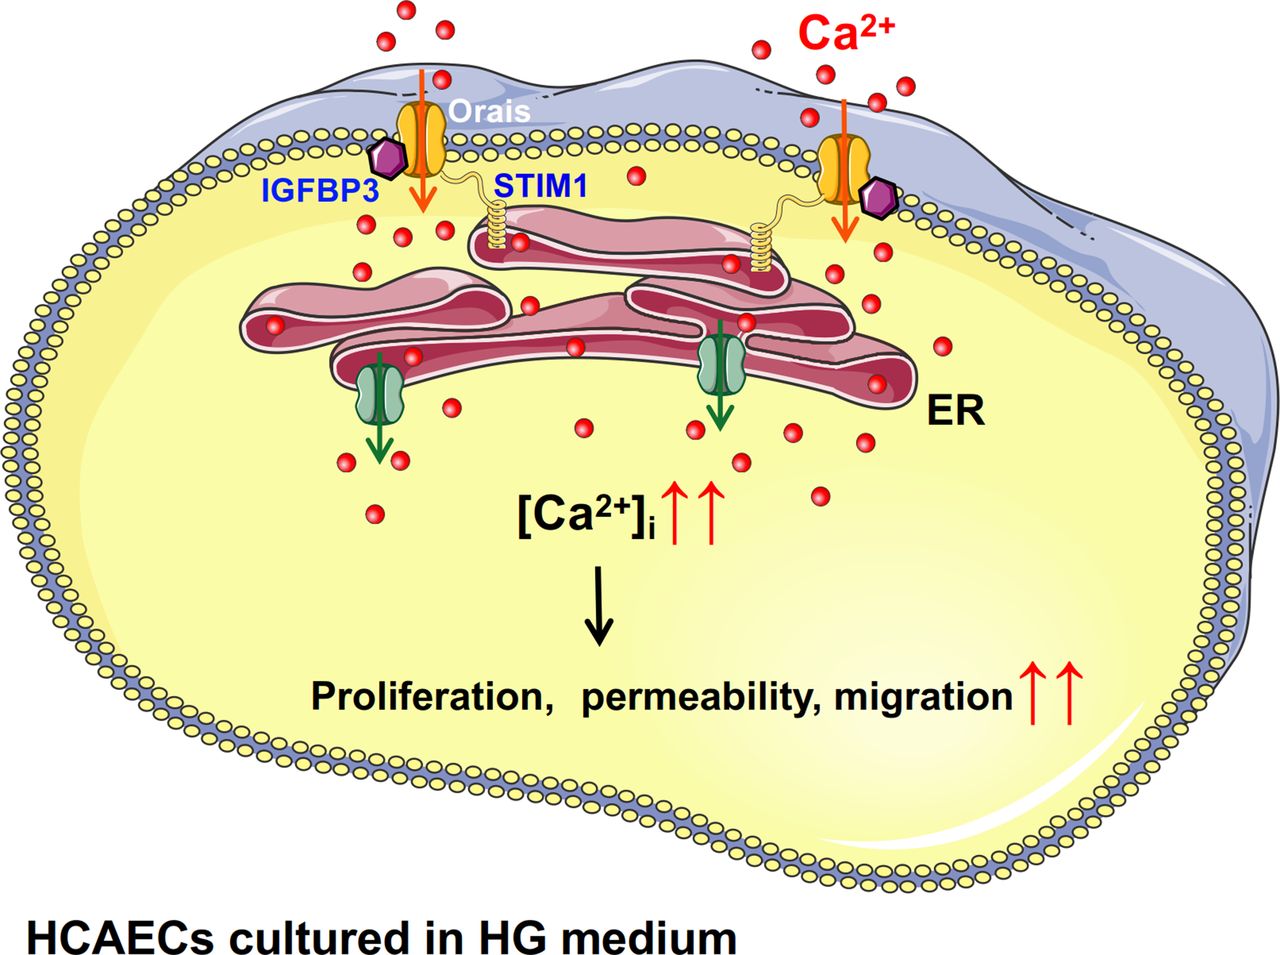
In summary, Orais and IGFBP3 interact. After HCAECs are stimulated with HG, the protein expression levels of Orais and IGFBP3 increased, the interactions between them increased, and SOCE (Orai-mediated increase in local Ca2+) activity also increased. This series of physiological processes leads to increased proliferation of HCAECs induced by HG (figure 5). IGFBP3-Orai signaling complexes are related to some processes in endothelial dysfunction, such as adhesion marker expression, barrier function and migration of HCAECs cultured in HG medium.

Schematic diagram showing the proposed Orai-Ca2+-IGFBP3 signaling complex transduction pathway. Increased level of glucose might promote the overexpression and interactions of IGFBP3 and Orais in HCAECs and thus induce increased intracellular Ca2+ mediated by SOCE. Subsequently, increased intracellular Ca2+ may cause increased proliferation, permeability, and migration of endothelial cells. ER, endoplasmic reticulum; HCAECs, human coronary artery endothelial cells; HG, high glucose; IGFB3, insulin-like growth factor binding protein 3; SOCE, store-operated Ca2+ entry; STIM1, stromal interaction molecule.
Discussion
The major findings of this study were that Orai1–3 and IGFBP3 physically interact and that these signaling complexes play important functional roles in regulating the proliferation, viability and endothelial dysfunction (such as migration, barrier function and adherens junction protein expression) of HCAECs cultured in HG medium. The evidence supporting this statement is as follows. (1) HCAEC proliferation and viability were promoted by HG exposure in culture for 3, 7, and 14 days, and the proliferation of coronary artery endothelial cells was also increased in STZ-induced diabetic mice. (2) The expression levels of Orai1–3 channel protein and IGFBP3 and the activity of SOCE were significantly increased in HCAECs cultured for 7 days in HG medium. Orais and IGFBP3 were also increased in coronary artery endothelial cells of STZ-induced diabetic mice. In addition, the SOCE activator ATP increased PCNA (a marker of cell proliferation) expression levels and viability in HCAECs cultured in NG or HG medium; knockdown of IGFBP3 in these HCAECs by siRNA-specific transfection decreased PCNA protein level and the viability of these cells. (3) Orai1, 2, or 3 physically interacted with IGFBP3, and their interactions were enhanced by HG stimulation; the expression level of IGFBP3 protein was enhanced by the SOCE activator ATP and was decreased by the SOCE inhibitor BTP2 in HG-cultured HCAECs. Furthermore, IGFBP3 knockdown markedly decreased Orai1–3 protein expression levels as well as ATP-induced or TG-induced SOCE in HG-cultured HCAECs. (4) The expression level of VE-cadherin protein was enhanced by HG stimulation and decreased by transfected with IGFBP3 siRNA in HG-cultured HCAECs. The TER of HCAECs was reduced and the permeability of HCAECs was enhanced by HG stimulation. Furthermore, the SOCE activator ATP decreased TER and increased FD20 permeability in HCAECs cultured in HG medium. The SOCE inhibitor BTP2 increased TER and decreased FD20 permeability in HCAECs cultured in HG medium. ATP increased cell migration whereas BTP2 decreased cell migration of HCAECs cultured in either NG or HG. However, knocking down the expression of IGFBP3 can reduce the enhanced cell migration caused by HG stimulation.
The endothelium is a central regulator of vascular homeostasis. Hyperglycemia due to DM causes vascular dysfunction.20 Consistent with previous reports,21 22 our data showed that increased glucose level might also cause proliferative dysfunction of endothelial cells, which is believed to contribute to the premature development of atherosclerosis.23 24
Some studies have reported that diabetes-associated endothelium dysfunction may be linked to disturbances in Ca2+ homeostasis.2 3 The present study showed that prolonged HG exposure induced endothelium cell proliferation and increased viability, both of which were decreased by the SOCE inhibitor BTP2. In addition, SOCE and the expression levels of the SOCE-related proteins Orai1–3 increased in HCAECs cultured in HG medium in a time-dependent manner. Furthermore, Orai1–3 proteins were overexpressed in the coronary artery endothelium cells of a mouse model of diabetes. In addition, in cells cultured in NG medium, the SOCE agonist ATP increased the expression level of the cell proliferation marker PCNA; however, in HCAECs cultured in HG medium, ATP could not further increase the expression level of PCNA. Our data also showed that HG had no effect on the expression level of STIM1 in HCAECs. This result is likely a reflection of an Orai-independent role of SOCE in HCAECs. These findings suggested that the enhancement of SOCE owing to a high expression of the SOCE-related proteins Orai1–3 contributed to the increased proliferation of HCAECs induced by HG.
IGFBP3 is known to regulate insulin resistance, apoptosis, and oxidative damage.25 26 IGFBP3 enhances cell proliferation in retinal endothelial cells, and HG induces the production of IGFBP3 in immortalized human corneal epithelial cells.27 28 Consistent with these results, we found that the HG medium increased IGFBP3 protein expression level in HCAECs, and knockdown of IGFBP3 significantly decreased HCAEC viability and proliferation. Together, these data demonstrated that IGFBP3 also contributed to the regulation of HG stimulation-induced activation of HCAEC proliferation and viability.
Because our data indicated that SOCE and IGFBP3 both contributed to HCAEC proliferation induced by HG exposure, we explored whether they interact and whether they are involved in the mechanisms underlying hyperglycemia and diabetes. The results of our coimmunoprecipitation and double immunofluorescence experiments indicated that IGFBP3 physically associated with Orai1–3 in HCAECs, and that HG not only increased the expression levels of IGFBP3 and Orai1, 2, and 3 but also their interactions. The possibility of other mechanisms and novel molecular targets has not been well studied, limiting current knowledge in the development of diabetic coronary atherosclerosis prevention and management. The present study is the first report, to our knowledge, that identifies specific targets of the IGFBP3 protein that are affected by HG exposure, resulting in the enhancement of Orai-mediated Ca2+ entry and proliferation of HCAECs cultured in HG. Therefore, the results from this study suggest that IGFBP3 can be targeted by Orai-mediated intracellular Ca2+ signaling to potentially prevent diabetic coronary atherosclerosis development, progression, or both.
At the same time, we also found that the IGFBP3-Orai signaling complexes can result in endothelial injury by regulating the expression of VE-cadherin and the permeability of endothelial cells cultured in HG medium. Endothelial injury is the pivotal mechanism involved in atherogenesis, which has been reported in the literature.29 In addition, we also found that the IGFBP3-Orai signaling complexes affected the migration of HCAECs. Increasing endothelial cell proliferation and migration can promote the initiation and pathological progression of atherosclerosis.24
In summary, the present study demonstrated that HG exposure promoted Orai-mediated SOCE activity and increased IGFBP3 protein expression, resulting in HCAEC proliferation and migration increases. Our research also suggested that IGFBP3-Orai signaling complexes were necessary for adherens junction and permeability regulation of barrier functions. The findings of this study shed light on the prevention and treatment of cardiovascular complications in diabetes by targeting the Orai-IGFBP3 signaling complexes.
Conclusion
In conclusion, as shown in figure 5, our findings suggest physical and functional interactions of Orai channel proteins and IGFBP3 as a novel regulatory mechanism underlying the increased proliferation and viability of HCAECs cultured in HG medium. Increased level of glucose might promote the overexpression and interactions of IGFBP3 and Orais and thus induce increased intracellular Ca2+ mediated by SOCE. Subsequently, increased intracellular Ca2+ may cause proliferative dysfunction of endothelial cells, and the Orai-IGFBP3 signaling complexes are related to endothelial dysfunctions such as migration, barrier function and adhesion marker expression, which are believed to contribute to the premature development of atherosclerosis.
Acknowledgments
The authors thank the Center for Scientific Research of Anhui Medical University for valuable help in the experiment.
References
Supplementary materials
Supplementary Data
This web only file has been produced by the BMJ Publishing Group from an electronic file supplied by the author(s) and has not been edited for content.
Footnotes
SB and YW contributed equally.
Contributors SB, YW, and JD developed the methodological aspects of the analysis and data interpretation. SB, YW, WHo, YHY, and JZ analyzed the data, prepared the figures, and drafted the manuscript. SB, JD, XH, WC, YD, WHe, and BS drafted the manuscript. All authors revised the manuscript, approved the final version, and agreed to be accountable for all aspects of the work in ensuring that questions related to the accuracy or integrity of any part of the work are appropriately investigated and resolved. JD is the guarantor of this work and as such had full access to all the data in the study and takes responsibility for the integrity of the data and the accuracy of the data analysis.
Funding This work was supported by grants from the National Natural Science Foundation of China (8197102295, U1732157, 31701162, 81570403, and 81371284), the Natural Science Foundation of Anhui Province Department of Education (KJ2018A0974, KJ2017A178), the Anhui Provincial Natural Science Foundation (1908085QC131), and Grants for Scientific Research of BSKY (XJ201726) from Anhui Medical University.
Competing interests None declared.
Patient consent for publication Not required.
Ethics approval The protocol for the use of mice was approved by the Animal Experimentation Ethics Committee of Anhui Medical University.
Provenance and peer review Not commissioned; externally peer reviewed.
Data availability statement Data are available upon reasonable request. All data relevant to the study are included in the article or uploaded as supplemental information.
Supplemental material This content has been supplied by the author(s). It has not been vetted by BMJ Publishing Group Limited (BMJ) and may not have been peer-reviewed. Any opinions or recommendations discussed are solely those of the author(s) and are not endorsed by BMJ. BMJ disclaims all liability and responsibility arising from any reliance placed on the content. Where the content includes any translated material, BMJ does not warrant the accuracy and reliability of the translations (including but not limited to local regulations, clinical guidelines, terminology, drug names and drug dosages), and is not responsible for any error and/or omissions arising from translation and adaptation or otherwise.