Article Text

Abstract
Introduction This study was performed to investigate the role of iron overload in the early stage of hyperglycemia-induced vascular functional impairment.
Research design and methods A total of 196 obese children were enrolled, and data regarding ferritin levels, blood glucose levels, intima-media thickness of carotid arteries, liver function and fibrosis index, hemoglobin, blood pressure, blood lipids, and inflammation indicators were collected. Ferritin levels were compared with a control group, which consisted of 148 healthy non-obese children who were age-matched and gender-matched. Endothelial cells were cultured in high glucose medium and supplemented with ferric citrate with or without iron remover (deferoxamine), a reducing agent (N-acetyl-cysteine), or a nuclear factor-κB (NF-κB) inhibitor (BAY 11-7082). Apoptosis, oxidative stress, nitric oxide levels, and endothelin content were evaluated. DNA microarray analysis was performed to analyze the expression of genes in the NF-κB signaling pathway.
Results Obese children have significantly higher ferritin levels compared with the control group. Ferritin level was positively correlated with hemoglobin and was related to metabolic disorders, including impaired glucose tolerance, higher blood pressure, dyslipidemia, and impaired hepatic function. Endothelial cells treated with ferric citrate showed a significantly higher rate of apoptosis, higher levels of oxidative stress, and impaired vasomotor function under high glucose conditions. The above effects were rescued by treatment with an iron remover, reducing agent, or NF-κB inhibitor. Further, detection of phosphorylated-p65 distribution in cells confirmed activation of the NF-κB pathway. DNA microarrays and subsequent gene oncology enrichment analyses revealed the main processes activated in cells.
Conclusion Increased ferritin levels are related to impaired glucose tolerance and other metabolic disorders in obese children. At the cellular level, iron overload aggravated the endothelial cell dysfunction caused by high glucose.
- blood glucose
- endothelial cells
- pediatric obesity
- oxidative stress
This is an open access article distributed in accordance with the Creative Commons Attribution Non Commercial (CC BY-NC 4.0) license, which permits others to distribute, remix, adapt, build upon this work non-commercially, and license their derivative works on different terms, provided the original work is properly cited, appropriate credit is given, any changes made indicated, and the use is non-commercial. See: http://creativecommons.org/licenses/by-nc/4.0/.
Statistics from Altmetric.com
Significance of this study
What is already known about this subject?
Both hyperglycemia and iron overload are thought to have negative impact on endothelial cell dysfunction.
No reports in obese children have considered the correlation between intima-media thickness (IMT) and ferritin levels.
The role of iron status is not clear in obese-related metabolic disorders.
What are the new findings?
Obese children had increased ferritin levels positively correlated with hemoglobin levels, which were also increased.
The correlation between high ferritin and a variety of obesity-related metabolic disorders, particularly impaired glucose tolerance, can start as early as childhood.
Although there was no correlation between artery morphological change and ferritin or blood glucose levels, iron overload aggravated high glucose -induced endothelial cell dysfunction in vitro
Nuclear factor-κB activation, inflammatory response, lipopolysaccharide-mediated signaling pathway, protein kinase B signaling, and regulation of nitric oxide biosynthesis may be involved in the high glucose-induced cell damage aggravated by iron overload.
How might these results change the focus of research or clinical practice?
Follow-up evaluations of IMT may be needed to further study the impact of iron overload on IMT.
Evaluating iron load as well as determining the optimal levels of iron for obese children, especially those with hyperglycemia, may help reduce endothelial cell dysfunction and decrease future risk of cardiovascular disease.
Introduction
As part of the global obesity pandemic, the prevalence of childhood overweight and obesity is increasing rapidly, rising 1.6-fold between 1990 and 2010 (from 4.2% to 6.7%).1 Both obesity2 3 and metabolic abnormalities4 tend to track into adulthood and likely increase cardiovascular mortality in adults.5 The atherosclerotic process can begin as early as childhood,6 and obese children with metabolic abnormalities have poorer cardiometabolic outcomes in adulthood than their metabolically healthy obese counterparts.4
Minimizing the risk of cardiovascular disease requires early intervention and a better understanding of the early changes underlying arteriosclerosis. Endothelial cell dysfunction is regarded as the first step of arteriosclerosis,7 followed by an increase in the intima-media thickness (IMT)8 and a decrease in arterial elasticity. Vascular endothelial synthesis of nitric oxide (NO) leads to vasodilation, whereas endothelin (ET) leads to vasoconstriction. An imbalance between NO and ET levels is indicative of endothelial cell dysfunction; it leads to changed vascular tone, which occurs in the early stage of atherosclerosis.9 10
Endothelial cell dysfunction can be caused by oxidative stress and inflammation and involves many obesity-related factors. One of the main sources of oxidative stress and inflammation in endothelial cells is hyperglycemia.11 Reactive oxygen species (ROS), advanced glycation end products (AGEs), metabolic pathway flux, and protein kinase C signaling all play roles in hyperglycemia-induced endothelial cell dysfunction.12 In addition to hyperglycemia, iron overload was reported in some studies performed on obese populations.13–15 Iron overload was also proposed as a cardiovascular risk factor,16 in addition to traditional factors like hyperglycemia, dyslipidemia, hypertension, smoking, and family history. Iron affects all the cell types that are involved in the atherosclerotic process within the arterial wall, including macrophages, endothelial cells, platelets, and vascular smooth muscle cells.16
The inducible transcription factor nuclear factor-κB (NF-κB) plays a role in both iron-induced and hyperglycemia-induced cell dysfunction. Nicotinamide adenine dinucleotide phosphate (NADPH) oxidase-derived superoxide anion-induced NF-κB is responsible for apoptosis in cardiomyocytes exposed to high glucose.17 Most intracellular iron is bound to ferritin. Individuals with obesity and diabetes have higher ferritin levels and increased expression of genes involved in insulin resistance and the inflammatory state, including NF-kB.18 Ferrous citrate can upregulate nitric oxide synthase 2 by stimulating the nuclear translocation of NF-kB in response to the generation of free radicals, which leads to cerebral vasospasm.19
The impact of ferritin levels on IMT, an indicator of early vascular change, is inconsistent among different populations. In healthy black women, ferritin levels were correlated with abdominal aortic calcium but not with the risk of incident coronary heart disease.20 In healthy Chinese women, increased serum ferritin levels were associated with IMT and carotid plaques.21 In another study performed on obese adults with non-alcoholic fatty liver disease, there was no relationship between ferritin levels and IMT.22 In children, serum ferritin levels were associated with IMT in healthy subjects23 and children with sickle cell disease,24 but not those with thalassemia.25 26 We previously reported increased IMT in obese children.27 However, to the best of our knowledge, no reports in obese children have considered the correlation between IMT and ferritin levels.
In the current study, we sought to address whether ferritin levels are related to IMT, an early indicator of vascular dysfunction, as well as indicators of glucose metabolic status, central obesity, blood pressure, blood lipids, and liver function in obese children. Further, we explored whether iron overload aggravates high glucose exposure-induced endothelial cell dysfunction in vitro and assessed if the dysfunction is mitigated by removing iron. Finally, we studied whether the NF-κB pathway was involved in the aggravation of iron overload during high glucose-induced endothelial cell dysfunction.
Methods and materials
Data collection
A total of 196 Chinese obese children aged 5–17 years (mean (SD), 11.3 (5.4) years) were enrolled from May 5, 2018 to March 16, 2019. Children with other endocrine diseases, hereditary diseases, or infectious diseases were excluded. Obesity was defined as a body mass index (BMI) exceeding the 95th percentile for the Chinese age-matched population. The control group consisted of 148 healthy non-obese children, with a mean (SD) age of 11.2 (6.5) years (range, 7–18 years). All subjects were recruited from the Department of Child Care for health examinations. No significant differences in age or sex were found between the two groups. Informed consent was obtained from the parents.
For the obese group, a detailed medical and family history was obtained. Waist circumference was measured at the mid-level between the lower rib margin and the iliac crest, and hip circumference was measured at the level of the trochanter major. Systolic blood pressure (SBP) and diastolic blood pressure (DBP) were measured using an automatic digital sphygmomanometer. BMI and the ratio of waist to height or hip were calculated. Fasting blood lipids, hepatic function (alanine aminotransferase (ALT) and aspartate aminotransferase (AST) levels, albumin, and gamma-glutamyltranspeptidase (ɤ-GT) levels), and renal function (urine acid, uric acid, urea, urine α-1 microglobulin, urine albumin, urine IgG, urine creatinine, urine microalbumin, and the ratio of urine albumin to urine creatinine) were measured. An oral glucose tolerance test (OGTT) was performed (1.75 g/kg of body weight: maximum, 75 g). Blood samples were obtained to measure glucose and insulin levels in the fasting state and 2 hours after glucose load. Insulin resistance was estimated using the homeostasis model assessment of insulin resistance (HOMA-IR). Serum markers of hepatic fibrosis, hyaluronic acid (HA), type Ⅳ collagen (CⅣ), procollagen type Ⅲ (PcⅢ), and laminin (LN) were measured using ELISA kits (HA from Shanghai Naval Research Institute and all others from Beijing North Institute of Biological Technology, Beijing, China). IMT was measured in a quiet temperature-controlled room. For measurements, children were examined in the supine position with the head turned 45° away from the side. High-resolution B-mode ultrasonography (HD7; Koninklijke Philips Electronics, Eindhoven, The Netherlands) of the right and left carotid arteries was performed using a linear 10 mHz transducer. IMT was defined as the mean distance from the leading edge of the lumen-intima interface to the leading edge of the media adventitia interface of the far wall, approximately 1 cm proximal to the carotid bulb. Three determinations of IMT were obtained and averaged. For the control group, height, weight, ferritin and hemoglobin levels were evaluated.
Cell culture
Human umbilical vein endothelial cell (HUVEC) cells were cultured in the RPMI-1640 culture medium (Hyclone SH30809.01B) containing low concentration of glucose (5.5 mmol/L) or high concentration of glucose (30 mmol/L) and supplemented with 10% fetal bovine serum (FBS) (Gibco 16000-044) and 1% penicillin/streptomycin at 37°C with 5% CO2 in a cell incubator. The cells were cultured in 10 groups, as demonstrated in table 1.
Cell culture conditions
Cell growth and apoptosis detection
Cell Counting Kit-8 reagent and serum-free dulbecco's modified eagle medium(DMEM)/RPMI-1640 were mixed at a 1:10 ratio and 100 µL of the mixture was added to each well. Plates were incubated under 37°C with 5% CO2 for 1 hour. The absorbance at 450 nm was measured using a plate reader, and cell viability was plotted against time. Apoptosis was measured using an Annexin V/Apoptosis Detection Kit (eBioscience 88-8007), as previously described.28 Briefly, 5 µL Annexin V-FITC and 10 µL propidium iodide were added successively to harvested cells and incubated in the dark at room temperature for 10 min. Then, the mixture was analyzed using flow cytometry (BD Biosciences).
NO and ET levels
NO and ET levels were detected to assess the vasodilation function of endothelial cells. Cells were collected and centrifuged for 5 min, supernatants were harvested, and the NO content was detected using a nitrate reductase assay kit (Njjcbio). The NO content was calculated with the following formula:

The ET content was measured using an ELISA kit (Biosamite, Shanghai).μ
Cellular distribution of phosphorylated-p65
After cells grew on slides, the slides were washed with phosphate buffered saline (PBS), fixed with 4% formaldehyde for 30 min, and washed with PBS three times. Then, phosphorylated-p65 (p-p65) antibody (Abcam, 1:2000) was added and the slides were incubated in a wet box at 4°C overnight. The slides were washed three times with PBS before secondary antibody (HRP-labeled Goat Anti-Mouse IgG, Beyotime Biotechnology, 1:200) was added, and the slides were incubated in a wet box at room temperature for 1 hour. Finally, the slides were washed three times with PBS, sealed, and imaged under a fluorescence microscope (Leica).
Oxygen free radicals and peroxide products
ROS were detected by chemical fluorescence. Briefly, dichlorodihydrofluorescein diacetate (DCFH-DA) probe solution was diluted to 10 µM staining solution and added to the cells. The cells were incubated, washed, and observed under a fluorescence microscope with excitation at 480 nm and emission at 525 nm. Superoxide dismutase (SOD) activity was evaluated using a total superoxide dismutase assay kit (hydroxylamine method, Nanjing Jiancheng Bioengineering Institute A001-1-1). Malondialdehyde (MDA) levels, a product of lipid peroxidation, were detected using an MDA assay kit (Nanjing Jiancheng Bioengineering Institute, A003-1).
NF-κB signaling pathway activation
These experiments were performed to determine whether the NF-κB signaling pathway was involved in ferric citrate-induced and high glucose-induced endothelial cell dysfunction. NF-κB signaling pathway activation was first detected. Levels of p-p65 and p65 were detected by western blotting, and then the expression of 86 key downstream genes was detected using an NF-kB Signaling Pathway PCR Array (PAHS-025Z, Qiagen), as previously described.29 Finally, genes whose expression was increased more than twofold or decreased more than twofold were identified, and the changes were confirmed by quantitative PCR.
Statistical analyses
Statistical analyses were performed using commercially available software (SPSS V.16.0). Quantitative data with normal distribution are presented as mean (SD), and variables with skewed distribution are log-transformed. The ferritin data are presented as median (25th percentile, 75th percentile), and levels between two groups were compared by t-tests after being log-transformed to obtain a normal distribution. Glucose level data were normalized by reciprocal transformation. Bivariate (Pearson) correlation analysis was used to examine the association between ferritin and other variables. Significance was defined as p<0.05.
Results
Obese children have elevated ferritin levels, which correlate with impaired glucose tolerance and other obesity-related metabolic disorders
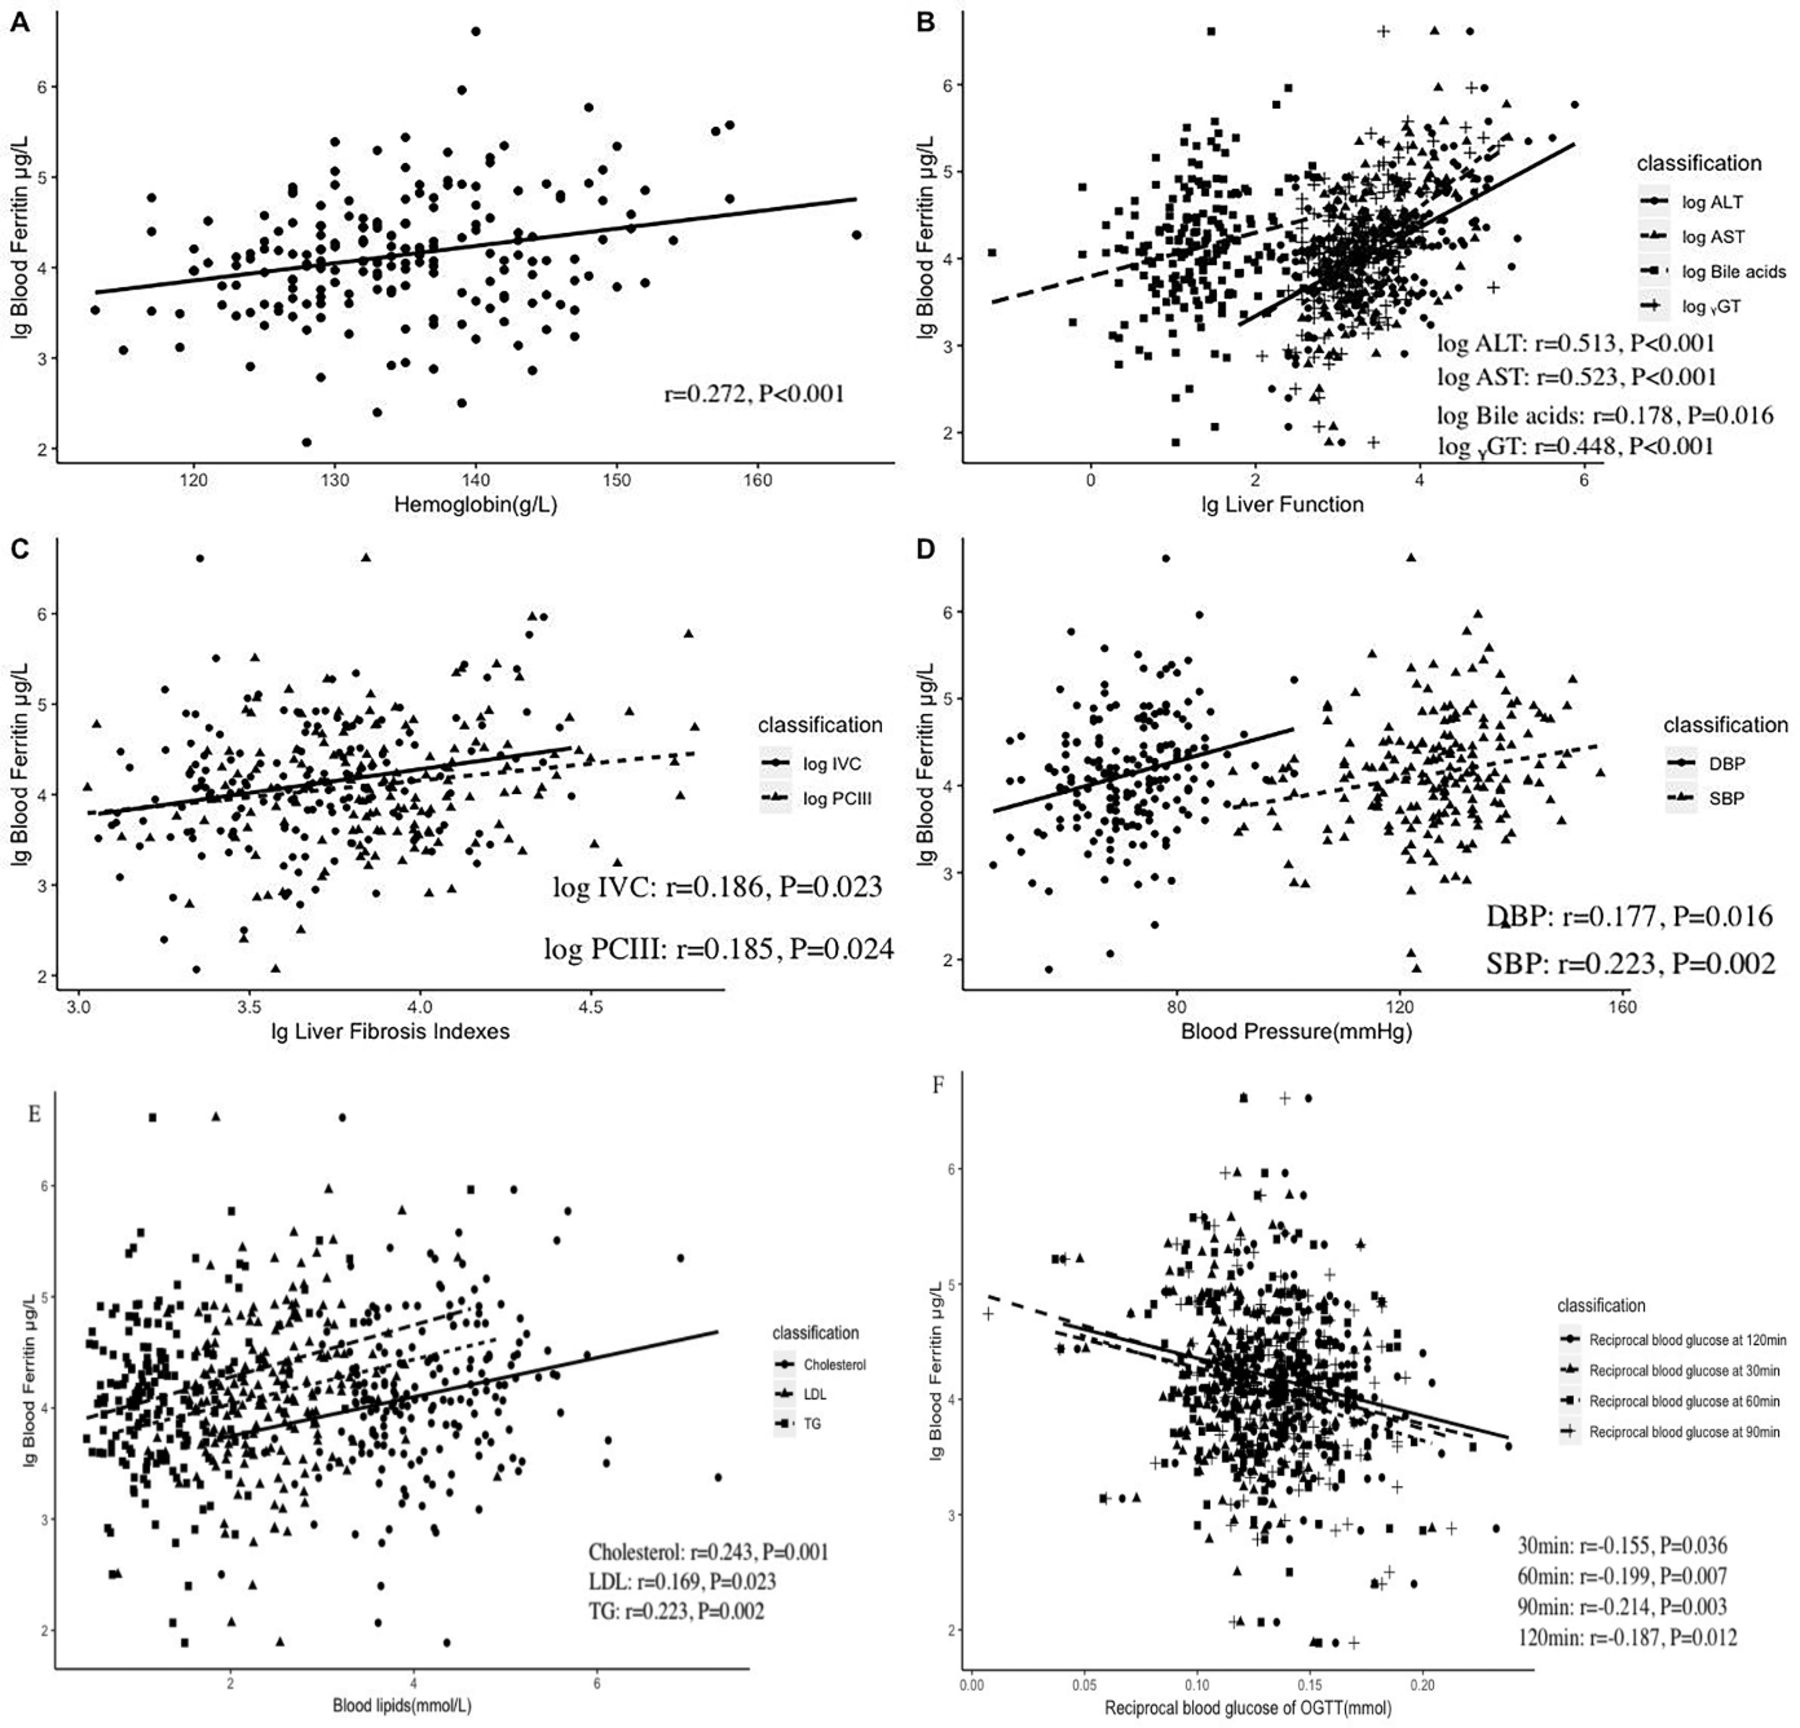
Ferritin levels were significantly higher in the obese group compared with the control group. Furthermore, among obese children, those with metabolic syndrome had higher levels of ferritin than those without metabolic syndrome (table 2). Regarding anthropometric indicators of obesity, ferritin levels were correlated with waist to height ratio (r=0.169, p=0.021) and waist to hip ratio (r=0.247, p=0.001), but not BMI or weight. In addition, ferritin levels positively correlated with hemoglobin (r=0.272, p<0.001) were also increased in obese children.
Comparison of ferritin levels between obese children and healthy controls and obese children with and without Mets
After controlling for waist to height ratio and waist to hip ratio, correlations were found between ferritin levels and each of the following indices: glucose levels after OGTT test (30, 60, and 120 min after glucose administration), blood pressure (SBP and DBP), blood lipids (cholesterol, low-density lipoprotein (LDL), and triglyceride (TG)), hepatic function (ALT, AST, and ɤ-GT), and hepatic fibrosis indicators (PCIII and log IV-C). All the results are shown in figure 1. There was no correlation between ferritin and insulin, C peptide, or HOMA-IR. There was also no correlation between ferritin and acute inflammation indicators, including white cell count, neutrophils, and C reactive protein. There was no correlation between ferritin and IMT; the latter was only positively correlated with weight (r=0.197, p=0.009) and BMI (r=0.215, p=0.004).

Ferritin levels are correlated with hemoglobin and obesity-related metabolic disorders. Scatter plot showing the correlation between ferritin and the following indicators after controlling for waist to height ratio and waist to hip ratio: hemoglobin (A), lg liver function (B), liver fibrosis indicators (C), blood pressure (D), blood lipids (E), and blood glucose during OGTT (F). Indicators were log-transformed or reciprocal transformed to obtain a normalized contribution. ALT, alanine aminotransferase; AST, aspartate aminotransferase; DBP, diastolic blood pressure; ɤ-GT, gamma-glutamyltranspeptidase; LDL, low-density lipoprotein; lg, log10; OGTT, oral glucose tolerance test; PcⅢ, procollagen type Ⅲ; SBP, systolic blood pressure; TG, triglyceride.
Ferric citrate aggravates high glucose-induced endothelial cell apoptosis
Cell viability under different conditions and cell apoptosis are shown in figure 2. Under low glucose conditions, treatment with ferric citrate had no effect on apoptosis. However, under high glucose conditions, ferric citrate induced apoptosis in a dose-dependent manner. There was no difference in cell viability and apoptosis between the high glucose (HG) group and the HG+DFO (deferoxamine) group. Therefore, the iron chelator DFO had no significant effect on cell growth. However, apoptosis was lower in both the HG+BAY 11-7082 and HG+NAC (N-acetyl-cysteine) groups compared with the HG group. This suggests that the reducing agent and NF-κB pathway inhibitor could rescue HG-induced cell damage to some extent. The HG+FC (ferritin citrate) group had lower cell viability and increased apoptosis compared with the HG group; however, when DFO or NAC and BAY 11-7082 were added, cell viability increased and apoptosis decreased compared with the HG+FC group.

Endothelial cell viability and apoptosis. (A) At 36 hours and 48 hours after the start of treatment, there was no difference in cell viability between the HG group and the HG+DFO or the HG group and the HG+BAY 11-7082 group. The HG+NAC group had higher cell viability than the HG group. The HG+FC group had lower cell viability compared with the HG group. Addition of DFO increased cell viability in the HG+FC group. NAC and the NF-κB pathway inhibitor BAY 11-7082 had an effect similar to DFO. *P<0.05, **P<0.01 versus HG; ##P<0.01 versus HG+FC. (B) Under low glucose conditions, cells treated with different concentrations of ferric citrate showed no difference in apoptosis compared with the control group. However, under high glucose conditions, ferric citrate increased apoptosis in a dose-dependent manner. (P<0.001) **P<0.01 versus LG; ##P<0.01 versus HG; ˆˆP<0.01 versus HG+800 µM FC; &&P<0.01 versus HG+1600 µM FC. (C) There was no difference in the apoptotic rate between the HG and HG+DFO groups. Both the HG+BAY 11-7082 and HG+NAC groups had lower cell apoptotic rate than the HG group. The HG+FC group had a higher cell apoptotic rate than the HG group. When DFO or NAC and the NF-κB pathway inhibitor BAY 11-7082 were added, the apoptosis rate decreased compared with the HG+FC group. **P<0.01 versus HG; ##P<0.01 versus HG+FC. DFO, deferoxamine; FC, ferritin citrate; HG, high glucose; LG, low glucose; NAC, N-acetyl-cysteine; NF-κB, nuclear factor-κB.
Ferritin decreases NO level and increases ET levels in the supernatant of cells cultured with high glucose
Endothelial cell function in regulating vascular tone was evaluated by NO and ET detection. As shown in figure 3, in low glucose conditions, there were no significant differences in the levels of NO and ET in the supernatant of the different groups treated with ferric citrate compared with control. Under high glucose conditions, NO levels in the supernatant decreased and ET levels increased dramatically compared with low glucose conditions. This change became increasingly apparent as the concentration of ferric citrate increased.

Comparative analysis of the NO and ET content in the supernatant of different treatment groups. The HG+DFO, HG+NAC, and HG+BAY 11-7082 groups all had higher NO levels compared with the HG group, while the HG+FC group had lower NO levels. The HG+FC+DFO, HG+FC+NAC, and HG+FC+BAY 11-7082 groups all had higher NO levels compared with the HG+FC group. The HG+NAC and HG+BAY 11-7082 groups both had lower ET levels compared with the HG group, while the HG+FC group had much higher ET levels than the HG group. The HG+FC+DFO, HG+FC+NAC, and HG+FC+BAY 11-7082 groups all had lower ET levels compared with the HG+FC group. *P<0.05 versus HG; **P<0.01 versus HG; ##P<0.01 versus HG+FC. DFO, deferoxamine; ET, endothelin; FC, ferritin citrate; HG, high glucose; NAC, N-acetyl-cysteine; NO, nitric oxide.
When only DFO (2400 µM) was added without high glucose, there was no difference in NO and ET-1 content compared with control. However, under high glucose conditions, DFO, NAC, or BAY 11-7082 all protected the cell dilation function since NO and ET-1 levels increased and decreased, respectively. Furthermore, in high glucose condition, when cells were treated with ferric citrate followed by DFO, NAC, or BAY 11-7082, the impairment caused by ferric citrate seemed to be offset, since there was no significant difference in NO and ET-1 levels compared with the high glucose control. The above results demonstrated that under high glucose conditions, 2400 µM ferric citrate could decrease NO and increase ET levels in HUVEC cells, while DFO (2400 µM) could offset the effect caused by ferric citrate to some extent.
Ferritin increases oxidative stress in cells cultured with high glucose
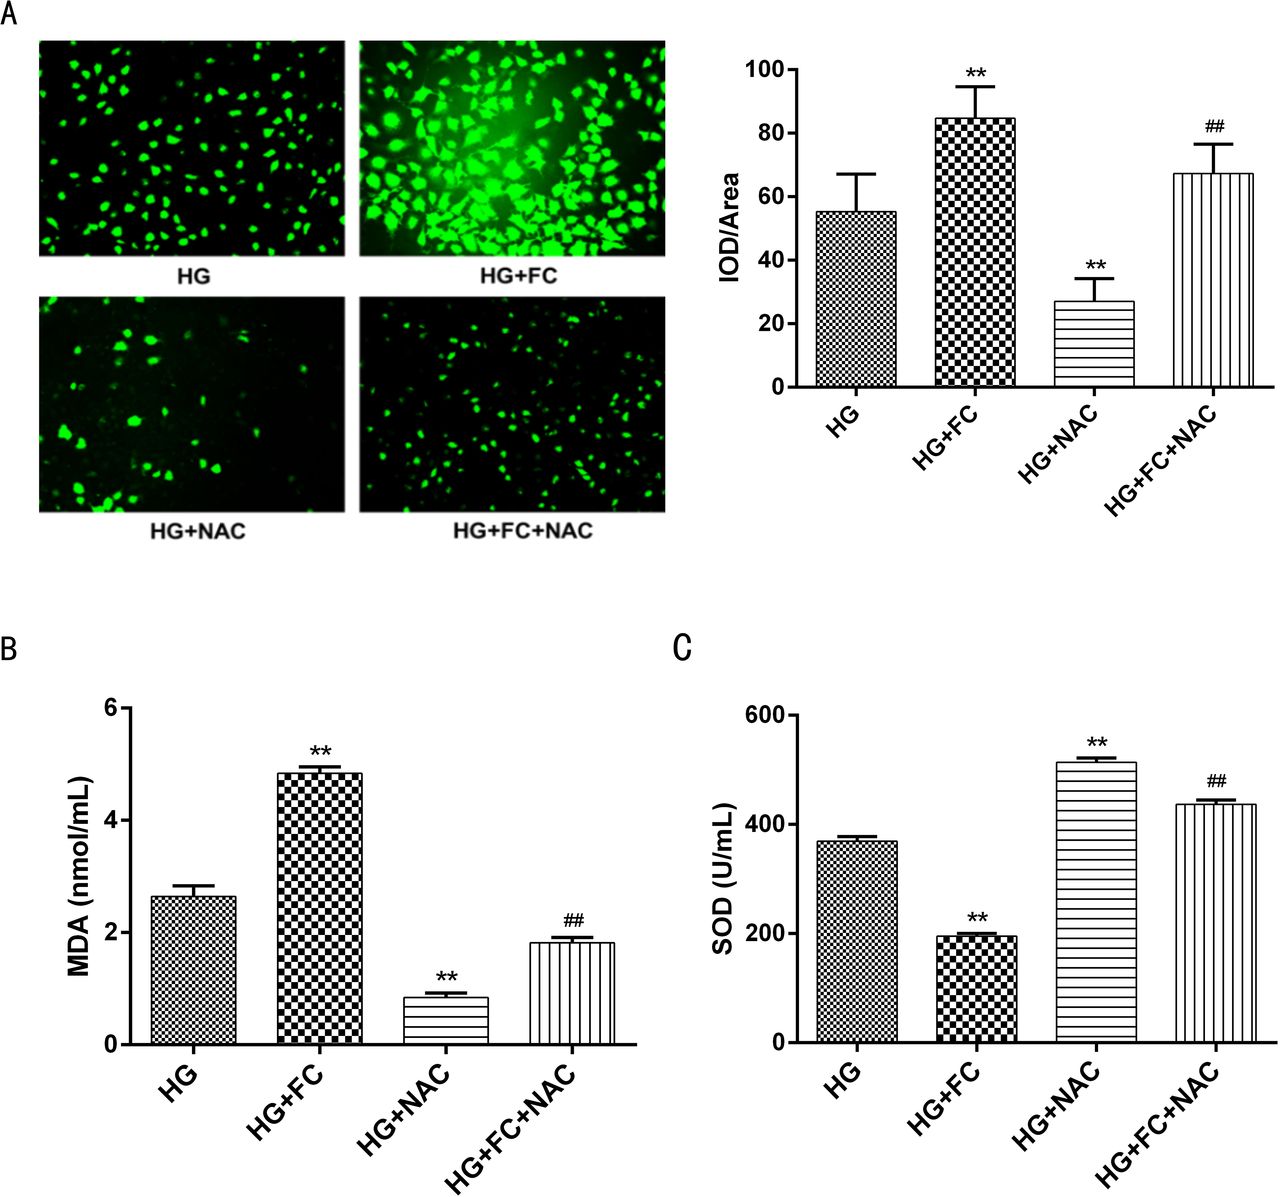
To evaluate oxidative damage, ROS, SOD, and MDA were measured. As shown in figure 4, ROS and MDA levels were higher in cells treated with HG+FC than in HG cells. The reducing agent NAC prevented the increase in ROS and MDA levels in both HG and HG+FC cells. SOD activity was significantly lower in cells treated with HG+FC compared with HG cells. Similarly, the addition of NAC increased SOD activity.

Comparative analysis of oxidative stress in supernatants from the different treatment groups. (A) Fluorescence micrographs of different groups of cells (200×). The ROS content was evaluated by measuring the mean brightness of the fluorescence values and comparing among groups. (B) Comparison of the MDA content in different groups of cells. The HG+FC group had higher MDA levels and the HG+NAC group had lower MDA levels compared with the HG group. The HG+FC+NAC group had lower MDA levels compared with the HG group. (C) Comparison of SOD activity in different groups of cells. The HG+FC group had lower MDA levels and the HG+NAC group had higher SOD levels compared with the HG group. The HG+FC+NAC group had higher SOD levels than the HG group. **P<0.01 versus HG; ##P<0.01 versus HG+FC. FC, ferritin citrate; HG, high glucose; IOD, integrated optical density; MDA, malondialdehyde; NAC, N-acetyl-cysteine; ROS, reactive oxygen species; SOD, superoxide dismutase.
Ferritin increases the expression and nuclear localization of p-p65 in cells cultured with high glucose
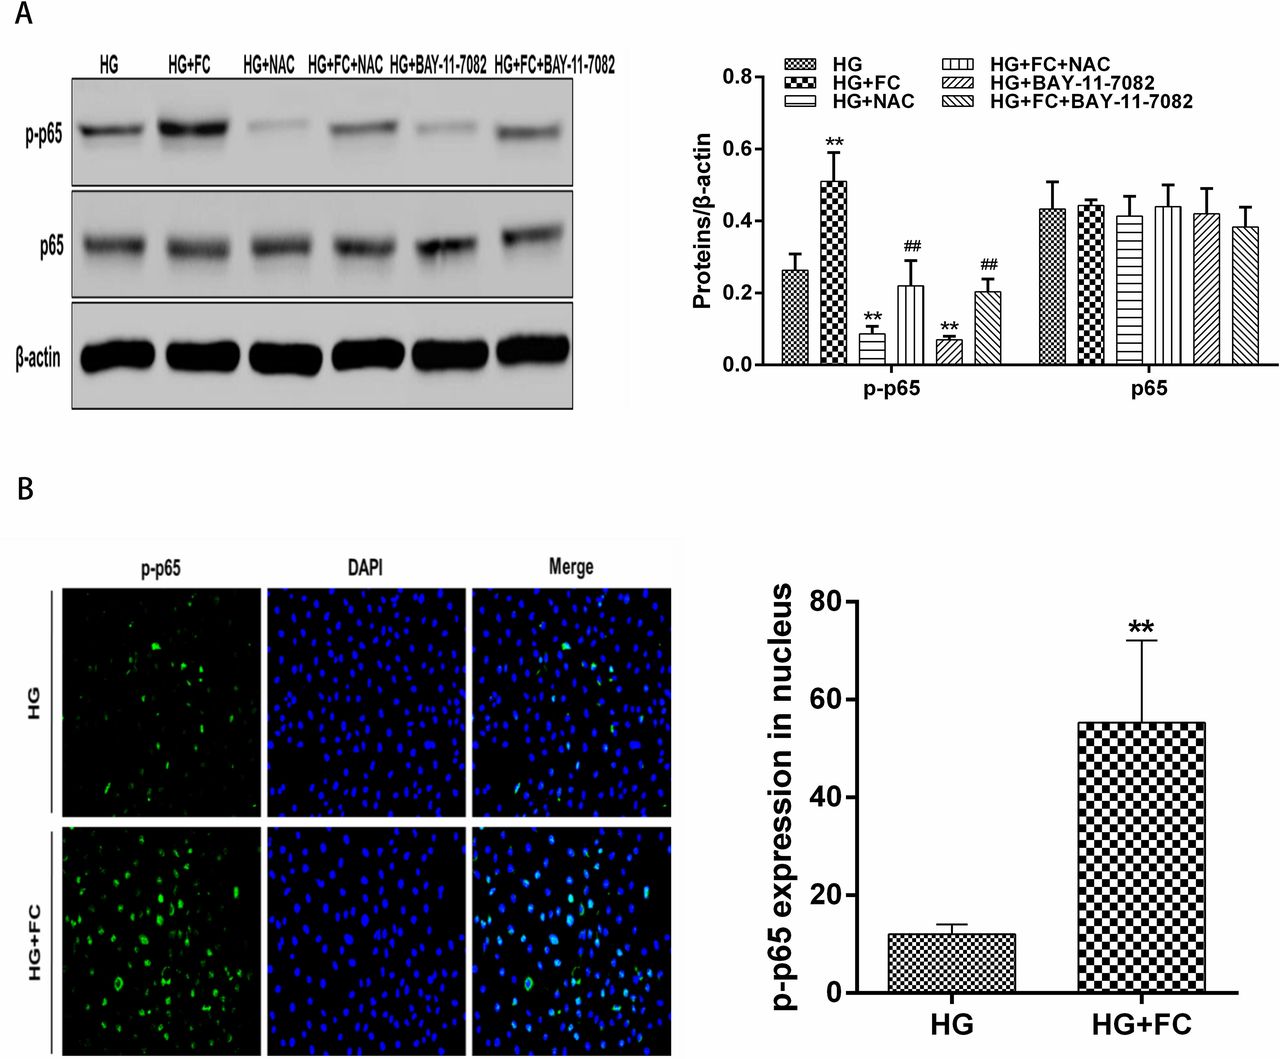
Phosphorylation of the p65 subunit of NF-κB stimulates the transcriptional activity of NF-κB. To determine NF-κB activity, p-p65 and p65 levels were evaluated in different groups by western blotting. Compared with the HG group, the HG+FC group had higher levels of p-p65. After the addition of a reducing agent (NAC) or NF-κB inhibitor (BAY 11-7082), p-p65 levels decreased in both the HG and HG+FC groups. However, there was no difference in p65 levels among groups (figure 5A). After activation by phosphorylation, p65 translocates from the cytoplasm to the nucleus. Therefore, we examined the location of p-p65 using immunofluorescence (figure 5B,C). Compared with the HG group, the levels of nuclear p-p65 were significantly increased in the HG+FC group.

Western blotting results for NF-κB p-p65 and p65 levels in different cell groups and distribution of NF-κB p-p65 in different groups of cells. (A) Compared with the HG group, the HG+FC group expressed higher levels of NF-κB p-p65, while the HG+NAC and HG+BAY 11-7082 groups had lower levels of p-p65. Compared with the HG+FC group, the HG+FC+NAC, and HG+FC+BAY 11-7082 groups had lower levels of p-p65. There was no difference in the expression levels of p65 among different groups. **P<0.01 versus HG; ##P<0.01 versus HG+FC. (B) Compared with the HG group, the amount of p-p65 localized in the nucleus was increased in the HG+FC group. **P<0.01. DAPI, 4',6-diamidino-2-phenylindole; DFO, deferoxamine; FC, ferritin citrate; HG, high glucose; NAC, N-acetyl-cysteine; NF-κB, nuclear factor-κB; p-p65, phosphorylated-p65.
Six genes associated with oxidation, inflammation, and stress were upregulated in the NF-κB signaling pathway
DNA microarray was performed in both the HG and HG+FC cell groups for 86 genes in the NF-κB signaling pathway. In the HG+FC cell group, 19 genes were upregulated more than twofold and 2 genes were downregulated more than twofold compared with the HG group. The expression levels of six genes (AKT1, CCL2, ICAM1, CXCL8, NF-κB, and TNF-α) associated with oxidation, inflammation, and stress were confirmed by quantitative PCR.
Gene ontology enrichment analyses of these gene revealed the main molecular functions, cellular components, and biological progress of the gene products. Chemokine activity, protein kinase activity, and nitric oxide synthase activity were the three main molecular activities involved. The main pathways involved are the inflammatory response, lipopolysaccharide-mediated signaling pathway, protein kinase B signaling, and positive regulation of NO biosynthetic process. Finally, the gene products were mostly active in the extracellular space, membrane rafts, and external side of plasma membrane.
Discussion
Endothelial cell dysfunction is the first step in the early stage of arteriosclerosis and can happen as early as childhood. Both hyperglycemia and iron overload are thought to have negative impact on endothelial cell dysfunction. Much of the literature on obesity-related vascular dysfunction has focused on hyperglycemia, while the role of iron status is unclear. Some studies showed that ferritin levels were increased in obese children13 14 and adults.15 Conversely, other studies suggested the occurrence of impaired iron metabolism and iron deficiency in obese adults30 and children.31–33 Dysmetabolic iron overload syndrome, which is characterized by iron overload and anemia, is caused by reduced iron utilization and has been linked to progressive obesity.34 In the obese children in the current study, ferritin levels were increased and positively correlated with hemoglobin levels, which were also increased. This result is consistent with a survey of 48 537 Chinese children indicating that overweight/obese individuals had a lower risk of anemia.35 Higher hemoglobin concentrations in obese children could result from iron overload or other reasons that have not yet been explored. Evaluation of dietary iron intake in these children may help to partly explain the phenomenon.
In a study of 15 963 Asian adults aged 16–80 years, subjects in the highest serum ferritin quartiles tended to be older.36 However, no relationship was found between ferritin levels and the children’s age in the current study, in which the range of age (5–17 years) was smaller.
In the current study, ferritin levels were positively correlated with blood glucose levels at all four time points after glucose administration in the OGTT. Ferritin also positively correlated with each of the following indices: blood pressure (SBP and DBP), blood lipids (cholesterol, LDL, and TG), indicators of hepatic function (ALT, AST, and ɤ-GT), and hepatic fibrosis indicators (PCIII and CIV). Previous studies in adults showed a positive correlation between ferritin and glucose levels, insulin levels, HOMA-IRs,36 insulin resistance, and abdominal obesity.36 37 Iron load also affects the development of diabetic retinopathy and diabetic nephropathy.38 Body iron storage was also associated with one or more components of metabolic syndrome,39 as well as obesity-related metabolic complications.40 The current study demonstrated that the correlation between obesity-related metabolic disorders and high ferritin levels can start as early as childhood. Among all these disorders, impaired glucose tolerance is most remarkable since ferritin was positively correlated with blood glucose levels at all four time points after glucose administration during the OGTT.
It should be noted that ferritin is also a known indicator of inflammation. It is still hard to tell whether high ferritin levels reflect inflammation caused by hyperglycemia or indicate iron overload, which can also lead to inflammation. In the current study, ferritin levels were not correlated with indicators of acute inflammation, including white cell counts, neutrophils, and platelet counts. However, after controlling for waist to height ratio, ferritin was still correlated with metabolic disorders, including impaired glucose tolerance, dyslipidemia, and impaired hepatic function. Moreover, obese children with metabolic syndrome had significantly higher ferritin levels than obese children without metabolic syndrome. This suggests that ferritin levels may be related to the severity of chronic low-grade inflammation in obese children, which is associated with obesity comorbidities.
We previously reported that IMT was increased in obese children.27 In the current study, IMT was correlated positively with BMI, but not ferritin or blood glucose levels. Conflicting data have been reported regarding the relationship between ferritin and IMT. Some studies showed that increased serum ferritin levels are independently associated with IMT and carotid plaques in patients with non-alcoholic fatty liver disease41 or in women but not men,21 while other studies showed that ferritin levels were only related to ORs for carotid plaque prevalence but not IMT,42 or the studies found no relationship.43
Ferritin levels were related to both SBP and DBP but not IMT. The reason could be that the early vascular changes already led to decreased vascular elasticity before IMT increased. Another possible reason is that inflammation was also involved in the physiological process of elevated blood pressure and the ferritin partly indicated the severity of inflammation. Follow-up evaluations of IMT may be needed to further study the impact of iron overload on IMT.
The above results indicate that increased ferritin levels and hyperglycemia coexist in obese populations as early as childhood. However, no morphological changes in carotid arteries were related to ferritin levels or hyperglycemia, at least during childhood. Therefore, we explored the role of iron overload in the vascular functional impairment caused by hyperglycemia at the cellular level. The results demonstrated that, compared with high glucose alone, ferric citrate could potentiate cell damage in a concentration-dependent manner, as apoptosis increased and viability decreased. Ferric citrate also decreased NO and increased ET levels in cell supernatants and changed the NO to ET ratio, which resulted in vasodilation dysfunction. Furthermore, ferric citrate increased oxidative stress, as measured by ROS, MDA, and SOD content. The iron chelator DFO or the reducing agent NAC could rescue the damage caused by high glucose and ferric citrate, which further confirmed the effect of iron overload and the involvement of oxidative stress. NAC could also offset the cell injury caused by high glucose.
Among many factors inducing hyperglycemia-induced endothelial cell dysfunction, the NF-κB pathway is important. NF-kB activation also mediates the oxidative stress caused by AGE-LDL.44 45 The NF-κB pathway may also play a role in ferritin-induced endothelial cell dysfunction. Ferric citrate also potentiated the cell damage caused by high glucose. However, it is unclear whether the NF-κB pathway is involved in the aggravating effects of ferritin citrate or what downstream signal pathway may be involved after the NF-κB activation. To test if NF-κB pathway was involved, p-p65 was evaluated in different cell groups. Cells cultured with ferritin citrate and high glucose expressed increased levels of p-p65 compared with cells cultured with high glucose alone. In addition, more p-p65 translocated to the cell nucleus in the HG+FC group, indicating increased activation of the NF-κB pathway when ferritin citrate was added to cells under high glucose conditions. The NF-κB pathway inhibitor BAY 11-7082 reduced the cell damage caused by ferritin citrate and high glucose similar to the offsetting effect of DFO in cell damage, further confirming the involvement of the NF-κB pathway.
DNA microarrays were used to screen the downstream genes after NF-kB activation. The expression of 19 genes was increased by more than twofold, of which the upregulation of 6 genes potentially involved in the observed cell damage (AKT1, CCL2, ICAM1, CXCL8, NF-κB2, TNF) was confirmed by quantitative PCR. Gene ontology enrichment analyses revealed that inflammatory response, lipopolysaccharide-mediated signaling pathway, protein kinase B signaling, and positive regulation of NO biosynthesis are the main processes activated in cells in response to iron overload and high glucose.
The current study has two possible limitations. First, even though it is the first study on ferritin levels, IMT, and glucose status in obese children, the sample size of 196 may introduce bias. Second, although we revealed that iron overload aggravated high glucose-induced endothelial dysfunction at the cellular level, as a cross-sectional study, we failed to reveal a relationship between IMT and ferritin or blood glucose in obese children. A follow-up of patients to measure IMT and ferritin levels may help show the long-term impact of iron overload on the early changes leading to arteriosclerosis.
In conclusion, the current study shows that obese children have higher ferritin levels compared with their healthy peers. Ferritin levels were positively correlated with hemoglobin levels, which were also increased in obese children. Furthermore, ferritin levels were positively correlated with obesity-related metabolic disorders, including impaired glucose tolerance, higher blood pressure, dyslipidemia, and impaired hepatic function. Although there was no correlation between artery morphological change and ferritin or blood glucose levels, the results at the cellular level showed a significantly higher rate of apoptosis, higher levels of oxidative stress, and impaired vasomotor function caused by iron overload under high glucose but not low glucose conditions. NF-κB activation, inflammatory response, lipopolysaccharide-mediated signaling pathway, protein kinase B signaling, and regulation of NO biosynthesis may be involved in the high glucose-induced cell damage aggravated by iron overload. Evaluating iron load as well as determining the optimal levels of iron in obese children, especially those with hyperglycemia, may help reduce endothelial cell dysfunction and decrease future risk of cardiovascular disease.
Acknowledgments
We are indebted to all the patients who participated in this research.
References
Footnotes
Contributors WW: design of the work, data collection, data analysis and interpretation, drafting the article, final approval of the version to be published. JY: data collection, data analysis and interpretation, final approval of the version to be published. YS, YY: data analysis and interpretation, final approval of the version to be published. XC, LZ, KH, JZ: data collection, final approval of the version to be published. G-PD: conception of the work, data collection, critical revision of the article, final approval of the version to be published. JF: critical revision of the article, final approval of the version to be published.
Funding This study was supported by the National Key Research and Development Program of China (no 2016YFC1305301, to JF), National Natural Science Foundation of China (no 81471056, to WW), Research Fund of Zhejiang Major Medical and Health Science and Technology & National Ministry of Health (WKJ-ZJ-1804, to WW), and Zhejiang Province Natural Science Foundation-Zhejiang Society for Mathematical Medicine (LSZ19H070001, to WW).
Competing interests None declared.
Patient consent for publication Not required.
Ethics approval The study was approved by the ethical committee of Children’s Hospital, Zhejiang University, School of Medicine (2016IRB-018).
Provenance and peer review Not commissioned; externally peer reviewed.
Data availability statement Data from this study are available upon reasonable request from the corresponding author.