Article Text

Abstract
Introduction Allostatic load (AL) defines cardiometabolic, inflammatory, and neuroendocrine changes in the body in response to internal and external stressors. It is largely unknown whether gestational diabetes mellitus (GDM) alters maternal and fetal AL, which in turn affects GDM outcomes. Whether dietary intakes and quality can modify AL and thus influence GDM progression is also unknown.
Research design and methods In this study, we recruited 35 GDM and 30 non-GDM women in gestational week 25–33. Fasting blood samples were collected at enrollment, and cord venous blood samples were collected at delivery for the measurement of a series of AL biomarkers to calculate the composite AL index. Three-day dietary recalls were conducted at enrollment.
Results Results suggest that GDM women had 60% higher composite AL index scores (p value=0.01). Maternal AL index was associated with shorter duration of gestation (β=−0.33, p value=0.047) and higher fetal AL index (β=0.47, p value=0.006) after adjusting for GDM status. Dietary intake of monounsaturated fatty acids was negatively associated with maternal AL index (β=−0.20, p value=0.006). GDM women had lower total caloric intake and dietary glycemic load, yet their linolenic acid, vitamin C and E intakes were also decreased (all p value<0.05). These dietary differences were not related to birth outcomes measured.
Conclusions In this study, GDM status and dietary intakes modify AL in this population. AL may serve as an indicator of GDM control. Future research on dietary interventions that can improve maternal AL markers during GDM is warranted.
- diabetes
- gestational
- diet
- nutrients
This is an open access article distributed in accordance with the Creative Commons Attribution Non Commercial (CC BY-NC 4.0) license, which permits others to distribute, remix, adapt, build upon this work non-commercially, and license their derivative works on different terms, provided the original work is properly cited, appropriate credit is given, any changes made indicated, and the use is non-commercial. See: http://creativecommons.org/licenses/by-nc/4.0/.
Statistics from Altmetric.com
Significance of this study
What is already known about this subject?
Allostatic load (AL), characterized by cardiometabolic, inflammatory and neuroendocrine changes in the body in response to internal and external stressors, is elevated in type 2 diabetes.
Diet is a modifier of AL.
What are the new findings?
Pregnant women with gestational diabetes mellitus (GDM) have higher AL scores than euglycemic pregnant women.
Maternal AL in midgestation is associated with shorter gestational length and higher AL in fetal cord blood.
The dietary intake of monounsaturated fatty acids is inversely associated with AL in pregnant women.
How might these results change the focus of research or clinical practice?
These results highlight the possibility of using AL as a marker for GDM monitoring and pregnancy outcome prediction.
These results inform future research focused on dietary intervention to alleviate maternal AL during pregnancy.
Introduction
Gestational diabetes mellitus (GDM) is a public health concern that affects 9% of pregnancies in the USA.1 This disease increases the risk of type 2 diabetes and other cardiometabolic disorders later in life in the mothers and increases the risk of obesity and diabetes in the offspring.2 3 Although normal pregnancy is characterized by insulin resistance, it is only when the increased secretion of insulin is insufficient to cover the greater demand for this hormone during pregnancy that GDM develops.4 The development of GDM and type 2 diabetes share some common pathological processes. The development of type 2 diabetes can be characterized by an array of cardiometabolic, neuroendocrine, and inflammatory markers, collectively known as ‘allostatic load’ (AL), reflecting the wear and tear on the body in response to physical, environmental, and psychosocial stressors.5 6
The AL index is a composite score of subclinical physiological parameters that define AL, and this index has been associated with pregnancy outcomes such as preterm birth,7 8 pre-eclampsia,9 and small for gestational age (SGA).10 However, it is unclear whether AL during pregnancy contributes to the development and progression of GDM and whether the AL index predicts adverse birth outcomes in GDM. Biomarkers that comprise the composite AL index have not been univocal across studies. The original definition of AL index contains 10 biomarkers representing the cardiometabolic and neuroendocrine domains.11 12 Later markers representing the inflammatory domain are added, and the AL index has since been used with different variations in other studies.13–15 We therefore calculated the AL index using 10 markers that are frequently included in AL studies and are potentially relevant to GDM pregnancies based on existing research,6 12 15–17 that is, systolic blood pressure (SBP), diastolic blood pressure (DBP), triglyceride, high-density lipoprotein (HDL), low-density lipoprotein (LDL), free fatty acid (FFA), cortisol, interleukin-6 (IL-6), leptin, and fasting glucose. Most, but not all, studies characterize GDM women as having an altered blood lipid profile, including higher FFA, triglyceride, and triglyceride/HDL levels.16 18–20 These lipid alterations may exacerbate insulin resistance via suppression of insulin-receptor substrate phosphorylation and insulin signaling.21 22 Heightened inflammation is widely believed to suppress insulin signaling in adipose and muscle tissues and thus exacerbate GDM. However, studies of inflammatory markers such as C reactive protein, leptin, tumor necrosis factor alpha, and IL-6 in GDM provide conflicting results.17 23–25 There is limited research on stress hormones, such as cortisol levels, in GDM. In one study, elevated blood cortisol was correlated with decreased glucose tolerance in pregnancy.26 Even less clear is the consequence of alterations in AL markers and GDM on the growth and metabolic profiles of the fetus, as well as the implications for long-term programming of fetal cardiometabolic health.
Nutrition is an important modifier of metabolism and a major strategy to control blood glucose during pregnancy. Intervention studies that provide an energy controlled diet or a low glycemic index diet demonstrate different degrees of success in maternal weight and glycemic control, yet their effects on preventing macrosomia and other growth and metabolic abnormalities in children are, at best, modest.27–31 A few studies investigated the effects of nutrients such as antioxidants, docosahexaenoic acid (DHA), and vitamin D on improving GDM outcomes, targeting their roles in inflammation suppression and oxidative stress reduction, yet the results are preliminary and inconsistent.32–34 Dietary habits such as higher fruit and lower vegetable consumption or higher fat preference have been associated with higher AL in non-pregnant populations with type 2 diabetes or metabolic syndrome.6 35AL is also suggested as a mediator between nutrient-based Dietary Approaches to Stop Hypertension diet score and all cause mortality in the 2001–2010 National Health and Nutrition Examination Surveys.36 Understanding whether calorie and nutrient intakes modify the AL index in both mothers and fetuses during GDM will provide insights into the strategies of medical nutrition therapy in modulating GDM pathophysiology.
In this study, the AL marker alterations during GDM in both maternal and cord blood were analyzed. The association between maternal and fetal AL as well as growth consequences was also determined. Furthermore, the differential calorie and nutrient intakes (as related to GDM) were compared in GDM versus control pregnant women, and their relationship with AL was assessed in the maternal and child dyad in a majority black population in Brooklyn, New York, USA. It was hypothesized that GDM would be associated with elevated AL in both maternal and cord blood, whereas lower caloric intake and higher vitamin C, vitamin D, and DHA consumption would alleviate AL, especially in GDM participants.
Materials and methods
Study population
Between September 2016 and June 2019, pregnant women with GDM and control euglycemic women who attended the prenatal clinic at the State University of New York Downstate Health Sciences University in Brooklyn, New York, USA, were recruited to participate in the study using a convenience sampling methodology. The Downstate prenatal clinic serves a majority black community in East Flatbush, Brooklyn, New York. Inclusion criteria included English speaking, over 21 years of age, gestational weeks between 25 and 33, and singleton pregnancy. Exclusion criteria included pre-existing hyperglycemia, diabetes, cardiovascular conditions including hypercholesterolemia and hypertension that require medical treatment, kidney disease, and liver disease prior to pregnancy. GDM was diagnosed with the two-step process: blood glucose higher than the 140 mg/dL cut-off value after 50 g non-fasting 1 hour and 100 g 3-hour oral glucose challenges.
At enrollment, each participant completed a baseline questionnaire that included demographic and medical information such as age, due date, ethnicity, parity, marital status, education level, occupation, household income, medical insurance, substance use, medication use before and during pregnancy, nutrition supplement use, family history of chronic diseases, and self-reported height and prepregnancy weight.
Dietary analysis
The multipass method of Harnack and colleagues was used to obtain three 24-hour dietary recalls, two on weekdays and one on a weekend day, from each participant by a trained research assistant via phone following the baseline visit.37 38 Food identification, quantity, ingredient specification, and preparation method were recorded into the Nutrition Data System for Research software to analyze nutrient intake. Average daily intakes were calculated as the average daily consumption of nutrients over the 3 days of dietary recalls. In addition, we calculated the intake scores of 13 components (total fruits, whole fruits, total vegetables, greens and beans, whole grains, total protein foods, seafood and plant proteins, dairy, fatty acids, refined grains, sodium, added sugars, and saturated fats) and summarized the overall diet quality using the Healthy Eating Index (HEI) 2015.39–41 We excluded dietary recalls with extremely low (<500 kcal/day) or high (>5000 kcal/day) total energy intake in data analysis.
Sample collection
The participants were instructed to fast overnight for at least 8 hours at enrollment (week 25–33 of gestation), then 10 mL of blood was drawn into a BD EDTA vacutainer blood collection tube (Franklin Lakes, New Jersey, USA). Blood samples were centrifuged for 10 min to retrieve plasma. Immediately after delivery, cord venous blood was collected into an EDTA tube to retrieve plasma. Plasma samples were then stored at −80°C until analysis.
Birth outcome information collection
Obstetric and birth outcome information were collected from medical charts: neonate sex, Apgar scores, mode of delivery, anesthesia use, labor and birth complications, infant mortality, maternal weight before delivery, and the birth outcomes of gestational age, weight, length, and head circumference. Major adverse growth outcomes of interest were summarized from the chart, including large for gestational age (LGA) and SGA.
Ethics
Written informed consent was obtained from each participant before participation in the study.
Analytical measurements
A series of AL biomarkers were measured in maternal and cord venous plasma using commercial assay kits following manufacturers’ instructions. Plasma glucose and triglyceride levels were measured with the Cayman glucose colorimetric assay and triglyceride colorimetric assay kits (Cayman, Ann Arbor, Michigan, USA); HDL and LDL were measured with the Abcam cholesterol assay kit (Abcam, Cambridge, M,assachusetts, USA); FFAs were measured with the NEFA-HR(2) kit from Wako (Wako Diagnostics, Richmond, Virginia, USA); leptin was measured with the human leptin ELISA assay kit from ALPCO (Salem, New Hampshire, USA); IL-6 levels were measured with the human IL-6 ELISA kit from Abcam; and cortisol levels were measured with the cortisol ELISA kit from Arbor Assays (Ann Arbor, Michigan, USA).
The maternal AL index was calculated using binary scores of 10 variables representing the three domains of AL. This method of AL index calculation has been widely used in prior studies.10 15 35 The markers included are plasma leptin and IL-6 for the inflammatory domain, plasma cortisol for the neuroendocrine domain, and plasma LDL, HDL, FFA, triglycerides, fasting glucose, SBP and DBP for the cardiometabolic domain.9 For HDL, the lowest quartile received the score of ‘1’, while the other quartiles received the score of ‘0’. For SBP and DBP, the clinical cut-off values were used: SBP greater than or equal to 120 mm Hg and DBP greater than or equal to 80 mm Hg were given the score of ‘1’. For all other markers, values in the highest quartile were considered as high risk with the score of ‘1’, while the other quartiles received the score of ‘0’. The AL score ranging from 1 to 10 was calculated as the sum of the scores for the 10 biomarker variables. Since we did not have blood pressure data of the neonates, the fetal AL index included eight biomarkers in the cord blood: leptin, IL-6, cortisol, LDL, HDL, FFA, triglycerides, and glucose.
Statistical analyses
For demographic data at baseline, continuous variables were compared between GDM and non-GDM participants using Student’s t-tests; categorical variables were compared using χ2 tests or Fisher’s exact tests for variables that had a category with a sample size less than 5. To compare maternal AL index and individual AL biomarkers between GDM and non-GDM, an analysis of covariance model was used with GDM status as a fixed factor (model 1). To account for potential confounders in the full model (model 2), maternal age, parity, gestational week when biomarkers were measured, neonate sex, race/ethnicity, and maternal education levels were entered as covariates. For cord blood AL index and biomarkers, covariates adjusted in the full model (model 2) included neonate sex, parity, gestational age at birth, and mode of delivery. Prepregnancy BMI (which influences energy requirement) and total energy intake were entered as covariates for dietary intake related analyses in addition to covariates in model 2 (model 3). Model 3 represents the nutrient density in the diet. To assess the association among dietary intakes, birth outcomes (eg, birth weight and gestational length), and maternal/cord biomarkers, as well as the association between maternal and cord plasma biomarkers, linear regression was used adjusting for GDM status and covariates mentioned above (model 4). If there was a trend of interaction between GDM status and AL in their correlation with an outcome (p value <0.1), we conducted a secondary regression analysis stratifying the data by GDM status. Data that were not normally distributed were log-transformed before analyses. These included FFA, triglycerides, glucose, and leptin in the maternal blood, as well as FFA, LDL, triglycerides, IL-6, and leptin in the cord blood. Data were presented as mean±SD. A p value of <0.05 was considered significant. Data were analyzed with SPSS software (V.24).
Results
Study participants and characteristics
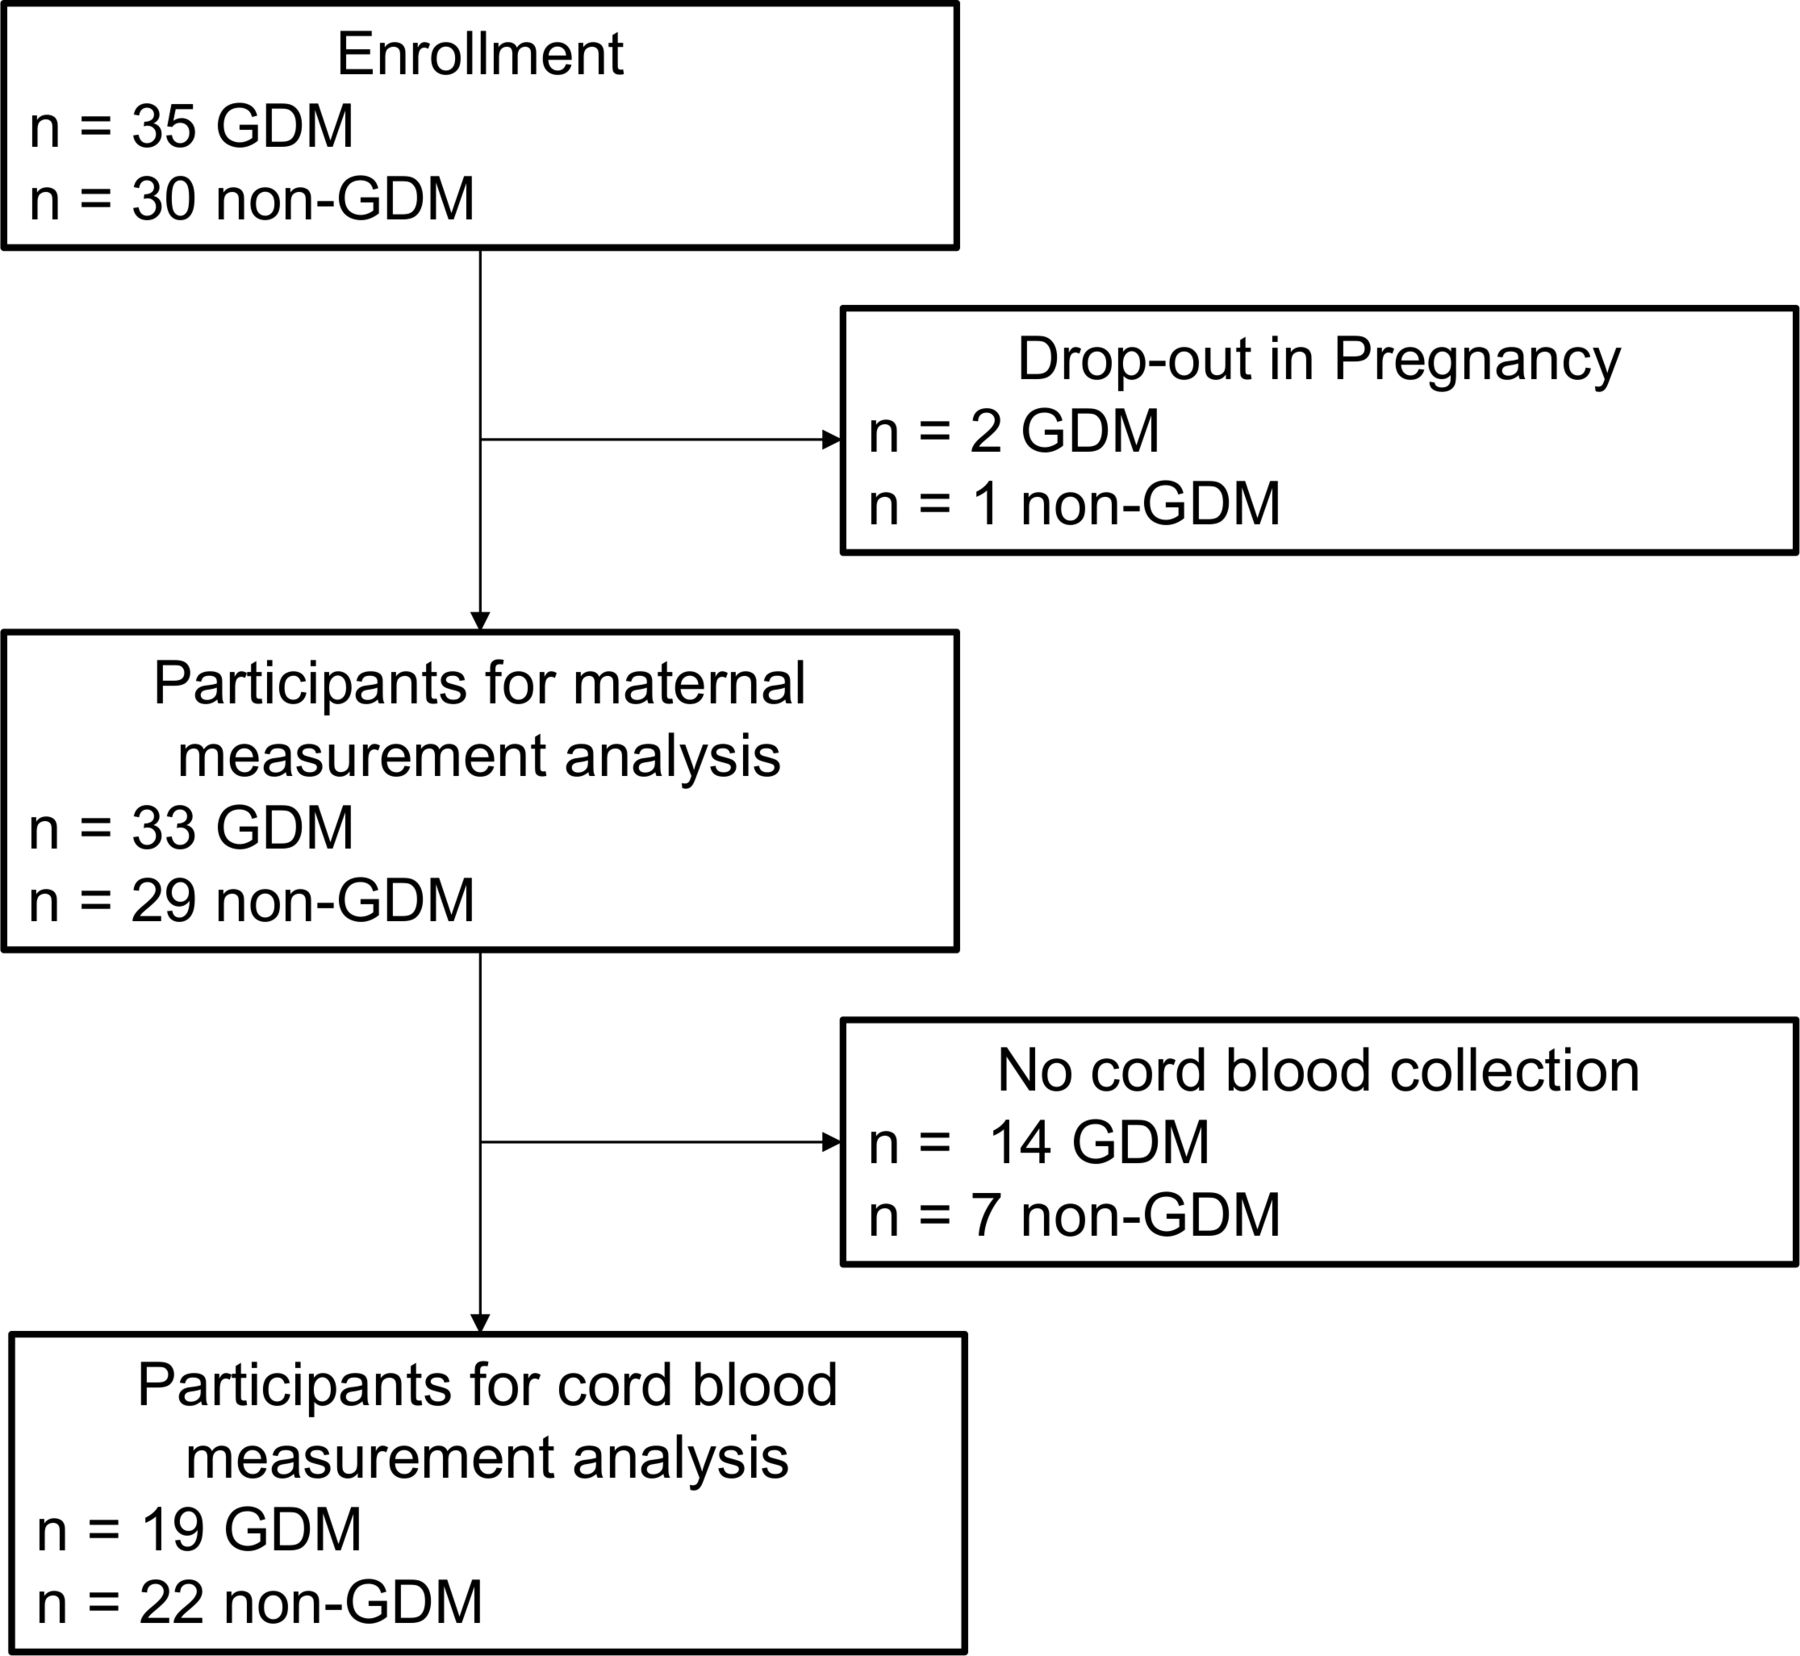
A total of 35 women with GDM and 30 euglycemic women were enrolled (figure 1). There were two participants with GDM and one euglycemic participant who dropped out of the study before completion of dietary recalls and birth outcome data collection. The reasons for drop out were premature delivery and relocation. These participants were excluded from the data analysis. Cord blood samples were retrieved from 19 GDM participants and 22 euglycemic participants (figure 1). Reasons for missed collection were: a prioritized pathological and clinical need for the cord blood, preterm delivery, and the team was not informed in time about the delivery. Table 1 summarizes the baseline and pregnancy outcome characteristics of participants. Participants were recruited from the East Flatbush neighborhood in Brooklyn, New York, USA. Of the 62 participants, 85% (n=53) were non-Hispanic blacks. The GDM group had higher self-reported prepregnancy BMI than the non-GDM group (p value <0.01). There were no significant differences in maternal age, parity, race/ethnicity, and education levels between the two groups.
Flow chart of the study. GDM, gestational diabetes mellitus.
Baseline and birth outcome characteristics of participants*
Maternal BMI at delivery was higher in the GDM versus non-GDM group (p value <0.01), yet gestational weight gain of the two groups was comparable (p value >0.05) (table 1). The gestational age at delivery was lower (p value <0.01) and the preterm delivery rate (p value <0.01) was higher in GDM versus non-GDM participants. There were also more LGA (p value <0.01) infants in the GDM versus non-GDM group. Other birth outcomes, such as cesarean section rate, male/female infant ratio, neonatal mortality rate, birth weight, and SGA incidence were not significantly different between the two groups.
Differences in maternal and cord blood AL
We calculated the composite AL index among the pregnant women at week 25–33 of gestation (see table 2). The maternal composite AL index was significantly higher (p value <0.05, model 2) in the GDM versus non-GDM participants, indicating heightened physiological stress. We also assessed which individual AL markers were altered in GDM. As expected, GDM participants had higher fasting plasma glucose levels than non-GDM participants (p value <0.01, model 2). Among other cardiometabolic markers, triglyceride and FFA levels were both elevated in GDM versus non-GDM (p value <0.05, model 2). Blood pressure, LDL and HDL levels were comparable between the two groups. The two inflammatory markers we measured were IL-6 and leptin. Leptin was elevated (p value <0.05, model 2) in GDM versus non-GDM participants, while IL-6 in the two groups was not significantly different. The neuroendocrine marker cortisol was not modified by GDM status.
Maternal plasma allostatic load markers in GDM and non-GDM participants*
We also measured the AL markers and calculated the composite AL index in available cord blood samples (see table 3). The cord blood AL index did not differ between GDM versus non-GDM group (p value >0.05). When examining individual AL markers, subjects with GDM had elevated glucose levels in the cord blood (all p values <0.05, model 2). Interestingly, unlike in maternal blood, FFA levels were diminished (p value <0.05, model 2) in the GDM versus non-GDM group. The proinflammatory and neuroendocrine markers did not differ between groups in the cord blood.
Cord plasma allostatic load markers in GDM and non-GDM participants*
The relationship between maternal/cord blood al and the birth outcomes
Higher maternal AL index at enrollment was associated with shorter length of gestation (β=−0.33, p value=0.047) after accounting for GDM status and other covariates (model 4). Interestingly, there trended to be a two-way interaction between GDM status and maternal AL index (p value=0.071). When we investigated the AL and gestational length association in GDM and non-GDM pregnancies separately, the inverse association was only seen in GDM (β=−0.52, p value=0.024) but not in non-GDM pregnancies (β=0.17, p value=0.48). Maternal AL was not associated with birth weight.
The maternal composite AL index during pregnancy was positively associated with cord blood AL index at birth (β=0.47, p value=0.006) (model 2). However, the cord blood AL index was not associated with either birth weight or length of gestation.
Dietary intakes and GDM outcomes
The GDM group consumed less total energy per day than the non-GDM group (p value <0.05, model 2). The GDM group also had lower total carbohydrate, linolenic acid, vitamin C, vitamin E intakes, and glycemic load (all p value <0.05, model 2) (table 4). However, after adjusting for total energy intake and prepregnancy BMI (as a proxy of energy requirement) (model 3), only differences in vitamin C remained, suggesting that the decreased acquirement of these nutrients was mainly due to the reduction in total food intake, rather than differences in the nutrient density of the food consumed by the two groups. Total fat, saturated fat, monounsaturated fat (MUFA), polyunsaturated fat (PUFA), linoleic acid, eicosapentaenoic acid (EPA), DHA, and vitamin D intake did not differ by GDM status. The average HEI was 58.9 among these participants, which was comparable with the national average of 59 out of 100.42 GDM status did not alter the HEI. However, when comparing the components of HEI, women with GDM had lower added sugar intakes with higher scores for this HEI component than control (p value <0.01). Birth weight was not associated with any nutrient or energy intake or the HEI and its components that were estimated (online supplemental table 1).
Supplemental material
Differences in dietary intake between GDM and non-GDM participants*
Dietary intakes and maternal and cord blood AL
We then assessed how maternal dietary intakes during midgestation were associated with maternal and cord blood AL. MUFA intake was inversely associated with the maternal composite AL index (β=−0.20, p value=0.006, model 4). Fetal AL was not associated with any of the maternal dietary factors.
Discussion
In this study, we found that maternal AL was elevated in women with GDM in a cohort of participants who are mainly African-Americans in Brooklyn, New York, USA. Maternal AL in midgestation to late gestation was associated with cord blood AL and shorter gestational length. We also discovered that higher MUFA intake was associated with lower maternal AL. These results highlight the potential of using AL as an indicator of outcomes of GDM dietary intervention.
We found for the first time that maternal AL index was elevated in GDM versus non-GDM women at midgestation (25–33 weeks). This result suggests that GDM is indeed a pathological condition characterized by heightened physiological stress in cardiometabolic, neuroendocrine, and immune systems. Maternal AL index was associated with fetal cord blood AL index, suggesting that heightened maternal physiological stress during pregnancy has adverse implications in neonatal cardiometabolic health. Management of maternal AL may be important to restore metabolic health of babies, especially for mothers with GDM. Since AL is highly responsive to psychosocial stressors like financial status and mental health,43 44 our results highlight the potential importance of improving maternal psychosocial factors for the management of GDM.
The composite AL index at midgestation predicted birth outcomes. Moreover, the association of the maternal AL index with length of pregnancy was significant in GDM but not in non-GDM pregnancies, suggesting the possibility of using this index to identify women at risk of adverse GDM pregnancy outcomes, such as preterm birth. This is worthy of further investigation because a marker for GDM management that consistently predicts birth outcomes is still lacking. Maternal blood glucose is one of the most widely used markers of GDM control, yet various studies have shown that controlling maternal glycemia does not always translate into lower risk of adverse birth outcomes, suggesting factors other than maternal glucose influence fetal response and there is a need of using supplemental markers to identify individuals at risk for adverse birth outcomes early on.27–31 In our study, maternal glucose at midgestation to late gestation was also not associated with gestational length (data not shown), while the composite AL was. This in turn underscores the potential advantage of using a composite index, which takes into account of multiple factors to reflect maternal physiological stress and the negative impact on the fetus. Studies with larger sample sizes are needed to validate the use of AL for GDM outcome prediction. We composed the current version of the AL index with markers that we considered as most relevant based on literature, yet future studies may reveal that addition of other markers can improve the index.
Besides the composite AL index, several biomarkers that composed the AL were modified by GDM status in the pregnant women at mid-gestation. FFA was elevated in the GDM group. It is a marker of lipolysis in the body and a mediator of systemic inflammation. The release of FFA from visceral adipose tissue triggers defects in insulin signaling by activating a serine kinase cascade.45 FFA may activate Toll-like receptor-4 and G protein-coupled receptors, activating signaling pathways to promote production and release of inflammatory cytokines such as IL-6.46 Maternal triglycerides were elevated in GDM women, corroborating results from several previous studies, which note dyslipidemia as a risk factor of GDM.16 19 However, we did not observe any changes in cholesterol levels, unlike several other reports.16 19 These discrepancies could be due to the time point of measurement and racial/ethnic difference of cohorts. We observed that the proinflammatory marker leptin was elevated in GDM, which may be related to greater maternal adiposity being a risk factor of GDM. The higher self-reported prepregnancy BMI in the GDM group versus control is in line with this result. Our neuroendocrine measurement using cortisol did not reveal any differences, but it should be noted that chronic stress may be more sensitively reflected by multiple measurements of cortisol47 and inclusion of other stress hormones.
The dietary behavior during pregnancy of the population we studied (majority African-Americans of Caribbean descent) was not well described in previous studies. Moreover, the relationship between dietary intakes and AL during GDM was rarely explored. We observed that GDM women had lower energy and total carbohydrate intake, as well as lower glycemic load and less added sugar intake (higher HEI score on the added sugars component), which may be attributed to their intentional dietary management to restore normal glycemia. However, this behavior may have also led to lower consumption of certain important nutrients, such as the essential omega-3 fatty acid linolenic acid, and the antioxidants vitamin C and vitamin E. Moreover, HEI scores were low in the whole cohort and were not improved in the GDM group. These dietary intake characteristics of GDM women in this population may reflect the deficits in nutrition knowledge to implement a balanced diet for GDM control. Despite lower intakes of carbohydrate and glycemic load in GDM women, these dietary factors were not associated with birthweight outcomes. These results are consistent with previous interventions where controlling maternal glycemia by calorie and glycemic load reduction in the diet did not effectively reduce the risk of macrosomia in the fetus.27–31
Dietary factors had some associations with AL. Interestingly, the type of fat seemed to be the strongest predictor of maternal AL, with MUFA associated with lower maternal AL index—the risk factor for shorter gestational duration in this cohort. Literature suggests that a Mediterranean style diet high in MUFA and PUFA reduced the incidence of GDM and infants that were LGA.48 The efficacy of these fatty acids for dietary intervention and the use of maternal AL index as an indicator of intervention effectiveness during GDM deserve further investigation. A few micronutrients were supplemented to GDM women in previous studies but the intervention outcomes for the mother and child dyad showed mixed results.32–34 Neither vitamin C nor vitamin D intakes modified any growth outcomes or AL in our study, though in some pilot interventions they showed promising results.34 However, since the sample size of this study is relatively small, it may not have enough power to detect all potential nutrient and health outcome associations.
Limitations of this study include a small sample size and missing data for cord blood analysis. However, it is novel in being the first study that investigates AL and its relationship with dietary factors in GDM women in this population. The composite AL index during pregnancy predict alterations in the fetal compartment (cord blood), and it is associated with dietary intakes, providing novel targets of GDM monitoring and intervention. The markers identified from this study warrant further validation in larger studies and different populations.
In conclusion, the current study revealed that maternal AL was elevated in GDM women and associated with birth outcomes and fetal AL. Dietary intakes had modest impacts on AL markers in this population. Future research may be focused on dietary approaches (eg, a Mediterranean diet) to improve maternal AL and determine their implications for improving fetal AL and growth outcomes in GDM.
Acknowledgments
We would like to thank the medical staff at the Labor and Delivery Unit at SUNY Downstate for their help with recruitment and sample collection. We would like to thank Ms Shira Wolfson, Rochelle Karp, and Ashley Morse for their assistance with dietary recalls. We would like to thank all participants in this study for their participation.
References
Supplementary materials
Supplementary Data
This web only file has been produced by the BMJ Publishing Group from an electronic file supplied by the author(s) and has not been edited for content.
Footnotes
Deceased John Kral died on June 2019.
Contributors MD, JK, and XJ designed the study. CJ-R, PM, BK, KE, EG, ID, SZ, and LF acquired data. CJ-R, LH, and XJ analyzed data. LH, LF, W-CL, MD, and XJ interpreted data. CJ-R and XJ wrote the manuscript. LH edited the manuscript. MD and XJ have primary responsibility for the final content of the manuscript. All authors have read and approved the final manuscript.
Funding This study was supported in part by the Interdisciplinary Research Grant of the City University of New York and the research grant of the American Egg Board/Egg Nutrition Center.
Competing interests None declared.
Patient consent for publication Not required.
Ethics approval The study protocol was reviewed and approved by both the City University of New York Institutional Review Board (IRB) (approval ID: 2016–0331) and the SUNY Downstate Health Sciences University IRB (approval ID: 816786).
Provenance and peer review Not commissioned; externally peer reviewed.
Data availability statement Data are available on reasonable request. All data relevant to the study are included in the article or uploaded as supplemental information. Deidentified partipant data are available from XJ (XinyinJiang@brooklyn.cuny.edu) on reasonable request.
Supplemental material This content has been supplied by the author(s). It has not been vetted by BMJ Publishing Group Limited (BMJ) and may not have been peer-reviewed. Any opinions or recommendations discussed are solely those of the author(s) and are not endorsed by BMJ. BMJ disclaims all liability and responsibility arising from any reliance placed on the content. Where the content includes any translated material, BMJ does not warrant the accuracy and reliability of the translations (including but not limited to local regulations, clinical guidelines, terminology, drug names and drug dosages), and is not responsible for any error and/or omissions arising from translation and adaptation or otherwise.