Article Text

Abstract
Introduction Renal tubular injury contributes to the decline in kidney function in patients with diabetes. Cell type-specific DNA methylation patterns have been used to calculate proportions of particular cell types. In this study, we developed a method to detect renal tubular injury in patients with diabetes by detecting exfoliated tubular cells shed into the urine based on tubular cell-specific DNA methylation patterns.
Research design and methods We identified DNA methylation patterns specific for human renal proximal tubular cells through compartment-specific methylome analysis. We next determined the methylation levels of proximal tubule-specific loci in urine sediment of patients with diabetes and analyzed correlation with clinical variables.
Results We identified genomic loci in SMTNL2 and G6PC to be selectively unmethylated in human proximal tubular cells. The methylation levels of SMTNL2 and G6PC in urine sediment, deemed to reflect the proportion of exfoliated proximal tubular cells due to injury, correlated well with each other. Methylation levels of SMTNL2 in urine sediment significantly correlated with the annual decline in estimated glomerular filtration rate. Moreover, addition of urinary SMTNL2 methylation to a model containing known risk factors significantly improved discrimination of patients with diabetes with faster estimated glomerular filtration rate decline.
Conclusions This study demonstrates that patients with diabetes with continual loss in kidney function may be stratified by a specific DNA methylation signature through epigenetic urinalysis and provides further evidence at the level of exfoliated cells in the urine that injury of proximal tubular cells may contribute to pathogenesis of diabetic kidney disease.
- diabetes complications
- kidney diseases
- renal insufficiency
- chronic
- urinalysis
This is an open access article distributed in accordance with the Creative Commons Attribution Non Commercial (CC BY-NC 4.0) license, which permits others to distribute, remix, adapt, build upon this work non-commercially, and license their derivative works on different terms, provided the original work is properly cited, appropriate credit is given, any changes made indicated, and the use is non-commercial. See: http://creativecommons.org/licenses/by-nc/4.0/.
Statistics from Altmetric.com
Significance of this study
What is already known about this subject?
Although renal tubular injury contributes to the decline in kidney function in patients with diabetes, diagnostic tools are limited.
Cell type-specific DNA methylation patterns have been used to calculate proportions of particular cell types in blood, but not in urine.
What are the new findings?
We identified renal proximal tubule-specific DNA methylation patterns and used them as markers of exfoliated tubular cells due to injury in urine sediment.
Urinary DNA methylation markers correlated with kidney function decline in patients with diabetes.
Addition of the urinary DNA methylation marker to a model containing known risk factors significantly improved discrimination of patients with diabetes with faster estimated glomerular filtration rate decline.
How might these results change the focus of research or clinical practice?
A urine test to detect kidney injury by quantifying exfoliated kidney cells in the urine based on the principle that each cell type has a specific DNA methylation pattern would improve detection of renal function decline in patients with diabetes.
The determination of kidney cell type-specific DNA methylation in urine, namely epigenetic urinalysis, allows monitoring of kidney cell turnover in a site-specific manner and improves the non-invasive diagnosis of kidney disease.
INTRODUCTION
Diabetic kidney disease is the leading cause of end stage renal disease worldwide and contributes to all-cause and cardiovascular disease mortality.1 Albuminuria is the biggest predictor of the progression of diabetic kidney disease; however, an increasing number of patients is exhibiting diminished renal function without albuminuria.2 The prevalence of normoalbuminuria in patients with type 2 diabetes with reduced renal function (glomerular filtration rate (GFR) <60 mL/min/1.73 m2) reaches around 40%3 and the mortality among this population has been increasing.4 These observations highlight the need for novel diagnostic means, other than urinary albumin measurement, to detect GFR decline in diabetic kidney disease.
Accumulating evidence indicates that injury of renal proximal tubular cells contributes to the pathogenesis of diabetic kidney disease.5 We previously showed that the degree of tubulointerstitial lesions predicts renal prognosis independent of levels of urinary protein in patients with type 2 diabetes. However, urinary biomarkers of tubular injury, including N-acetyl-beta-d-glucosaminidase (NAG), failed to improve prediction of renal prognosis when added to urinary protein levels,6 suggesting that these makers may not directly reflect tubular injury in diabetes. L-fatty acid binding protein (L-FABP) has been shown to predict estimated glomerular filtration rate (eGFR) decline,7 but not the chronic kidney disease progression in populations including 50%–60% patients with diabetes from the Chronic Renal Insufficiency Cohort Study.8 These reports warrant the development of a novel method to detect tubular injury in diabetes for risk prediction. Given the important role of proximal tubules in the development of diabetic kidney disease,5 9 exfoliated proximal tubular cells excreted into the urine10 could theoretically reflect tubular injury in diabetes, although the method for accurate estimation of the cells contained in the sediment is lacking.11
Tissue-specific DNA methylation is established during the development of each organ.12 DNA methylation has a unique tissue-specific distribution distinct from mRNA expression. Due to its stable nature, tissue-specific DNA methylation pattern is emerging as a cell-specific marker. For example, the DNA methylation signatures of subpopulations of leukocytes have been used to calculate the proportions of different immune cells in unfractionated whole blood,13 14 which is now used for epigenome-wide association studies.15 Detection of changes in tissue-specific DNA methylation of the pancreatic beta cell in the blood derived from injured islets has been suggested to be a novel diagnostic method for detecting type 1 diabetes.16
As a diagnostic tool, DNA methylation has unique characteristics. The copy number of RNA and transcribed proteins can range from zero to more than hundreds depending on the magnitude of gene induction and therefore differs from actual counting of the number of affected cells. In contrast, DNA methylation status strictly reflects the cell number in a linear fashion since each cell has only a pair of DNA strands. Although changes in kidney component cell type-specific DNA methylation in urine sediment are expected to correlate with alterations in the composition of exfoliated cells of urinary system origin, DNA methylation in the urine has not been studied sufficiently to date.
A study reported that DNA methylation in the urine of patients with diabetes could not be consistently,17 but sensitive PCR-based analysis18 has not been employed. In addition, adequate data of cell type-specific DNA methylation of each component of the kidney, which can be used as a marker in the urine, has not been obtained in humans, although we have identified DNA methylation specific for the proximal tubules in mice.19
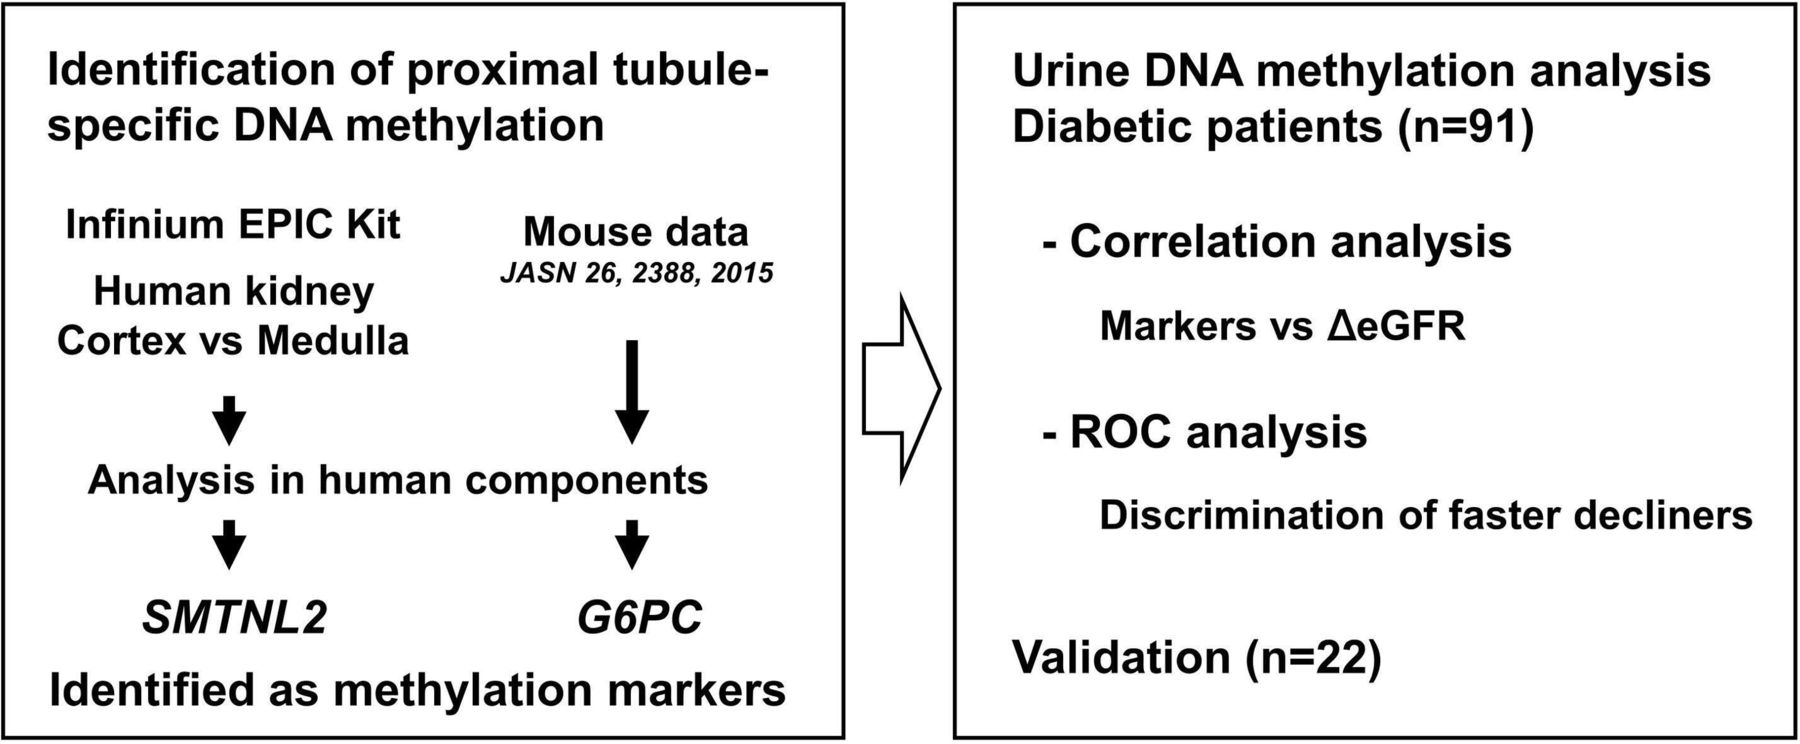
In the present study, we aimed at monitoring kidney cell turnover of patients with diabetes by tissue-specific DNA methylation in the urine. We identified genetic methylation loci specific for the proximal tubular cells using laser microdissected kidney tissues and investigated whether the methylation levels of the tubular cell marker determined in urine sediments exhibit a potential to discriminate patients with diabetes with faster eGFR decline (figure 1).

Flow chart of the present study. CpG sites that are specifically demethylated in the proximal tubular cells were identified. Candidate CpG sites were obtained by comparing the cortex and inner medulla using an Infinium EPIC kit. Candidate CpG sites were also selected through extrapolation from mouse CpG data obtained in our previous study. Following the analysis of microdissected human kidney tissue and bladder epithelia, CpG sites associated with SMTNL2 and G6PC were identified as methylation markers. Methylation levels of the markers were determined in the urine sediments of patients with diabetes, and correlations with eGFR change were determined. The receiver operating characteristic (ROC) analysis was then performed for the discrimination of faster decliners. The association of methylation levels of SMTNL2 in urine sediment with eGFR change was validated in patients with a higher decline in eGFR. eGFR, estimated glomerular filtration rate.
Research design and methods
Clinical samples
To identify tubular cell-specific DNA methylation markers, normal kidney tissues were obtained from non-cancerous kidney tissue resected from nine patients without diabetes with renal cell carcinoma who underwent nephrectomy at Toranomon Hospital (Tokyo, Japan) between January 2015 and August 2018. For the confirmation of tubular methylation markers in patients with diabetes, kidney cortical tissues were obtained from the biopsy samples of four patients with diabetic kidney disease, performed at Toranomon Hospital Kajigaya (Kanagawa, Japan) between February and October 2016. Online supplementary table 1 summaries the clinical parameters. For the urinalysis study, patients with type 2 diabetes, for whom serum creatinine measurements had been done at least six times in a period of >2 years were recruited at the outpatient clinics of The University of Tokyo Hospital (Tokyo, Japan), International University of Health and Welfare, School of Medicine, Mita Hospital (Tokyo, Japan) and Eiju General Hospital (Tokyo, Japan). Urine for DNA methylation analysis was collected at the time of recruitment between January 2017 and September 2018 for the first cohort and between October 2018 and September 2019 for the validation cohort. Patients with eGFR change of <1 mL/min/1.73 m2/year were selected for validation study. The median follow-up period of the first and the validation cohorts were 5.4 years (IQR 4.9–5.8) and 4.5 years (2.8–7.1), respectively. During the follow-up period, there was a median of 37 (29–41) serum creatinine measurements done per patient for the first cohort and a median of 33 (15–62) for the validation cohort. Patients with active tumor, infectious disease, leukocyturia, acute kidney injury, urinary stone disease and active immunosuppressive therapy were excluded. Leukocyturia was determined by either the presence of white blood cell count ≧5/high-power field in the sediment or positive leukocyte esterase results through urine dipstick test. Diabetes was defined as the presence of a fasting blood glucose level of ≧126 mg/dL, the presence of a non-fasting blood glucose ≧200 mg/dL, a self-reported history of diabetes or current use of hypoglycemic medication.
Supplemental material
Tissue preparation
Cryosections of kidney tissue, 10 µm in thickness, on membrane slides (MembraneSlide 1.0 PEN, Carl Zeiss Microscopy GmbH, Gottingen, Germany) were fixed with 4% buffered-paraformaldehyde for 10 min at 4°C and stained with CD10 (NCL-CD10-270, Leica Biosystems, Newcastle upon Tyne, UK, 1:50 dilution) as a marker of proximal tubular cells.20 Immobilized antibody was detected through the alkaline phosphatase staining technique using a Histofine Simple Stain AP Multi kit (Nichirei Biosciences, Tokyo, Japan) and 5-bromo-4-chloro-3-indolylphosphate/nitro blue tetrazolium (SIGMAFAST BCIP/NBT, Sigma-Aldrich, St. Louis, USA). Endogenous alkaline phosphatase in the kidney, if present, is localized exclusively in the proximal tubular cells.21 Sections were counterstained with Kernechtrot solution. For the Infinium assay, cortical tissue and tissue of inner medulla which did not contain CD10-stained cells were dissected with a surgical blade under a microscope. For the compartment-specific analysis, proximal tubular cells, glomeruli and non-proximal tubular cells in the cortex were collected by laser capture microdissection using the PALM MicroBeam (Zeiss, Oberkochen, Germany). To collect proximal tubular cells, those located near glomerulus with a strong CD10 staining in brush border with typical appearance of proximal tubules were selected. Tubules in the cortex without CD10-staining were collected as non-proximal tubular cells. For the confirmation studies of tubular methylation markers in patients with diabetes, proximal tubules were compared with the rest of the cortex, which is kidney cortical tissues after total excision of proximal tubular cells. Cryosections of normal bladder were purchased from BioChain Institute (Newark, California, USA). After staining with Kernechtrot, epithelial cells were collected using a surgical blade under a microscope.
Laboratory measurements
Ten milliliters urine, obtained at the outpatient clinic, was immediately centrifuged at 500 g for 5 min. Supernatants were stored at −80°C until the measurement of creatinine, albumin, L-FABP and NAG. Sediments were washed with PBS, resuspended in 22 μL PBS, divided into 10 and 12 μL aliquots. Using 10 μL aliquots, DNA was purified and quantified to abstain from application of excess DNA to columns of bisulfite conversion. Twelve microliter aliquots were subjected to bisulfite conversion by the DNA Methylation Direct Kit (Zymo Research, Irvine, California, USA). GFR was estimated using the Modification of Diet in Renal Disease equation revised for the Japanese population by the Japanese Society of Nephrology.22 Urinary L-FABP was measured by a chemiluminescent enzyme immunoassay (LUMIPULSE L-FABP, Fujirebio, Tokyo, Japan) and NAG was quantified by an enzymatic assay (Nittobo Medical, Japan). In three samples, the L-FABP concentration was below the detection limit and the corresponding L-FABP-to-creatinine ratio (L-FABP/Cr) value was replaced with the lowest value. Albumin, L-FABP and NAG were indexed to urinary creatinine and underwent logarithmic transformation to improve normality before analysis. Annual change in eGFR was calculated from a least-square regression model using all creatinine measurements up to the time of urine collection. All covariates for the urinalysis study were assessed at the time of urine collection for DNA methylation analysis.
Analysis of DNA methylation
DNA was extracted from cortical tissue and inner medulla of five normal kidney tissues by NucleoSpin Tissue XS. One to six hundred nanograms of DNA was subjected to bisulfite conversion using the EZ DNA Methylation Gold Kit (Zymo Research). Genome-wide DNA methylation analysis was then performed using the Illumina Infinium MethylationEPIC Kit (Illumina, San Diego, California, USA) as described previously.23 The β value ranges from 0.00 to 1.00 and reflects the methylation level of an individual CpG site. Among CpG sites with significant difference in β values between the cortex and the inner medulla, as determined using the paired t-test followed by the adjustment of the false discovery rate to <1% (q<0.01), we focused on the CpG sites with the base sequence ACGT. The CpG sites with this sequence can be analyzed by quantitative combined bisulfite restriction analysis (COBRA), which was used for methylation determination of individual CpG sites in subsequent studies. As the candidate CpG sites of proximal tubule-specific DNA methylation, we chose those CpG sites that had a difference of more than 0.25 in β value and the average β value of inner medulla to be >0.90. The methylation level of each CpG site was measured using quantitative COBRA, as previously described.19 A detailed description of COBRA analysis can be found in the online supplementary data.
Statistical analysis
Multiple parametric comparisons were performed through the Tukey-Kramer test. Comparisons between two groups were performed through the t-test. Correlation of methylation levels of SMTNL2 and G6PC in urine sediment with variables was determined using Pearson’s correlation analysis. To determine the contributions of variables on annual change in eGFR, variables were entered into the multivariate analysis and serially removed based on the Akaike’s Information Criterion. The remained variables were included in the final analysis. The capacity of the methylation levels of SMTNL2 in urine sediment to discriminate patients with faster eGFR decline by its addition to the basal model was analyzed using C-statistics, category-free net reclassification improvement (NRI) and integrated discrimination improvement (IDI).24 25 Patients with diabetes were divided into two groups: faster decliners and others, using a threshold of the 25th percentile of annual change in eGFR, and the population losing eGFR at a rate equal to or more than the 25th percentile was defined as the event group. NRI and IDI were calculated using Stata V.15.1 (StataCorp, College Station, Texas, USA). Other statistical analyses were performed using the JMP Pro V.14.0.0 (SAS Institute, Cary, North Carolina, USA). Two-tailed values of <0.05 were considered to represent statistically significant differences.
Data and resource availability
The data set and resources generated and analyzed in this study are available from the corresponding author on reasonable request.
Results
Identification of proximal tubular cell methylation markers
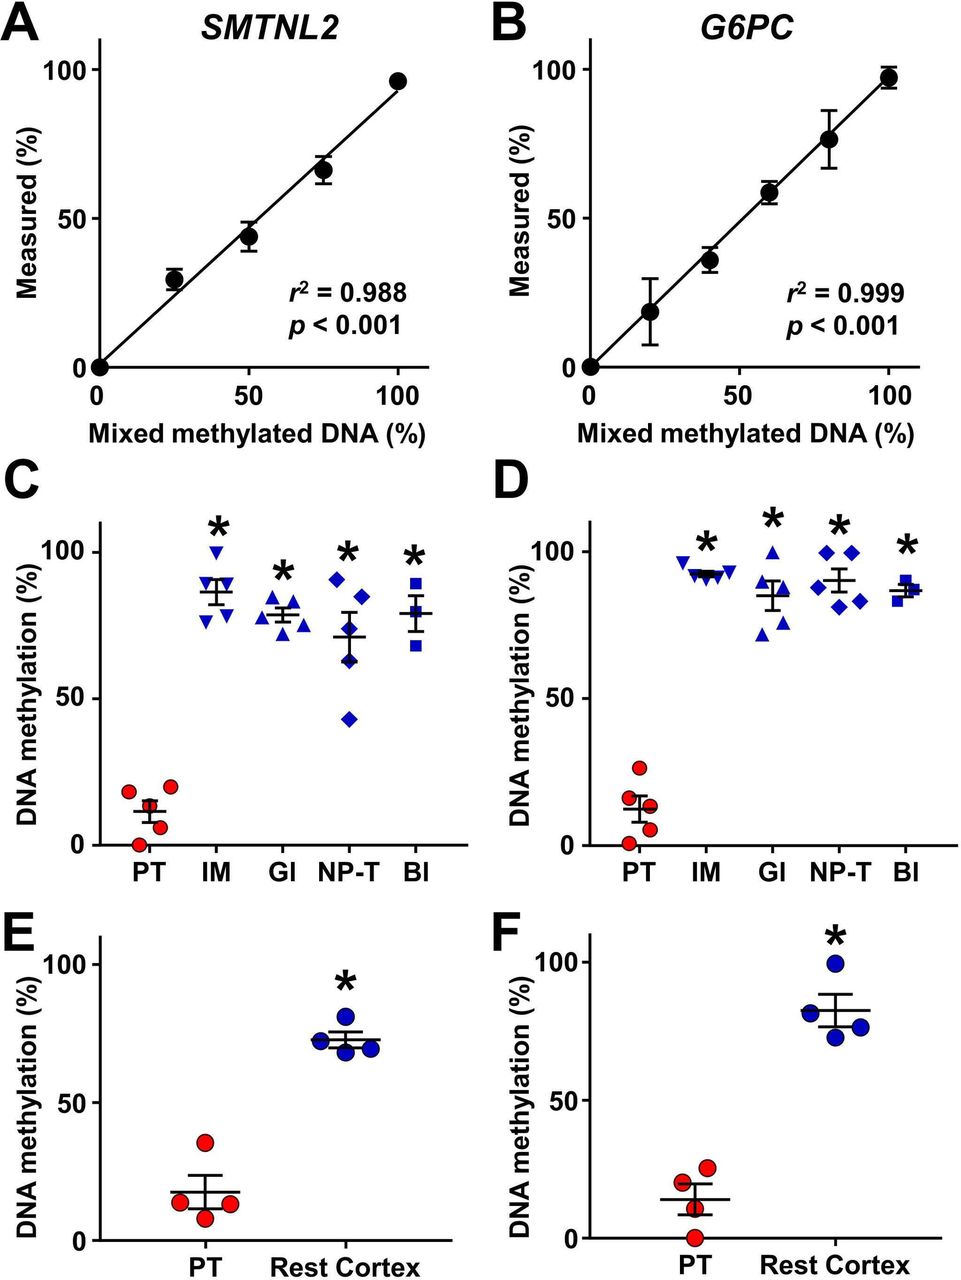
To identify CpG sites exhibiting proximal tubule-specific DNA methylation in the human urinary system, we used two approaches: genome-wide DNA methylation analysis and extrapolation from mouse CpG data obtained in our previous study.19 We first compared DNA methylation levels between the cortex and the inner medulla of normal kidneys using the Infinium MethylationEPIC BeadChip Kit. Seven CpG sites were selected as candidates for proximal tubule-specific DNA methylation (online supplementary table 2). Among the candidates, CpG sites in MSRA, GNA12 and HAO2 were accompanied by another CpG site sensitive to HpyCH4IV, which is used for COBRA, located within 30 base pairs, rendering the evaluation of multiple fragments difficult and, therefore excluded from the further study. Among the rest of the candidates, the mean methylation value of the CpG site located in SMTNL2 obtained from the inner medulla was closest to 100%, indicating the potential of this site to be demethylated in the proximal tubules. This site was detected without PCR bias (figure 2A) and compartment-specific analysis using microdissected tissues obtained from normal kidney revealed that the CpG site of SMTNL2 was indeed selectively demethylated in the proximal tubules as compared with the inner medulla, the glomeruli, the non-proximal tubular cells in the cortex and the bladder epithelium (figure 2C).

Identification of proximal tubule-specific DNA methylation markers. (A, B) Validation of DNA methylation analysis of SMTNL2 (A) and G6PC (B). Control unmethylated DNA was mixed with methylated DNA in the indicated proportions (0%–100%) and analyzed by quantitative combined bisulfite restriction analysis. N=5 for 50% of SMTNL2. N=3 for others. Data are represented as mean values. Error bars represent SEM. The coefficient of determination (r2) was determined based on simple linear regression. (C, D) Selective demethylation of SMTNL2 (C) and G6PC (D) in proximal tubular cells (PT) as compared with the inner medulla (IM), glomeruli (Gl) and non-proximal tubular cells in the cortex (NP-T), obtained from normal kidney, and normal bladder epithelia (Bl). N=5 for kidney components and N=3 for bladder. (E, F) Demethylation of SMTNL2 (E) and G6PC (F) in proximal tubular cells as compared with the rest of cortical tissues of the kidney (Rest Cortex) in patients with diabetes. N=4. In (C–F), each data point represents an individual subject. Midlines and error bars represent the mean values and SEM. *p<0.05 vs PT values.
We also examined methylation levels of several genes including G6pc, which we found to have selectively demethylated in mouse proximal tubular cells.19 In a similar manner as observed in mouse, a CpG site in human G6PC, for which precise PCR primers could be designed (figure 2B), was specifically demethylated in the proximal tubular cells, while it was methylated in the other parts of urinary system (figure 2D).
We next investigated whether the demethylation of SMTNL2 and G6PC in proximal tubules is preserved in patients with diabetes. Using biopsy samples, we compared the methylation levels of the proximal tubules with those of the rest of the cortical tissue after the excision of the proximal tubules. As shown in figure 2E and F, demethylation of both, SMTNL2 and G6PC, in the proximal tubules was maintained in the kidneys of patients with diabetes. Based on these results, we used the methylation levels of SMTNL2 and G6PC as markers of the proximal tubular cells in subsequent urine studies.
Correlation of methylation levels of SMTNL2 and G6PC in urine sediment with each other and with other clinical variables
Since CpG sites of SMTNL2 and G6PC were selectively demethylated in the proximal tubular cells, methylation levels of these genes in urine sediment, which contains multiple cells of urinary tract origin, would likely reflect the proportion of the proximal tubular cells excreted in the urine. Lower methylation values were considered to reflect increased proportion of proximal tubular cells in the urine and therefore to represent tubular injury. To evaluate the clinical values of the methylation markers, we next investigated whether methylation levels of SMTNL2 and G6PC in urine sediment correlate with each other and with other variables in patients with diabetes. Characteristics of the patients are presented in online supplementary table 3. In total, 65% of the patients had systolic blood pressure <140 mm Hg, whereas 34% and 75% had glycated hemoglobin A1c (HbA1c) below 7.0% and 8.0%, respectively. In patients with eGFR <60 mL/min/1.73 m2, 50% were normoalbuminuric. As expected, methylation levels of SMTNL2 and G6PC in urine sediment correlated well with each other, while they showed no correlation with urinary L-FABP/Cr or urinary NAG-to-creatinine ratio (NAG/Cr) (online supplementary table 4, figure 3A). Unlike urinary L-FABP/Cr, which correlated with eGFR, neither of the methylation markers of the proximal tubular cells exhibited correlation with eGFR (online supplementary table 4, figure 3B and C). In contrast to urinary L-FABP/Cr and NAG/Cr, both of which correlated strongly with urinary albumin/Cr, only a weak correlation was observed between methylation levels of SMTNL2 and urinary albumin/Cr and no correlation was observed between urinary albumin/Cr and G6PC (online supplementary table 4, figure 3D and E). These results highlight unique characteristics of methylation markers unlike classical tubular biomarkers, as being rather independent of eGFR and urinary albumin/Cr, the established risk factors for renal insufficiency in patients with diabetes.

Correlations of urinary DNA methylation markers, estimated glomerular filtration rate (eGFR), urinary albumin and annual change in eGFR and the receiver operating characteristic (ROC) curves for discriminating patients with faster eGFR decline by models with and without urinary SMTNL2 methylation or L-FABP. Scatter plots for DNA methylation levels of SMTNL2 and G6PC (A), eGFR and DNA methylation levels of SMTNL2 (B) and G6PC (C), and urinary albumin-to-creatinine ratio and DNA methylation levels of SMTNL2 (D) and G6PC (E). (F) A scatter plot for eGFR and annual eGFR change. (G) A scatter plot for DNA methylation levels of SMTNL2 and annual eGFR change. Pearson’s correlation coefficients (r) and p values are shown in A–G. (H) The ROC curves by model 1 including eGFR and urinary log-transformed albumin-to-creatinine ratio with (red line) and without (black line) urinary SMTNL2 methylation. (I) The ROC curves by model 2 including age, sex, eGFR, log-transformed albumin-to-creatinine ratio, glycated hemoglobin A1c (HbA1c), use of renin-angiotensin-aldosterone system inhibitors and systolic blood pressure with (red line) and without (black line) urinary SMTNL2 methylation. (J) The ROC curves by model 1 including eGFR and urinary log-transformed albumin-to-creatinine ratio with (red line) and without (black line) urinary log-transformed L-FABP-to-creatinine ratio. (K) The ROC curves by model 2 including age, sex, eGFR, log-transformed albumin-to-creatinine ratio, HbA1c, use of renin-angiotensin-aldosterone system inhibitors and systolic blood pressure with (red line) and without (black line) urinary log-transformed L-FABP-to-creatinine ratio. L-FABP, L-fatty acid binding protein.
Correlation of methylation levels of SMTNL2 and G6PC in urine sediment with annual change in eGFR
Since eGFR change has been shown to be useful for predicting the progression of diabetic kidney disease,26 27 we next investigated the association between methylation markers and annual change in eGFR. Univariate analysis revealed that lower eGFR was correlated with larger annual decline in eGFR (table 1, figure 3F). Although higher urinary albumin/Cr and urinary L-FABP/Cr had tendencies to be correlated with larger annual decline in eGFR, these were not statistically significant. Notably, lower methylation levels of SMTNL2 were associated with larger annual decline in eGFR by univariate analysis (table 1, figure 3G). Methylation levels of G6PC showed a tendency of positive correlation with eGFR decline. Multivariate analysis with tubular injury markers and known risk factors of renal insufficiency in patients with diabetes revealed that lower eGFR and lower methylation levels of SMTNL2 were associated with larger annual decline in eGFR (table 1). In patients with preserved renal function, that is, those with eGFR >30 mL/min/1.73 m2, eGFR and lower methylation levels of both SMTNL2 and G6PC were associated with faster rate of decline in eGFR (online supplementary table 5).
Association between annual change in eGFR and variables
Discrimination of faster eGFR decliners by SMTNL2 methylation
To assess the diagnostic potential of DNA methylation, we investigated whether the addition of urinary SMTNL2 methylation levels to models of established risk factors for renal insufficiency in patients with diabetes8 28 would increase the capacity to discriminate patients with faster eGFR decline, which were defined as those losing eGFR at a rate of equal to or more than the 25th percentile of annual eGFR decline (−1.24 mL/min/1.73 m2/year). Addition of urinary SMTNL2 methylation to model 1, which included eGFR and urinary albumin/Cr, improved the area under the receiver operating characteristic curve (C-statistics) from 0.701 to 0.759; a significant improvement in reclassification was observed with category-free NRI and IDI (figure 3H, table 2). Both event and non-event components contributed to the improvement quantified by the overall NRI. C-statistics, NRI and IDI were also improved in model 2, which included age, sex, eGFR, urinary albumin/Cr, HbA1c, use of renin-angiotensin-aldosterone system inhibitors and systolic blood pressure, by the addition of urinary SMTNL2 methylation (figure 3I, table 2). In contrast to urinary SMTNL2 methylation, the addition of L-FABP did not induce meaningful changes in C-statistics; from 0.701 to 0.703 in model 1 and 0.788 to 0.786 in model 2 (figure 3J and K).
Discrimination of faster eGFR decline with or without urinary SMTNL2 DNA methylation in patients with diabetes
Validation of the correlation between methylation levels of SMTNL2 and annual change in eGFR in patients with a higher decline in eGFR
To confirm the association between the methylation levels of SMTNL2 in urine sediment and the deterioration of renal function in patients with a higher decline in eGFR, we recruited patients with diabetes with an eGFR change of <1 mL/min/1.73 m2/year for validation. The clinical parameters of the validation cohort are shown in online supplementary table 6. The eGFR change was significantly faster than that of the first cohort (p<0.05). As a result, 50% of patients had an eGFR of <60 mL/min/1.73 m2 in the validation cohort, in contrast to the first cohort with rather preserved renal function in which 63% of patients showed an eGFR of >60 mL/min/1.73 m2. In the validation cohort with higher eGFR decline, the levels of SMTNL2 methylation correlated with urinary albumin/Cr, but not with eGFR (online supplementary table 7, online supplementary figure 1A,B), which is consistent with the findings of the first cohort. In addition, correlation between SMTNL2 methylation and HbA1c levels was observed. In this cohort, lower eGFR, higher urinary albumin/Cr and higher HbA1c, all of which are established risk factors of diabetic kidney disease, were correlated with higher eGFR decline (table 3, online supplementary figure 1C,D). Importantly, lower methylation levels of SMTNL2 were associated with a larger annual decline in eGFR (table 3, online supplementary figure 1E). Multivariate analysis revealed that eGFR and urinary albumin/Cr were associated with annual decline in eGFR (table 3). Since both HbA1c and urinary albumin/Cr were significantly correlated with methylation levels of SMTNL2 (online supplementary table 7), we next performed analysis without these factors. In this analysis, methylation levels of SMTNL2 and eGFR were selected as variables associated with annual decline in eGFR (table 3).
Association between annual change in eGFR and variables in the validation cohort
Discussion
Tissue-specific methylation signature has been used for diagnosis by estimating the proportion of a particular cell type in blood and cancer.13 14 16 29 30 We showed that this rationale could also be applied to urine sediment. Since recent evidence suggests that injury of proximal tubular cells contributes to the progression of diabetic kidney disease,5 9 we focused on these cells. We first identified the genes G6PC and SMTNL2 to be demethylated selectively in proximal tubules and found that the methylation levels of these genes, most likely indicating the proportion of proximal tubular cells in urine sediment, correlated well with each other in the sediment. The observation that SMTNL2 methylation had minimal correlation with albuminuria and no correlation with eGFR, L-FABP and NAG, indicates that SMTNL2 methylation, through the fact that methylation levels strictly reflect the number of cells, has the potential to detect a unique aspect of kidney injury that is not detected by standard risk factors and existing tubular markers. Indeed, SMTNL2 methylation was correlated with eGFR decline and improved discrimination of faster eGFR decliners independent of eGFR and other clinical variables. We have previously shown that the degree of tubulointerstitial lesions determined by biopsy predicts renal prognosis in patients with type 2 diabetes independently of urinary protein and eGFR.6 We propose that DNA methylation markers faithfully reflecting the number of tubular cells excreted into the urine could detect tubular injury and increase the current capacity of stratifying patients with diabetes with ongoing eGFR decline. The present study also provides further evidence at the level of exfoliated cells in the urine that injury of proximal tubular cells may contribute to pathogenesis of diabetic kidney disease.
In the Empagliflozin Cardiovascular Outcome Event Trial in Type 2 Diabetes Mellitus Patients-Removing Excess Glucose (EMPA-REG OUTCOME) trial, the difference in annual eGFR decline has been used for the estimation of the decrease in kidney function.27 Change in eGFR can also be used for the surrogate end point for trials of chronic kidney disease progression.31 Estimating the risk of end-stage renal disease by extrapolation of the previous rate of change in GFR requires substantial information with multiple creatinine measurements during enough observation period of at least 2 years.32 33 The present study suggests the potential of urinary DNA methylation to discriminate patients with diabetes on faster eGFR decline even without previous creatinine measurements, thus contributing to the diagnosis at an earlier stage. Since this study is a retrospective study, prospective studies are needed to prove the prediction of end-stage renal disease by the methylation marker.
The correlation between SMTNL2 methylation and eGFR decline observed in the first cohort was confirmed in the validation cohort, which contained a higher percentage of patients with an eGFR of <60 mL/min/1.73 m2. In contrast to the first cohort, a correlation of established risk factors and eGFR decline was observed in the validation cohort, suggesting that patients with deteriorating renal function may be discriminated with established risk factors in the population who already exhibit decreased eGFR. In this regard, SMTNL2 methylation analysis for the discrimination of patients with faster eGFR decline may be suitable for a population with preserved renal function exemplified in the first cohort, in which the discrimination of patients with renal function decline is difficult using current methods.
The present study demonstrated that the quantification of proximal tubular cells using a DNA methylation marker improved the diagnostic value of the urine sediment. In addition to the proximal tubular cells, utilization of the methylation signature of glomerulus may improve understanding the course of kidney injury in patients with diabetes in the future. With the identification of diabetes-specific DNA methylation reflecting cumulative glycemic effects,34 the concept of the present study could also be applied to the diagnosis of diabetic kidney disease. We suggest that determination of DNA methylation in urine sediment, namely epigenetic urinalysis, would improve the non-invasive diagnosis of renal function decline in patients with diabetes.
Acknowledgments
The authors would like to thank Dr Shintaro Yagi for helpful discussion, and Ms Mariko Murase for excellent technical assistance. The authors would like to thank Dr Shinji Urakami and surgeons in Department of Urology, and physicians in Nephrology Center, Toranomon Hospital. The authors would also like to thank Drs Kazunori Koyama and Kimiko Ishiguro for recruiting patients and Ms Chie Matsunaga for technical assistance in International University of Health and Welfare.
References
Footnotes
Contributors TM and ToF conceived and designed the work. TM, JH, TaF, EA and YK performed analysis. TM, JH, MY, YU, TO, KY, YA, AS and TS acquired data. TM, JH, MN, NA, DH, YK and ToF interpreted data. TM wrote the manuscript. TM and ToF are the guarantors of this work and, as such, had full access to all of the data in the study and take responsibility for the integrity of the data and the accuracy of the data analysis.
Funding This work was supported by AMED-CREST, Practical Research Project for Life-Style related Diseases including Cardiovascular Diseases and Diabetes Mellitus (JP18ek0210093) and The Translational Research program; Strategic PRomotion for practical application of INnovative medical Technology, TR-SPRINT from Japan Agency for Medical Research and Development, AMED, JSPS KAKENHI (grant numbers 25461230, 15H05788, 16K15466, 18K19533 and 20K08627), the Kidney Foundation, Japan (JFKB19-16) and Okinaka Memorial Institute for Medical Research.
Competing interests Division of Clinical Epigenetics, Research Center for Advanced Science and Technology, The University of Tokyo is an endowment department, supported with an unrestricted grant from Asahi Group Holdings, Astellas Pharma, Chugai Pharmaceutical, EA Pharma, Mitsubishi Tanabe Pharma Corporation, Mochida Pharmaceutical, MSD K.K., Nippon Boehringer Ingelheim, Omron Healthcare, Shionogi & Co. and Toray Industries. TM and ToF are inventors of a patent filed in JP (pending; No.2019-163696) with a title 'A method for evaluation of renal function and discrimination of diabetic patients with renal dysfunction'.
Patient consent for publication Not required.
Ethics approval The protocol of this study was approved by the ethics committees of The University of Tokyo (17-35, 18-32, 18-41, 11289-3), Toranomon Hospital (2014-5), International University of Health and Welfare (2017-8), Eiju General Hospital (2017-8) and Keio University (20180169) (University Hospital Medical Information Network identification number: UMIN000020166). Informed consent was obtained from all the participants before taking part and the procedures fully adhered to the Declaration of Helsinki.
Provenance and peer review Not commissioned; externally peer reviewed.
Data availability statement Data are available on reasonable request. The data set and resources generated and analyzed in this study are available from the corresponding author on reasonable request.