Article Text

Abstract
Introduction This study sought to compare the metabolomic, hormonal and physiological responses to hypoglycemia versus euglycemia during exercise in adults with type 1 diabetes (T1D).
Research design and methods Thirteen individuals with T1D (hemoglobin; 7.0%±1.3% (52.6±13.9 mmol/mol), age; 36±15 years, duration diabetes; 15±12 years) performed a maximum of 45 min submaximal exercise (60%±6% V̇O2max). Retrospectively identified exercise sessions that ended in hypoglycemia ((HypoEx) blood glucose (BG)≤3.9 mmol/L) were compared against a participant-matched euglycemic condition ((EuEx) BG≥4.0, BG≤10.0 mmol/L). Samples were compared for detailed physiological and hormonal parameters as well as metabolically profiled via large scale targeted ultra-high-performance liquid chromatography coupled to tandem mass spectrometry. Data were assessed using univariate and multivariate analysis techniques with false discovery rate adjustment. Significant results were considered at p≤0.05.
Results Cardiorespiratory and counterregulatory hormone responses, whole-body fuel use and perception of fatigue during exercise were similar under conditions of hypoglycemia and euglycemia (BG 3.5±0.3 vs 5.8±1.1 mmol/L, respectively p<0.001). HypoEx was associated with greater adenosine salvage pathway activity (5’-methylthioadenosine, p=0.023 and higher cysteine and methionine metabolism), increased utilization of glucogenic amino acids (glutamine, p=0.021, alanine, aspartate and glutamate metabolism and homoserine/threonine, p=0.045) and evidence of enhanced β-oxidation (lower carnitine p<0.001, higher long-chain acylcarnitines).
Conclusions Exposure to acute hypoglycemia during exercise potentiates alterations in subclinical indices of metabolic stress at the level of the metabolome. However, the physiological responses induced by dynamic physical exercise may mask the symptomatic recognition of mild hypoglycemia during exercise in people with T1D, a potential clinical safety concern that reinforces the need for diligent glucose management.
Trial registration number DRKS00013509.
- hypoglycemia
- exercise
- diabetes mellitus
- type 1
- energy metabolism
This is an open access article distributed in accordance with the Creative Commons Attribution Non Commercial (CC BY-NC 4.0) license, which permits others to distribute, remix, adapt, build upon this work non-commercially, and license their derivative works on different terms, provided the original work is properly cited, appropriate credit is given, any changes made indicated, and the use is non-commercial. See: http://creativecommons.org/licenses/by-nc/4.0/.
Statistics from Altmetric.com
Significance of this study
What is already known about this subject?
Physical exercise-related hypoglycemia is a major clinical concern in the glycemic management of people with type 1 diabetes (T1D).
Although our pathophysiological understanding of hypoglycemia at rest is well established, less is known about the impact of hypoglycemia on physiological, counterregulatory hormone, perceptual effort and bioenergetic responses to dynamic physical exercise in individuals with T1D.
What are the new findings?
Under laboratory-controlled conditions, the physiological, hormonal and metabolomic responses of participants who experienced hypoglycemia while performing aerobic exercise were compared with a euglycemic exercising condition.
Combined with detailed physiological monitoring during exercise, a targeted ultra-high-performance liquid chromatography tandem mass spectrometry approach in the present study has provided new and additive insights of the physiological and bioenergetic responses to exercise under conditions of hypoglycemia and euglycemia in people with T1D.
Physiological and counterregulatory hormone responses, whole-body fuel use and perception of fatigue to exercise were similar under conditions of hypoglycemia and euglycemia; however, mild hypoglycemia during exercise was associated with signs of intracellular imbalance and an increased reliance on energy pathways involved in purine, lipid and amino acid metabolism.
Significance of this study
How might these results change the focus of research or clinical practice?
Hypoglycemia during exercise potentiates alterations in subclinical indices of metabolic stress at the level of the metabolome. However, the physiological responses induced by acute dynamic exercise may mask the symptomatic recognition of hypoglycemia during exercise in people with T1D, a potential clinical safety concern that reinforces the need for diligent glucose management.
Introduction
Despite the benefits of regular physical exercise in aiding long-term glycemia control,1 the acute management of glucose during exercise is challenging for those with T1D. The heightened metabolic demands of exercising skeletal muscle can potentiate increases in tissue glucose uptake through mechanisms independent of, but additive to, insulin.2 3 So to avoid disproportions in the rate of glucose disappearance with the rate of appearance, the body initiates a complex neuroendocrine interplay consisting of a decrement in insulin secretion (to suppress endogenous glucose utilization (EGU) via inhibition of glycogen phosphorylase) opposed by increments in the secretion of glucagon and the catecholamines (which aid endogenous glucose production (EGP) via glycogenolysis and gluconeogenesis).4 5 However, notwithstanding an inability to autoregulate exogenously administered insulin concentrations, the hemodynamic alterations induced by aerobic exercise enhance the mobilization of insulin from the subcutaneous depot.6 7 Hence, the synergistic effects of insulin and exercise in enhancing EGU,8 yet suppressing EGP,9 predispose exercise-related hypoglycemia in T1D.10 11
Although several diabetes-specific recommendations for safe performance of physical exercise exist,12 13 the glycemic response to a given exercise session is highly variable in people with T1D,14 thus predicting an expected glucose trend is difficult. The bioenergetic requirements of exercise are highly dependent on its relative intensity and endogenous fuel availability. During the initial stages of submaximal exercise, intramuscular glycogen serves as the prevailing source of energy, with a growing reliance on bloodborne glucose delivered from hepatic glycogenolysis and gluconeogenesis. However, in addition to attenuated glucose counterregulation,15–18 individuals with T1D also demonstrate diminished hepatic glycogenolysis during both hypoglycemia17 and exercise,19 with a supplementary reliance on gluconeogenesis to support EGP.19 These aberrations in substrate mobilization may contribute to the aberrant bioenergetic responses to exercise commonly observed in those with T1D.20 21
Due to the number of determinants involved in the control of fuel mobilization and metabolism during exercise in people with T1D, assessing the metabolic response to exercise is undoubtedly complex. Although the influence of hyperinsulinemia,8 hyperglycemia22 and exercise modality23 on the metabolic responses to exercise in T1D have recently been investigated, less work has explored the potential implications of acute hypoglycemia during exercise on aspects of energy metabolism in people with T1D, not least because of the practical constraints of safe sample obtention. Given the importance of glucose as a major fuel to support exercising muscle tissue, hypoglycemia may significantly alter the rate and energetic means by which ATP is regenerated during exercise, particularly if combined with inadequate glucose counterregulation. Hence, alongside neurohormonal and physiological analyses, the integration of metabolic profiling techniques that provide insight of energy pathway activity, may advance our current understanding of the metabolic responses to both exercise and hypoglycemia in T1D, and help inform appropriate treatment decisions in clinical care.
Aim
To compare the metabolomic, hormonal and physiological responses to hypoglycemia versus euglycemia during exercise in adults with type 1 diabetes (T1D).
Research design and methods
Study design
This exploratory study involved a retrospective analysis of a single-centre, randomized, open-label, four-period crossover clinical trial consisting of 23 hours inpatient phases with a 45 min evening bout of semi-recumbent cycling at 60±6% V̇O2max. In the hour before and after exercise, participants administered either a full (100%) or reduced (50%) dose of individualized bolus insulin aspart alongside identical carbohydrate (CHO)-rich meals (1 g/CHO/kg/bm). Venous-derived samples were taken hourly leading into cycling, as well as immediately postexercise, then throughout the remaining 14-hour inpatient stay, including nocturnal hours. Trial day hypoglycemia as confirmed by a venous blood glucose (BG) value of ≤3.9 mmol/L. All participants were using unblinded interstitial glucose monitoring devices (Freestyle Libre, Abbott, Lake Bluff, Illinois, USA).
Inclusion and exclusion criteria
Main inclusion criteria were: diagnosis of T1D for ≥12 months; age 18–65 years (both inclusive); body mass index of 18.0–29.4 kg.m2; use of multiple daily injections of insulin for ≥12 months; body mass-specific peak oxygen uptake of ≥20 mL/kg/min and a status of being physically active as assessed by the International Physical Activity Questionnaire Short Form. Main exclusion criteria were: presence of a life-threatening disease (ie, proliferative retinopathy or maculopathy, severe neuropathy), recurrent severe hypoglycemia (>1 severe hypoglycemia event during the previous 12 months), hypoglycemia unawareness, hospitalization for diabetic ketoacidosis during the previous 6 months, any other condition that would interfere with trial participation or evaluation of results as judged by the investigators.
Trial design
As part of a retrospective design using a same-person comparison, the postexercise BG value from each of the four crossover experimental arms was used to identify participants whom on one occasion ended exercise while hypoglycemic ((HypoEx) BG ≤3.9 mmol/L), and on one of the other three trials finished exercise while euglycemic ((EuEx) BG ≥4.0, BG≤10.0 mmol/L).24 The first selection criteria for the comparative euglycemic sample was that which was matched in the pre-exercise bolus insulin dosing manipulation, that is, the PreEx100%-PostEx100% arm was paired with the PreEx100%-PostEx50% arm, while the PreEx50%-PostEx50% arm was paired with the PreEx50%-PostEx100% arm. Failing that, the arm with the highest BG value still within the euglycemic range was selected over a trial that was closer to the hypoglycemic threshold. Of a possible 16 individuals who completed all 4 experimental visits, the data from 13 individuals were suitable for inclusion in this exploratory study.
Moderate-intensity continuous exercise testing protocol and hypoglycemia identification
The evening (17:00) exercise test consisted of maximum of 45 min (3 min warm-up at 20 W, 42 min at target workload) of continuous cycling on a semi-recumbent ergometer (Corival Recumbent, Lode, The Netherlands) at 60±6% V̇O2max. The target workload intensity was computed as the mid-point between the first and second lactate turn points. Participants were instructed to maintain a stable pedal cadence between 65 and 75 revolutions per minute (RPM) against a fixed workload. During exercise, heart rate (HR (s410, Polar, Finland)), respiratory (METAMAX 3B; Cortex Biophysik GmbH, Germany) and power metrics were collected in an integrative nature and measured continuously. The 60 s averages of 5 s intervals were used to determine gas exchange variables rates at rest, following the warm-up, at each 6 min interval over the target workload, and immediately prior to exercise cessation. Rates of CHO and lipid oxidation were determined via indirect calorimetry using the stoichiometric equations suitable for moderate-intensity exercise as described previously.25 O2 pulse was calculated as the  O2/HR ratio. In addition to a 4 μL fingertip BG measurement (used for safety purposes and assessed immediately via the built-in glucometer (Freestyle libre)), a 20 μL capillary blood sample was collected every 6 min from the right earlobe and used for within exercise glucose and lactate analysis via the fully enzymatic-amperometric method ((FEA) Biosen C-Line, EKF Diagnostic, Germany). Rate of perceived exertion (RPE (Borg scale)) was also captured every 6 min. If fingertip BG reached ≤3.9 mmol/L prior to completion of the full 45 min test protocol, exercise testing was terminated immediately. At this point, a venous blood sample was drawn instantly and measured for BG and lactate (BLa). In the event of hypoglycemia, participants received a standardized CHO gel as a rescue aid (Glucogel, BBI Healthcare, UK) and were monitored to ensure recovery to euglycemic levels.
Venous-derived biomarker analysis
The Randox Daytona Plus RX series analyzer (Randox Laboratories, UK) was used for in vitro determination of β-hydroxybutyrate ((β-OHB) RB4067). ELISAs were used for the quantification of plasma glucagon (DGCG0, R&D Systems, Minneapolis, USA) and catecholamines (epinephrine (EPI) and norepinephrine (NE) ECT31-K02, Eagle Biosciences, New Hampshire, USA)). BG and BLa were analyzed via FEA.
Metabolomic sample preparation
To assess the metabolomic responses to exercise-induced hypoglycemia, a metabolic profile of EDTA plasma was acquired by a targeted ultra-high-performance liquid chromatography (reversed phase) coupled to tandem mass spectrometry (UHPLC-MS/MS) approach. Samples were thawed, vortexed and 2×100 µL plasma were transferred into two 96-well plates (1× for large-scale targeted MV026, 1× back-up). The protein precipitation and metabolite extraction were conducted with addition of 300 µL of cold acetonitrile:ethanol 1:1 (volume/volume) containing internal standards. After vortexing, 250 µL of clear supernatant was transferred into a new 96-well plate and dried using speed vacuum. On the day of analysis, samples were reconstituted in 200 µL of 10% methanol in water containing 1 µg/mL chlorpropamide (dilution factor 1:2), vortexed, sonicated for 4 min in a water bath and centrifuged at 4400 g for 20 min at 4°C. The supernatants (150 µL) were transferred into a new 96-well plate and a quality control was prepared pooling 5 µL of each sample. An additional 2×100 µL of serum were extracted and the dried sample was reconstituted in 200 µL (1:2) and 400 µL (1:4) prior to analysis.
UHPLC-MS/MS analysis
Samples were analyzed in a randomized block design order on a triple quadrupole mass spectrometer (Xevo TQ-S, Waters) coupled to an UPLC Acquity I-Class system (Waters) by reversed-phase chromatography. Samples were first analyzed in negative electrospray ionization (ESI) mode followed by positive ESI mode and finally by selected reaction monitoring.
Statistical analysis
All statistical analyses were carried out using IBM SPSS V.26.0 (IBM, Armonk, New York, USA) and R V.3.6.1 (The R Foundation for Statistical Computing, Vienna, Austria). Forward stepwise linear regression was used to explore relationships between trial arm glycemia and its metabolic marker. End of exercise data were assessed by means of univariate analysis with exercise duration, pre-exercise insulin dose amounts (inclusive of basal and bolus amounts), insulin arm (full or reduced dose) and the paring factor accounted for as covariates in the model. False data recovery adjustment was used for the correction of multiple testing. A repeated measures analysis of variance on three levels was conducted with Bonferroni-corrected pairwise comparisons used to examine time effects. Pearson’s correlations were used to explore associations between metabolomic, and hormonal data based on glycemic grouping. Non-parametric equivalents were used when necessary. P values of ≤0.05 were considered to be statistically significant. The raw mass spectrometric data were processed with Skyline (V.19.1, MacCoss Lab). The peak area data of positive and negative ionization mode were combined. The prominence of circulating of metabolites in relation to glycemic grouping was assessed via cluster analysis, while partial least squares-discriminant analysis was performed to map the inter-relationships between all input-output data. Cross-tabulation analysis was used to identify estimated risk ratios (ERR) between nominal variables, with Fisher’s exact test used to report significance.
Results
The baseline characteristics of study participants are detailed in table 1.
Baseline characteristics of study participants
There were no differences between trials in the total daily dose of insulin ((inclusive of basal and bolus doses) HypoEx 44±23 vs EuEx 45±23 U, p=0.395) or total CHO intake (HypoEx 243±38 vs EuEx 242±41 g, p=0.961) taken in the hours leading into exercise. Trials were also identical in the amount of bolus insulin taken in the immediate hour prior to exercise (HypoEx; 4±2 (31% dose reduction) vs EuEx; 4±3 U (38% dose reduction), p=0.674), which was injected alongside the consumption of identical CHO rich meals (1 g/CHO/kg/bm). BG concentrations were similar at baseline (HypoEx 5.8±1.3 vs EuEx 6.6±1.8 mmol/L, p=0.206) and immediately pre-exercise (HypoEx 7.6±2.3 vs EuEx 9.5±2.5 mmol/L, p=0.058).
Physiological and metabolic responses to acute moderate-intensity continuous exercise
The physiological responses at rest, as an exercising mean during the target workload, and immediately at the end of exercise are presented in table 2. There were no differences between groups in any physiological parameter in any of the identified timepoints. Hypoglycemia trended towards slightly earlier test termination (HypoEx 38±8 vs EuEx 44±3 min, p=0.05).
The physiological responses to exercise
Glycemic, metabolic and counterregulatory hormonal responses to exercise
Table 3A details the change in metabolic and counterregulatory hormonal biomarkers in response to exercise, while table 3B displays the point concentrations in biomarkers immediately postexercise.
End of exercise venous derived biomarker concentrations for the hypoglycemia (HypoEx) versus euglycemia (EuEx) trials
End of exercise BG concentrations were significantly lower during HypoEx (table 3, p<0.001). Neither the magnitude of the drop (table 3) nor the rate of change (HypoEx −0.11±0.06 vs EuEx −0.08±0.05 mmol/L/min, p=0.700) in BG differed between trials. There were no other differences between groups in either the exercise-induced change (table 3) or end of exercise concentrations (table 3) in metabolic and counterregulatory hormonal biomarkers.
The exercise-induced change in EPI (r=−0.612, p=0.026), NE (r=−0.902, p<0.001) and β-OHB (r=−0.685, p=0.010) were all inversely related to the exercise-induced change in BG during hypoglycemia but not euglycemia. Additionally, end of exercise EPI (r=−0.669, p=0.012), NE (r=−0.576, p=0.039), glucagon (r=−0.751, p=0.005), β-OHB (r=−0.559, p=0.039) and BLa (r=−0.621, p=0.023) concentrations were all inversely related to end of exercise BG under conditions of hypoglycemia only.
Metabolomic responses to submaximal exercise
Figure 1 provides a multipictorial overview of the systemic metabolic changes during exercise under conditions of hypoglycemia and euglycemia in people with T1D using a targeted UHPLC-MS/MS approach. In total, 87 metabolites were detected, 55 in positive ion mode, 27 in negative ion mode and 5 in both modes. Specifically, the cluster of 1’-methylnicotinamide, L-methionine, citrulline, L-glutamine, pyridoxamine and glucose corresponded to a visible separation between HypoEx and EuEx. Another small cluster was formed by 5’-methyladenosine and cytidine (figure 1B). These results were confirmed from the univariate analysis (figure 1C−E). Further pathway enrichment analysis using the Metaboanalyst platform defined the difference between HypoEx and EuEx to be characterized from cysteine and methionine metabolism as well as alanine, aspartate and glutamate metabolism.
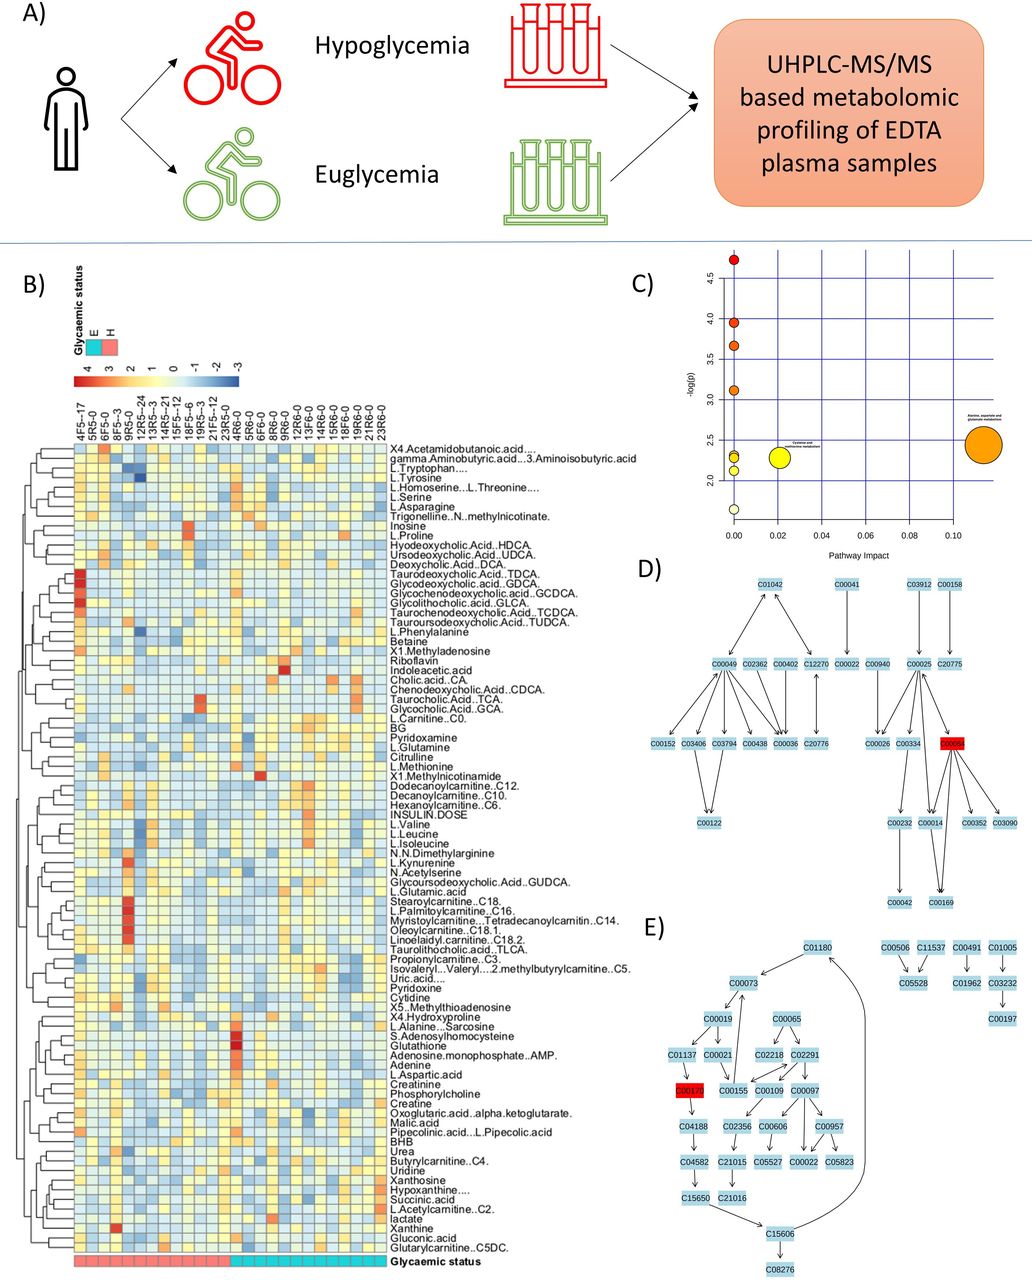
(A) Schematic representation of the experiment. (B) Heat-plot depicting separation quality of hypoglycemia (HypoEx) versus euglycemia (EuEx) at the point of exercise cessation. Some pattern of differences between metabolites for HypoEx versus EuEx is revealed via k-means clustering. Specifically, the cluster of 1’-methylnicotinamide, L-methionine, citrulline, L-glutamine, pyridoxamine and glucose corresponds to a visible separation between hypoglycemia and euglycemia. Another small cluster was formed by 5’-methyladenosine and cytidine. These results were confirmed from the univariate analysis (C–E). Further pathway enrichment analysis using the metaboanalyst platform defined the difference between HypoEx and EuEx to be characterized from cysteine and methionine metabolism as well as alanine, aspartate and glutamate metabolism. UHPLC-MS/MS, ultra-high-performance liquid chromatography (reversed phase) coupled to tandem mass spectrometry.
Figure 2A details the correlation-based metabolic network analysis. Variable closer together have high correlations among them while those opposite have high negative correlations. Variables in the outer circle are the most relevant in driving the HypoEx-EuEx separation. Figure 2B displays the discriminating metabolites that differed significantly between groups at the point of exercise cessation.

Results from multivariate analysis via principle component analysis (A) and box plots of significant metabolites (B) revealed via univariate analyses based on standard linear modeling. E, euglycemia; H, hypoglycemia.
HypoEx was associated with higher 5’-methylthioadenosine (fold change: 1.468±0.515, 95% CI 1.262 to 1.674, p=0.023) and L-homoserine/L-threonine (fold change: 1.108±0.230, 95% CI 1.016 to 1.200, p=0.045), but lower L-glutamine (fold change: 0.898±0.088, 95% CI 0.863 to 0.933, p=0.021) and L-carnitine (fold change: 0.837±0.123, 95% CI 0.788 to 0.886, p<0.001) concentrations (figure 2B).
Discussion
This novel, exploratory study characterized the physiological, pancreatic/counter regulatory hormone and metabolomic responses to euglycemic exercise in adults with T1D and compared them with an exercise session that resulted in hypoglycemia. Combined with detailed physiological monitoring during exercise, integration of an UHPLC-MS/MS platform provided new and additive insights into the influence of hypoglycemia and euglycemia during exercise on the activity of diverse metabolic pathways in people with T1D.
Autonomic system activation during exercise, principally an increase in sympathetic activity, and withdrawal of parasympathetic activity, is critical in facilitating stimulation of several cardiovascular and hemodynamic processes aimed at maintaining glucose and oxygen supply to exercising muscle tissue in the face of increasing intracellular energy demands.26 27 Interestingly, many of the physiological responses to dynamic exercise share similar characteristics with the symptomatic responses to acute hypoglycemia (ie, sympathetic neural activation, sweating, pallor, elevated heart rate, observations of central and peripheral fatigue).28 Thus, it could be postulated that the concurrent appearance of two physiological stressors (ie, exercise and hypoglycemia) would produce greater physiological, metabolic and counterregulatory responses than those induced by exercise and/or hypoglycemia per se. However, despite significant differences in the BG values at the point of sample obtention (~3.5 vs 5.8 mmol/L), we found no influence of hypoglycemia on the cardiorespiratory responses, whole-body fuel use or the perception of effort to the same power output. Hence, it could be possible that for the exercising individual with T1D, the simultaneous occurrence of exercise and hypoglycemia may somewhat hinder the ability to clearly disseminate symptoms that are exclusive to hypoglycemia per se, versus those which are being driven by the physiological strain of dynamic physical exercise per se. Importantly, none of the participants in the present study were hypoglycemic unaware, thus it is intriguing to think of how these responses may have differed in a cohort with such a diagnosis.
The BG value at the end of exercise in hypoglycemic arm fell within the bracket of level 1 hypoglycemia (≥3.0 to ≤3.9 mmo/L) in people with T1D.29 30 Although this was significantly greater than the equivalent euglycemic value, the glycemic threshold for glucose counterregulation in people with T1D is highly individualized and related to the degree of hypoglycemic awareness.31 Strict glycemic control in order to attain target hemoglobin A1c (HbA1c) (~7.1%) can lower the plasma glucose level required to generate a counterregulatory hormone response to concentrations deemed severely hypoglycemic (~2.6 mmol/L), and hence, diminish patient recognition of moderate hypoglycemia.32 Thus, the immediate correction of mild (≤3.9 mmo/L), as opposed to severe (<3.0 mmol/L), hypoglycemia in the present study may explain the similarities in our neurohormonal data, by virtue of our threshold being set ‘too high’, particularly given the appreciable glycemic control of our participants (HbA1c of ~7.0%). This may also explain the observed presence of inverse relationships between BG and the counterregulatory hormones in the hypoglycemic arm only, emphasizing the growing importance of these biomarkers in aiding EGP as glucose declines towards level 2, but not necessarily level 1, hypoglycemia.
Indeed, we observed no discernible differences in either glucagon or catecholamine concentrations under exercising conditions of hypoglycemia and euglycemia, suggesting a failure of mild hypoglycemia to induce sufficient glucose counterregulation in people with T1D, an established finding within literature.17 19 33 The hormonal regulatory effects on gluconeogenesis and glycogenolysis during exercise have been studied extensively, and as per the key principles of glucose counterregulation at rest, a low insulin:glucagon ratio is essential in potentiating EGP to avoid and/or rapidly correct hypoglycemia.34–36 In the current study, our participants likely exercised while hyperinsulinemic, having injected an individualized dose of bolus insulin aspart 60 min prior to cycling that is directly within its peak action (~31–70 min),37 alongside the consumption of a carbohydrate-rich meal (65% carbohydrate content), the latter of which prompts the muscle to preferentially use glucose as a source fuel.38 This may then explain the comparability between groups in both the rate and magnitude of the drop in glucose (both of which were substantial), the presiding contribution of carbohydrate oxidation to the total energy yield (HypoEx 85% vs EuEx 83%, p=0.896), and the inadequate counterregulatory hormonal responses to both exercise and hypoglycemia as separate, and combined, entities.
Undoubtedly, physical exercise is an intense physiological and metabolic stress and requires the integration of multiple organ systems to coordinate the utilization of intracellular and extracellular energy stores to support ATP resynthesis.39 Thus, the use of metabolomics in the present study provided further detailed insights of the metabolic responses to exercise under conditions of hypoglycemia and euglycemia in people with T1D. The elevated concentrations of metabolites involved in purine metabolism during hypoglycemia ((figure 1B), particularly those involved in the salvage pathway, ie, 5'-methylthioadenosine (figure 2B)) imply a higher rate of intracellular ATP turnover.40 41 MTA is rapidly metabolized by 5’-methythioadenosine phosphorylase to yield adenine and 5-methylthioribose-1-phosphate (MTR1P). MTR1P is subsequently converted to methionine while the adenine molecule is salvaged to replenish the AMP and ATP pools.42 Hypoglycemia during exercise was also associated with significant decrements in plasma levels of carnitine and visual increases in clusters of several long-chain (C14–C18) acylcarnitines, suggesting enhanced β-oxidation. Carnitine is responsible for the translocation of long-chain acyl coenzyme A (CoA) (derived from circulating lipids) into the mitochondrial matrix where they undergo oxidation to form acetyl CoA to enter the tricarboxylic acid (TCA) cycle for energy generation.43 Finally, during in-exercise hypoglycemia we observed lower concentrations of various glucogenic amino acids (particularly methionine and glutamine), which can be biologically degraded to form intermediates of the TCA cycle, and latterly used for gluconeogenesis. These findings were supported by our pathway analysis which detailed higher alanine, aspartate and glutamate metabolism as well as cysteine and methionine metabolism, indicating higher amino acid metabolism during hypoglycemia. The cysteine produced via methionine metabolism can be used for the biosynthesis of glutathione, a major antioxidant involved in the direct scavenge of radical species to counteract oxidative stress.44 Hence, our data reaffirm the pro-oxidative effects of hypoglycemia in people with T1D,45 but expand these rested findings to a dynamic exercising environment. The metabolomic signature of hypoglycemia during exercise in the present study was similar to that commonly observed in response to energy-depleting exercise23 46 and/or nutritional deprivation, that is, fasting.47 48 Taken collectively, hypoglycemia during exercise was associated with signs of intracellular imbalance and a consequential increase in the activity of energy pathways involved in purine, lipid and amino metabolism.
Although individual metabolites may function as bioactive effectors, their upstream biochemical pathways are often tightly orchestrated by hormonal shifts.47 While we did not observe any overt hormonal differences between conditions when assessed as point concentrations, there was a trend for more pronounced glucagon (HypoEx; +144% vs EuEx +4%) and epinephrine (HypoEx; +195% vs EuEx +71%) responses to exercise in the hypoglycemic arm. Glucagon and epinephrine promote EGP via glycogenolysis, gluconeogenesis and lipolysis (the latter via the hydrolysis of triglycerides to yield glycerol (which can be used to support gluconeogenesis) and free fatty acids (which undergo the process described above)).49 Thus, it is tempting to speculate that the greater responsiveness of these two hormones during hypoglycemia, may at least partly, explain the divergence in our metabolomic observations, although this hypothesis warrants future exploration. On reflection, it would seem as though while the exposure to acute, level 1 hypoglycemia during exercise may not have been of sufficient duration nor depth to have provoked a potent enough hormonal response, it did appear to potentiate alterations in subclinical indices of metabolic stress at the level of the metabolome.
The high carbohydrate feeding plan leading into exercise in our study the provides reasonable confidence in stating the unlikeliness of significant glycogen depletion over the 45 min submaximal exercise test. It is then interesting to note that hypoglycemia led to an increased utilization of non-carbohydrate containing precursor molecules involved in gluconeogenesis. Previous research has documented attenuated rates of hepatic glycogenolysis during both hypoglycemia17 and exercise19 in people with T1D, a deficit that is supplemented by excessive rates of hepatic gluconeogenesis.19 These alterations in fuel mobilization are believed contributory to the increased risk of recurrent hypoglycemia and hypoglycemia-associated autonomic failure (HAAF) commonly observed in T1D. This led us to perform subanalysis on our data to assess the potential risk of recurrent events. We found that antecedent exercise-induced hypoglycemia was associated with a 1.5-fold increase in the risk of recurrent hypoglycemia in the acute (~6 hours) postexercise period (HypoEx 5 events vs EuEx 1 event, ERR; 1.5 (95% CI 0.959 to 2.370), p=0.06). This was corroborated by a noticeable increase in the amount of time spent in the interstitial-derived hypoglycemic range leading into and throughout the nocturnal hours (HypoEx 2.5±4.6% vs EuEx 0.2%±0.5%, p=0.07), findings with clear clinical relevance. It is well established that antecedent hypoglycemia can attenuate the counterregulatory mechanisms against a subsequent event,50 51 thereby exposing the individual to a vicious cycle of recurrent hypoglycemia—the classic features of HAAF. The concept of HAAF has recently been expanded to an exercise component (EAAF), with the acknowledgment that antecedent exercise itself may impair the counterregulatory defenses to subsequent hypoglycemia.52 53 Hence, using a model during which exercise and hypoglycemia occurred simultaneously, our current findings underline the escalation in the risk of recurrent hypoglycemia when the principles of HAAF and EAAF are combined, reaffirming the importance of diligent glucose monitoring around exercise in people with T1D.
Study strengths, limitations and future recommendations
The application of a validated UHPLC-MS/MS metabolomic profiling platform, combined with counterregulatory hormonal and physiological analyses under controlled laboratory conditions has provided novel insights in the provision and partition of fuel during exercise under conditions of both level 1 hypoglycemia and euglycemia in people with T1D. However, in addition to a small sample size, the homogeneity of study participants including the predominately male gender split, the appreciable glycemic control and the immediate correction of hypoglycemia at a high threshold are important points for consideration when interpreting findings. Further work is needed to deepen our understanding of the influence of hypoglycemia during exercise on various aspects of human physiology in people with T1D.
Conclusion
Exposure to acute hypoglycemia during exercise potentiates alterations in subclinical indices of metabolic stress at the level of the metabolome. However, the physiological responses induced by dynamic physical exercise may mask the symptomatic recognition of mild hypoglycemia during exercise in people with T1D, a potential clinical safety concern that emphasizes the need for increased attention to glucose management.
Acknowledgments
The authors would like to thank the participants for their significant time commitments and adherence to the study protocol. The authors would also like to thank the clinical metabolomics facility at Inselspital, Universitätsspital Bern, for their invaluable contributions to the analysis of these data.
References
Footnotes
Contributors OMcC, OM, RD, MLE, JP and RMB were responsible for data collection. RC, GJD and CJ performed laboratory-based hormonal and metabolic data analysis. OMcC, CTN, LB and RMB were responsible for data interpretation and statistical analyses. OMcC and RMB wrote the manuscript. SCB and RMB were the chief and principle investigators of the study. SCB provided medical oversight for the study. RMB wrote and secured funding for the study. All coauthors contributed to feedback and revisions for the final manuscript.
Funding This study was funded by Novo Nordisk UK as part of an ISS.
Competing interests None declared.
Patient consent for publication Not required.
Ethics approval The study was approved by both the national research ethics committee (16/WA/0394) and the local health authority (EudraCT number: 2017-004774-34; UTN: U1111-1174-6676). The study was carried out in accordance with the 1964 Declaration of Helsinki and the International Conference on Harmonisation Good Clinical Practice (ICH GCP E6 guidelines). All participants were provided with a full written and verbal description of the study and gave informed consent prior to taking part.
Provenance and peer review Not commissioned; externally peer reviewed.
Data availability statement No data are available.