Article Text

Abstract
Introduction To examine the association of sleep duration, insomnia, and obstructive sleep apnea (OSA) with hemoglobin A1c (HbA1c) in a cohort of patients with type 2 diabetes (T2D) on glucose-lowering medications.
Research design and methods 13 346 patients with T2D were included in the present analysis (mean age: 60.2 years; 56.6% were on antidiabetic drug monotherapy; 43.4% received at least two glucose-lowering medications). Sleep duration (short: ≤6 hours/day; normal: 7–8 hours/day; long: ≥9 hours/day) and frequency of insomnia symptoms were self-reported. The risk of OSA was considered high if at least two of the following conditions were fulfilled: regular snoring, frequent daytime sleepiness, and either obesity (≥30 kg/m2) or hypertension (systolic blood pressure ≥140 mm Hg or diastolic blood pressure ≥90 mm Hg). Associations between sleep variables and HbA1c were investigated by analysis of covariance or linear regression (adjusted for, eg, participants’ age, sex, ethnic background, and systolic blood pressure).
Results Long sleep duration and a high risk for OSA were independently associated with higher HbA1c values (long vs normal sleep duration: +0.10% (95% CI 0.03 to 0.18); high vs low risk for OSA: +0.07% (95% CI 0.02 to 0.11), both p=0.004). No robust association was found of short sleep duration and frequent insomnia symptoms with HbA1c. Finally, a positive dose–response association between the number of sleep problems per subject (range: 0–3) and HbA1c was observed (β=0.04% (0.02 to 0.06), p=0.002). However, all significant associations were small.
Conclusion Screening for and treatment of sleep problems may help lower HbA1c levels in patients with T2D on glucose-lowering medications.
- sleep apnea
- obstructive
- sleep
- diabetes mellitus
- type 2
This is an open access article distributed in accordance with the Creative Commons Attribution 4.0 Unported (CC BY 4.0) license, which permits others to copy, redistribute, remix, transform and build upon this work for any purpose, provided the original work is properly cited, a link to the licence is given, and indication of whether changes were made. See: https://creativecommons.org/licenses/by/4.0/.
Statistics from Altmetric.com
Significance of this study
What is already known about this subject?
Epidemiological studies have shown that short and long sleep duration, insomnia, and obstructive sleep apnea (OSA) all correlate with higher hemoglobin A1c (HbA1c) in patients with pre-diabetes and untreated diabetes.
What are the new findings?
Long sleep duration (≥9 hours/day) is associated with higher HbA1c in patients with type 2 diabetes (T2D) on glucose-lowering medications.
High risk of OSA is associated with higher HbA1c in patients with T2D on glucose-lowering medications.
Short sleep duration (≤6 hours/day) and frequent insomnia complaints are not or only weakly associated with HbA1c in patients with T2D on glucose-lowering medications.
All significant associations were small.
How might these results change the focus of research or clinical practice?
Screening for and treatment of sleep problems may help lower HbA1c in patients with T2D on glucose-lowering medications.
Introduction
Patients with type 2 diabetes (T2D) often chronically suffer from sleep problems, such as insomnia, obstructive sleep apnea (OSA), insufficient sleep duration, and hypersomnia.1 This is worrisome as such sleep problems have been linked to impaired glycemic control in patients with T2D.2–6 For example, a cross-sectional study involving 52 patients with T2D found that OSA was associated with higher hemoglobin A1c (HbA1c) values.7 Long-term elevated blood glucose levels, as measured by the HbA1c level, have also been reported for patients with T2D suffering from poor sleep quality.8 Finally, a recent meta-analysis involving 29 649 patients with T2D found that those who reported short (defined as <6 hours) or long (defined as >8 hours) sleep duration exhibited higher HbA1c values.5 Whether poor sleep patterns are linked with higher blood glucose levels among patients with T2D on glucose-lowering medications, such as metformin, has however not been systematically investigated.
In the present study involving 13 346 patients with T2D on antidiabetic medications, we therefore investigated the association of sleep duration, OSA, and insomnia with HbA1c. Data were derived from the UK Biobank baseline investigation. Given that many patients with T2D experience multiple sleep problems,1 we also investigated whether a dose–response relationship exists between the number of sleep problems per subject and HbA1c. Overall, we hypothesized that sleep problems would be associated with higher HbA1c values in patients with T2D on glucose-lowering medications.
Methods
Study design and participants
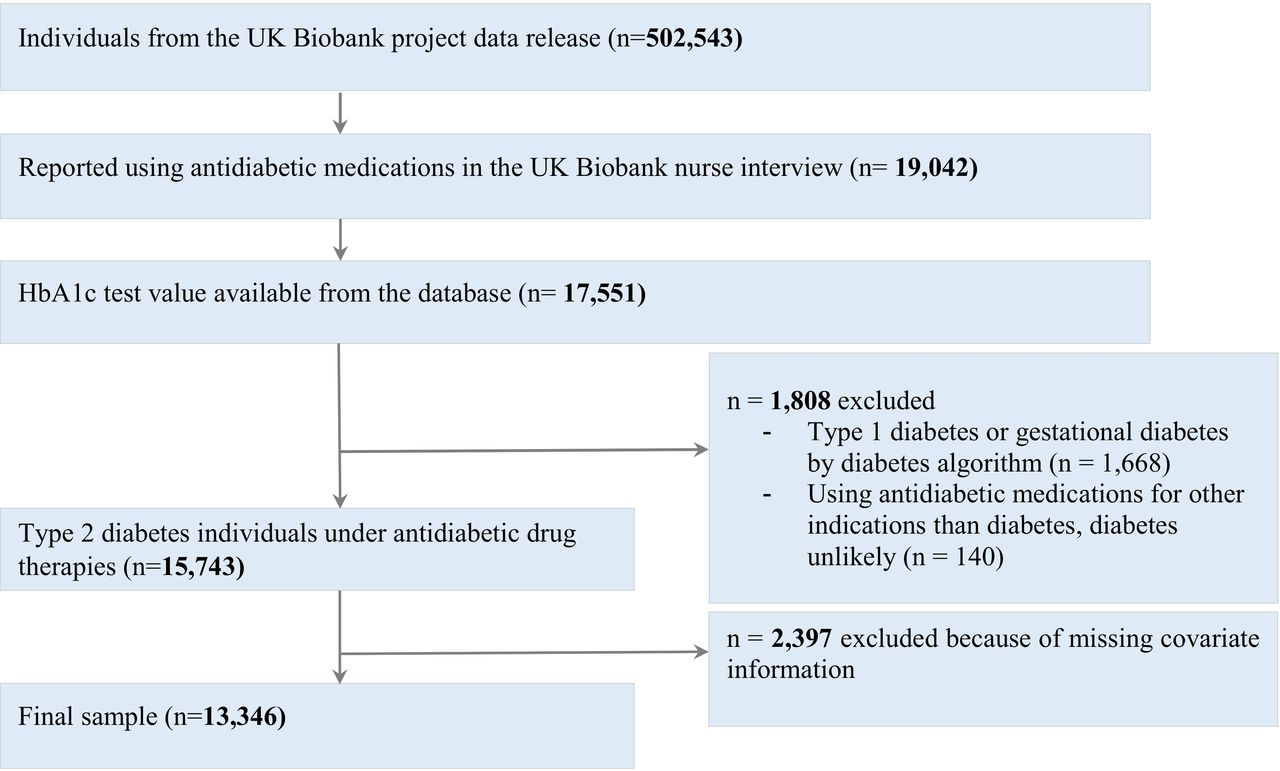
The UK Biobank is a prospective population-based cohort study which enrolled over 500 000 individuals aged between 40 and 69 years. Participants were recruited from across the UK and enrolled at one of the UK Biobank assessment centers. For the present analysis, data were available from 13 346 patients with T2D on glucose-lowering medications who participated in the UK Biobank baseline investigation between 2006 and 2010 (figure 1).

Flow diagram illustrating inclusions and exclusions to arrive at the final cohort. HbA1c, hemoglobin A1c.
Participants were classified as patients with T2D whenever one of the following criteria was met: (1) using a validated algorithm based on self-reported disease, medication, and T2D diagnosis in medical history9; the variables were collected by a self-completed UK Biobank touchscreen questionnaire and through a verbal interview by a trained nurse of the UK Biobank baseline assessment team; and (2) HbA1c level ≥6.5% (48 mmol/mol).10 Information about antidiabetic drug therapies was obtained from the treatment/medication records (UK Biobank Field ID 20003) of the UK Biobank verbal interview. Individuals with probable type 1 diabetes or probable gestational diabetes identified by the diabetes algorithm were excluded from the analysis. Participants gave informed consent.
Assessment of sleep variables
Sleep variables were derived from the UK Biobank touchscreen questionnaire. Sleep duration (ID 1160) was measured by the question ‘About how many hours sleep do you get in every 24 hours? (please include naps)’. For the analysis, sleep duration was divided into the categories short sleep duration (6 hours or less), normal sleep duration (7–8 hours), and long sleep duration (9 hours or more). The frequency of insomnia symptoms (ID 1200) was assessed by the question ‘Do you have trouble falling asleep at night or do you wake up in the middle of the night?’. Participants had the following response options: ‘never/rarely’, ‘sometimes’, and ‘usually’. For the analysis, the response options ‘never/rarely’ and ‘sometimes’ were merged. The risk of OSA was determined by reports of snoring (ID 1210; ‘Does your partner or a close relative or friend complain about your snoring?’; response options: ‘yes’and ‘no’), reports of daytime sleepiness (ID 1220; ‘How likely are you to doze off or fall asleep during the daytime when you don’t mean to?’; response options: ‘never/rarely’, ‘sometimes’, ‘often’, and ‘all of the time’), body mass index (BMI; ID 21001), and blood pressure (ID 4080/93 and 4079/94). Based on the scoring criteria of the Berlin Questionnaire, which is used to assess a person’s risk for OSA,11 the risk for OSA was considered high for UK Biobank participants when two of the three criteria were met: (1) ‘yes’ to the snoring question (ID 1210); (2) ‘often’ or ‘all of the time’ to the daytime sleepiness question (ID 1220); or (3) either obesity (BMI ≥30 kg/m2) or hypertension (systolic blood pressure ≥140 mm Hg or diastolic blood pressure ≥90 mm Hg).
Outcome variable
Blood HbA1c levels (ID 30750) were centrally determined by the UK Biobank with high-performance liquid chromatography using the Bio-Rad VARIANT II TURBO HbA1c analyzer.
Potential confounders
Potential confounders were selected based on the literature.12–15 Age (ID 21003), sex (ID 31), ethnic background (ID 21000), region of UK Biobank assessment center (ID 54; merged into England, Scotland and Wales), Townsend index reflecting socioeconomic status (ID 189), BMI (ID 21001), systolic blood pressure (ID 4080/93), and smoking status (ID 20116) were determined by the UK Biobank reception information, baseline characteristics, touchscreen questionnaire, or physical measurement. The level of physical activity was divided into ‘low’, ‘moderate’ and ‘high’, according to the short-form International Physical Activity Questionnaire (IPAQ) based on the total metabolic equivalent minutes per week.16 The short-form IPAQ questions were included in the UK Biobank touchscreen questionnaire (IDs 864, 874, 884, 894, 904, 914). The duration of T2D was calculated using the self-reported age when diabetes was first diagnosed (ID 2976) and age when the participant attended the UK Biobank assessment center (ID 21003). The therapeutic regimen of T2D was divided into monotherapy and combination therapy according to the antidiabetic medication information (ID 20003) provided in the verbal interview.
Statistical analysis
Associations between sleep variables and HbA1c were determined by analysis of covariance (ANCOVA). The distribution of each continuous variable was visually examined by histograms. Two ANCOVA models were applied to investigate associations of sleep characteristics with HbA1c. Model 1 included participants’ sleep characteristics (ie, sleep duration, OSA, or frequency of insomnia symptoms), age, and sex. Model 2 included participants’ age, sex, ethnic background, Townsend index, BMI, systolic blood pressure, smoking status, level of physical activity, diabetes regimen, diabetes duration, sleep duration, frequency of insomnia symptoms, and risk of OSA. This model was additionally adjusted for the region of the UK Biobank assessment center. In the case of multiple comparisons (ie, when comparing the sleep duration categories with each other), post-hoc Bonferroni corrections were applied (specified in the Results section).
The dose–response association between the number of sleep problems per subject and HbA1c was examined by linear regression analysis. The number of sleep problems per subject was used to create a four-level exposure variable (0=no sleep problem; 1=high risk for OSA OR frequent insomnia symptoms OR short (≤6 hours/day) or long (≥9 hours/day) duration sleeper; 2=two sleep problems; and 3=all three sleep problems). This analysis was adjusted for participants’ age, sex, ethnic background, Townsend index, BMI, systolic blood pressure, smoking status, level of physical activity, diabetes regimen, diabetes duration age, and the region of UK Biobank assessment center.
Overall, a two-sided p value of less than 0.05 was regarded as statistically significant. Analyses were performed with Stata V.15.1.
Results
Cohort characteristics
The characteristics of the study population are presented in table 1. The cohort had a mean HbA1c of 7.21% (95% CI 7.19 to 7.23). Metformin (83.7% of the total population), sulfonylurea (32.9%), and insulin (20.8%) were the three most commonly used glucose-lowering medications. More than half (56.6%) of the individuals with T2D were on monotherapy. About 42% of the patients reported either short (≤6 hours/day) or long (≥9 hours/day) sleep duration. A high risk for OSA was found for 41.7% of the population. Finally, 35.8% of the patients reported frequent insomnia symptoms. The corresponding prevalence rates among non-T2D UK Biobank participants (n=488 310) were 32% for short or long sleep duration, 24% for high risk of OSA, and 28% for frequent insomnia symptoms.
Characteristics of patients (N=13 346)
Sleep characteristics and HbA1c
As shown in table 2, a high risk for OSA was independently associated with higher HbA1c values (mean difference (95% CI) between patients at high risk of OSA and those at low risk of OSA: +0.07% (0.02 to 0.11), p=0.004). We also observed that self-reported long sleep duration was associated with higher HbA1c values (mean difference (95% CI) between patients reporting long sleep duration and those reporting normal sleep duration: +0.10% (0.03 to 0.18), p=0.004 (Bonferroni-corrected), as derived from the ANCOVA model 2; table 2). In the ANCOVA model 1, the mean HbA1c value in patients reporting short sleep duration was 0.08% (0.03 to 0.15) higher than those reporting normal sleep duration (p=0.002, Bonferroni-corrected). However, no significant difference in HbA1c values between short and normal duration sleepers was found in the fully adjusted ANCOVA model 2 (table 2). Finally, no differences in HbA1c between patients reporting frequent insomnia symptoms and those less regularly affected by insomnia symptoms were found (table 2).
Unadjusted and adjusted mean (95% CI) HbA1c levels (%), stratified by risk of OSA, self-reported daily sleep duration, and self-reported insomnia complaints
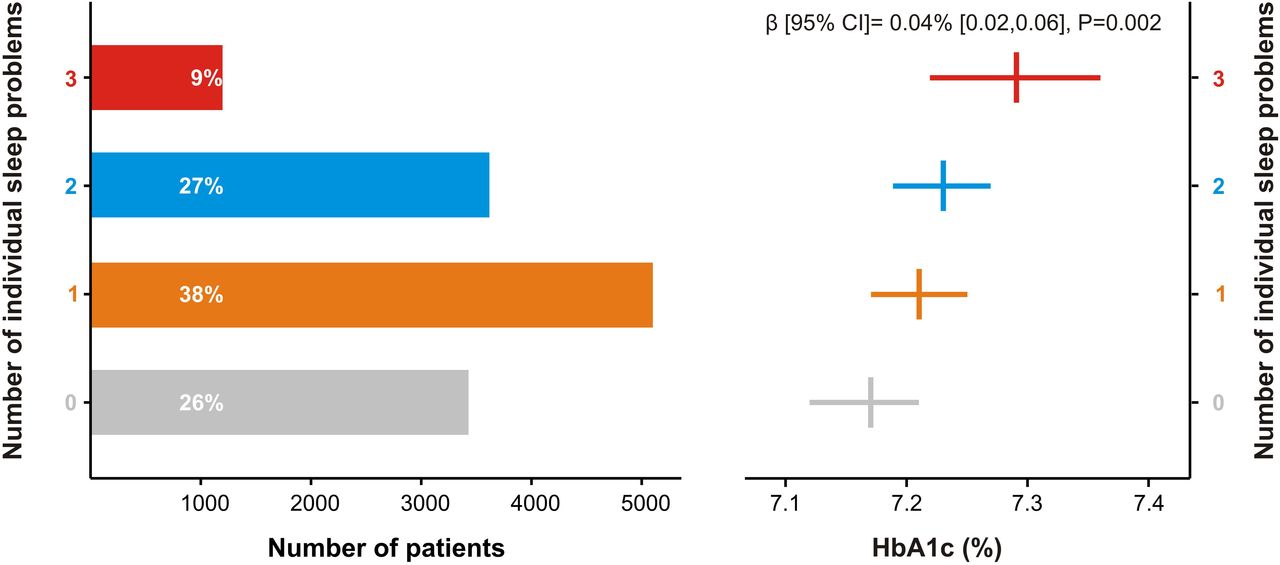
As suggested by the results of a separate linear regression analysis, a positive dose–response relationship was found between the number of sleep problems per patient and HbA1c (β coefficient (95% CI) 0.04% (0.02 to 0.06), p=0.002; figure 2).

Dose–response association between the number of individual sleep problems and HbA1c. The number of sleep problems per subject was used to create a four-level exposure variable (0=no sleep problem; 1=high risk for obstructive sleep apnea OR frequent insomnia symptoms OR short (≤6 hours/day) or long (≥9 hours/day) duration sleeper; 2=two sleep problems; and 3=all three sleep problems). Mean (95% CI) HbA1c values (%) derived from analysis of covariance and were adjusted for age, sex, region of UK Biobank assessment center, ethnic background, Townsend index, body mass index, systolic blood pressure, smoking status, level of physical activity, diabetes regimen, and diabetes duration. HbA1c, hemoglobin A1c.
Conclusions
Using data from the UK Biobank cohort, one main finding was that long sleep duration (≥9 hours/day) was independently linked with higher HbA1c values. Poor sleep quality, sedentary lifestyle, unhealthy dietary choices, and desynchrony between circadian and behavioral states have been proposed as potential mechanisms underlying the association between long sleep duration and impaired metabolic control.17 We also observed a positive association between a high risk for OSA and HbA1c. OSA is characterized by hypoxia during sleep. Both acute and chronic hypoxia result in impaired glucose metabolism.18 19 OSA also leads to shallow and fragmented sleep, which, in addition to hypoxia, may contribute to impaired glycemic control.20 21
In young healthy individuals, brief episodes of curtailed or low-quality sleep have been shown to impair fasting and postprandial insulin sensitivity,22 23 lower glucose tolerance,23 24 and induce a metabolic shift from glucose toward non-glucose oxidation in insulin-dependent tissues (eg, skeletal muscle).25 26 In line with these findings, both short sleep duration and poor sleep quality have been linked to higher HbA1c values in observational studies among patients with T2D.5 6 8 In the present cross-sectional study, neither short sleep duration (defined as ≤6 hours/day) nor frequent insomnia symptoms were independently associated with higher HbA1c in the fully adjusted ANCOVA model. One explanation could be that previous studies often involved heterogeneous patient samples (eg, subjects with pre-diabetes, patients with untreated T2D, and patients with T2D on glucose-lowering medication). Our cross-sectional analysis was restricted to patients with T2D on antidiabetic drug therapy.
Using 7-day wrist actigraphy and sleep questionnaires, a previous study has investigated whether sleep characteristics may act in concert on HbA1c in patients with T2D (N=172).4 In combination, variability in sleep duration, total sleep duration, and subjective sleep quality was most strongly associated with HbA1c (explaining 10.3% of the variance in HbA1c).4 Extending these findings, in the present study, we observed a positive dose–response association between the number of sleep problems per subject and HbA1c. However, no conclusions regarding causality can be drawn due to the cross-sectional study design. It has, for instance, been shown that higher levels of HbA1c are associated with neurodegeneration.27 Neurodegeneration may detrimentally affect the brain regions involved in sleep/wake regulation, and as such explain the observed dose–response association. It could also be assumed that patients with multiple sleep problems may be more likely to make choices that deviate from dietary recommendations in T2D. Studies have, for instance, shown that acute episodes of sleep loss promote the intake of carbohydrate-rich foods,28 29 which may result in increased HbA1c values.
Whatever the underlying mechanism, the results from our study suggest that long sleep duration and a high risk for OSA are associated with higher HbA1c values in patients with T2D on glucose-lowering medications. Our results also indicate that patients with T2D suffering simultaneously from multiple sleep problems may exhibit higher HbA1c values. Thus, studies are warranted to investigate whether concomitant treatment of multiple sleep problems can meaningfully lower HbA1c among patients with T2D.
Strength and limitations
The main strengths of the present study are its sample size and that the results were robust to adjustments. The study also had some limitations. Our results were based on a cohort of patients with T2D of mainly white British ancestry. Thus, our findings must be confirmed in T2D populations of other ethnicities. Besides, sleep variables in the present study were primarily based on self-reports. Thus, large-scale studies using objective measures of sleep, such as actigraphy (for sleep duration and sleep quality), pulse oximetry (for OSA), or sleep polysomnography, are warranted to confirm our findings. Such objective sleep measurements will also help examine the association of other sleep characteristics with HbA1c in patients with T2D (eg, depth of slow-wave sleep; sleep onset and sleep offset variability). Finally, when interpreting our results, it must be borne in mind that the associations between sleep parameters and HbA1c were small. For instance, the HbA1c of patients with T2D at high risk of OSA was about 0.07% higher than that of patients with T2D at low risk of OSA. By comparison, the glucose-lowering drug metformin typically lowers HbA1c by 1.5%–2.0% among patients with T2D.30 Thus, from a clinical point of view, increasing compliance with prescribed glucose-lowering medication may be a higher priority.
Acknowledgments
We thank all the patients who took part in the UK Biobank cohort study. This research has been conducted using the UK Biobank resource under project number 55177.
References
Footnotes
XT and CB contributed equally.
Contributors XT had full access to all the data in the study and takes responsibility for the integrity of the data and the accuracy of the data analysis.
Funding The authors’ work is funded by the Novo Nordisk Foundation (CB; NNF19OC0056777), Swedish Brain Research Foundation (CB; FO2020-0044), Swedish Research Council (CB; 2015-03100), Åke Wiberg Foundation (XT; M18-0169, M19-0266), Fredrik and Ingrid Thuring Foundation (XT; 2019-00488), and the Swedish Society For Medical Research (XT).
Competing interests None declared.
Patient consent for publication Not required.
Ethics approval The UK Biobank received ethics approval from the National Health Service Research Ethics Service (reference 11/NW/0382).
Provenance and peer review Not commissioned; externally peer reviewed.
Data availability statement Data may be obtained from a third party and are not publicly available. Data were derived from the UK Biobank investigation. Thus, data may be obtained from the UK Biobank upon request.