Article Text

Abstract
Objective Exposure to particulate matter (PM) is a risk factor to diabetes, but the underlying mechanism is unclear. Adipokines play important roles in glucose metabolism. This study examined the associations between short-term exposure to ambient PM and adipokine levels and evaluated whether metabolic disorders could enhance susceptibility to PM-induced health effects.
Research design and methods In a panel study (SCOPE, Study Comparing the Cardiometabolic and Respiratory Effects of Air Pollution Exposure on Healthy and Pre-diabetic Individuals) in Beijing, China, 60 pre-diabetic individuals and 60 healthy controls completed two to seven clinical visits. The associations between serum adiponectin, leptin, and resistin levels and the moving average (MA) mass concentration of PM2.5 and number concentrations of ultrafine particles (UFP) and accumulation-mode particles (AMP) during the 1–14 days prior to clinical visits, and the effects of metabolic disorders on any such associations, were evaluated using a linear mixed-effects model.
Results Short-term exposure to ambient UFP and AMP was inversely associated with adipokine levels at 1–14 days prior to clinical visits. For example, each IQR increment in 1 day MA UFP exposure (6.0×10³/cm3) was associated with −14.0% (95% CI −20.9%, −6.4%), −6.6% (95% CI −12.4%, −0.4%), and −8.5% (95% CI −14.5%, −2.2%) changes in adiponectin, leptin, and resistin levels, respectively. There was no significant association between adipokine levels and PM2.5 exposure. UFP and AMP exposure was associated with a greater decrease in adiponectin level and a weaker change in leptin level among participants with high insulin resistance levels. Glucose status did not modify PM-induced changes in adipokine levels.
Conclusion High level of insulin resistance could aggravate the adverse metabolic impact of exposure to UFP and AMP.
- adipokines
- pre-diabetes
- insulin resistance
This is an open access article distributed in accordance with the Creative Commons Attribution Non Commercial (CC BY-NC 4.0) license, which permits others to distribute, remix, adapt, build upon this work non-commercially, and license their derivative works on different terms, provided the original work is properly cited, appropriate credit is given, any changes made indicated, and the use is non-commercial. See: http://creativecommons.org/licenses/by-nc/4.0/.
Statistics from Altmetric.com
Significance of this study
What is already known about this subject?
Exposure to particulate matter (PM) is a risk factor to diabetes, but the underlying mechanism is unclear.
Some epidemiological studies have shown that exposure to PM might be associated with changes in adipokines that play important roles in glucose metabolism.
What are the new findings?
We are the first to report that short-term exposure to small-sized particles, namely, ultrafine particles and accumulation-mode particles, was associated with decrease in the levels of adiponectin, leptin, and resistin.
People with high-insulin resistance levels might have enhanced susceptibility to PM-induced adverse metabolic effects.
How might these results change the focus of research or clinical practice?
PM-induced changes in adipokines should be considered when establishing the biological mechanisms linking PM exposure and the onset and development of diabetes.
Exposure to small particles is important when assessing the health risk of air pollution, especially for vulnerable populations, such as those with metabolic disorders.
Introduction
Diabetes is a chronic, progressive disease characterized by elevated blood glucose and can lead to serious damage to the heart, blood vessels, eyes, kidneys, and nerves. The prevalence of diabetes is increasing worldwide, and in 2016, it was the seventh leading cause of death.1 According to a nationally representative cross-sectional survey, the estimated overall prevalence of diabetes in China was 10.9%. The prevalence in China of pre-diabetes, a state of high risk of diabetes with impaired glucose tolerance and fasting glucose, was 35.7%.2 3 Epidemiological studies have shown that exposure to fine particulate matter (PM2.5) in ambient air is a risk factor for impaired glucose metabolism and the development of diabetes,4–6 but the underlying mechanisms are unclear.
Adipose tissue is an active endocrine organ that secretes multiple bioactive peptides and proteins. Such adipokines, including adiponectin, leptin, and resistin, reportedly play important roles in lipid and glucose metabolism, inflammation, atherosclerosis, hemostasis, and blood-pressure modulation, and are mediators of the links among insulin resistance, diabetes, and obesity.7 Changes in adipokine levels may explain the associations between exposure to air pollution and the onset and progression of diabetes. Despite this, few studies have investigated the effects of exposure to air pollution on adipokine levels. Several epidemiological studies have examined the effects of particulate matter (PM) on adiponectin, leptin, and resistin levels, but the findings were inconclusive.8–16 For example, in the Framingham Heart Study, the adiponectin level was positively associated with the prior 7-day moving average (MA) PM2.5.9 However, Brook et al reported no significant association between the adiponectin level and short-term exposure to PM2.5.11
The inconsistent results may be due in part to the size fraction of PM, an important determinant of toxicity. Particles in small-size fractions, for example, ultrafine particles (UFP, aerodynamic diameter<100 nm) and accumulation-mode particles (AMP, 0.1–2.5 µm), may play important roles in the effects of PM on health.17 Small particles can penetrate deep into the lung, where they are readily deposited. The multiple-path particle dosimetry model developed by the International Commission on Radiological Protection to estimate the deposition of inhaled particles of various sizes in the head/nasopharyngeal, tracheobronchial, and pulmonary/alveolar regions of the respiratory tract indicated that for particles in the size range of 20–100 nm, the deposition in the alveoli increased with decreasing diameter.18 Also, smaller particles have a relatively larger surface area for absorption of toxic compounds.19 20 Although the epidemiological evidence is limited and inconsistent, some human-based studies have reported that, compared with PM2.5, UFP and AMP might have greater adverse impacts on human health21–23; however, their effects on adipokine levels are unclear.
Individuals with diabetes or pre-diabetes are more susceptible to the negative health impacts of air pollution, including oxidative stress and inflammation,24 25 endothelial dysfunction,26 and autonomic nervous system imbalance.27 However, few studies have investigated the susceptibility of such persons to the effects of air pollution on adipokine levels, which would enhance our understanding of the effects on health of air pollution and the underlying mechanisms.
To address the aforementioned limitations, we conducted this work based on a prospective study, Study Comparing the Cardiometabolic and Respiratory Effects of Air Pollution Exposure on Healthy and Pre-diabetic Individuals (SCOPE).28 Participants with pre-diabetes and healthy participants were recruited simultaneously to estimate the associations of short-term exposure to PM with changes in adipokine levels and to examine whether the associations were modified by diabetic state, insulin resistance, and obesity. Particles of different size fractions, that is, PM2.5, UFP, and AMP, were analyzed. Given the high prevalence of pre-diabetes and the severity of air pollution in China, our findings are of considerable importance for public health.
Research design and methods
Study design and population
The design and participant recruitment of SCOPE are described elsewhere.28 Briefly, from August 2013 to February 2015, 120 participants were enrolled to complete two to seven clinical visits at Peking University Hospital, Beijing, China. The participants were screened from among individuals who underwent an annual physical examination at Peking University Hospital in 2013. According to the 1999 WHO diagnostic criteria for pre-diabetes,29 we recruited 60 individuals with pre-diabetes who had fasting blood glucose (FBG) levels of 6.1–7.0 mmol/L during an annual physical examination within 1 year before the clinical visit, as well as 60 healthy controls with normal FBG levels (<6.1 mmol/L); age and gender distributions were comparable between the groups. Among 120 participants, 8 were current smokers, 99 were non-smokers, and 13 were past smokers who had quitted smoking for at least 3 years before enrollment in this study (detailed information of smoking status shown in online supplemental table S1). Regarding the clinical visit arrangement, the interval for consecutive visits for each participant was at least 1 month, and we limited to have only three or four participants on each visit day. During each clinical visit, participants completed questionnaires regarding their sleeping habits, alcohol and food intake, medication usage, secondhand smoke exposure (>0.5 hour), and clinical respiratory symptoms over the previous 3 days.
Supplemental material
Exposure assessment
The ambient PM concentration was monitored continuously at a fixed monitoring station on the roof of a six-story building on the campus of Peking University.28 Except for a main road about 150 m away to the east of the monitoring station, there was no other significant pollution source nearby. Daily PM2.5 samples were collected on teflon filters using an aerosol sampler (TH-16A, Wuhan Tianhong Instruments CO., Ltd., Hubei, China) with a flow rate of 16.7 L/min. Sampling started at 08:00 and ended 07:30 the following day (23.5 hours). A fast mobility particle sizer (FMPS; model 3091, TSI) was used to measure the particle number concentration in the size range of 5.6–560 nm, classified into 32 size channels. Accordingly, we used the size range of 5.6–93.1 nm and 93.1–560 nm to represent UFP and AMP in the study. The number concentration in each size channel was calculated using the following formula, and results were summed to yield the number concentration of UFP and AMP: dN=NC×(log Du−log Dl), where NC is the normalized concentration determined by FMPS; Du and Dl are the largest and smallest diameters of particles in the corresponding size channel; and dN is the number concentration expressed as the number of particles per cubic centimetre of air. Meteorological parameters, including temperature and relative humidity (RH), were measured hourly using TH-16A at the same site. All instruments were maintained and calibrated weekly according to the user’s manuals.
Health assessment
Participants were instructed to fast for at least 8 hours before each clinical visit. All blood samples were drawn into procoagulation tubes by nurses between 08:00 and 09:30. Blood samples were clotted at room temperature for 30 min and centrifuged to isolate serum. Serum was aliquoted into labeled cryotubes and immediately stored at −80℃ until required. The levels of adipokines were measured using Milliplex Multi-Analyte Profiling Kits (Merck Millipore Co.) according to the manufacturer’s instructions. Adiponectin and resistin levels were measured using a human adipokine kit (HADK1MAG-61K) and the level of leptin was measured using a human angiogenesis/growth factor kit (HAGP1MAG-12K).
FBG and fast insulin (FINS) as biomarkers of glucose metabolism were measured immediately after blood collection using an Olympus AU2700 biochemical analyzer at Peking University Hospital. The homeostasis model assessment of insulin resistance (HOMA-IR) score was calculated using the formula HOMA-IR score=FBG×FINS÷22.5.30
Statistical analysis
The 120 participants completed a total of 589 clinical visits. Among them, 8 participants who reported being current smokers during the follow-up visits and 10 who completed only one clinical visit were excluded, leaving 102 participants with a total of 537 clinical visits. A linear mixed-effects model was used to evaluate the associations between the levels of adipokines and exposure to ambient air pollutants. The restricted maximum-likelihood method was used for estimation of random and fixed effects. Specifically, adipokine levels were log-transformed because of their right-skewed distribution and were treated as dependent variables in the model. The concentrations of UFP and AMP in the period from 08:00 on the day before a clinical visit to 07:59 on the day of the visit were converted to 24-hour averages. The MA concentrations of 1–14 days prior to clinical visits (hereafter 1–14 day MA) were calculated. A participant-specific random intercept was included to control for intraindividual variation among repeated clinical measurements. The model was adjusted for the following covariates: temperature, RH, sex, age, body mass index (BMI), FBG, HOMA-IR score, medication usage, season, and day of the week. To account for non-linear effects of covariates with time trend, temperature, RH, and day of the week were adjusted using natural spline functions with four, four and three df, respectively. In susceptibility analyses of subpopulations, glucose status, insulin resistance, and obesity, which were determined by the average FBG, HOMA-IR, and BMI across repeated clinical measurements respectively, were added as first-order interaction terms to account for the modification by metabolic disorder of the associations between adipokine levels and exposure to air pollutants.
In sensitivity analyses, to investigate potential impact of exposure misclassification, the associations between PM exposure and adipokines were examined among the participants who lived within 5 km away from the fixed monitoring station. In addition, we restricted the analyses among participants who completed at least three, four, and five visits, respectively, to see whether the number of visits affected the results.
Data are presented as mean±SD or number (%), as appropriate. Results are reported as percentage changes in adipokine levels per IQR increment of air pollutant concentrations. Statistical analysis was conducted using R statistical software V.3.6.2 (R Development Core Team). A two-tailed p value of <0.05 was considered indicative of statistical significance.
Results
Participants’ characteristics and exposure to air pollutants
Table 1 shows the demographic and clinical characteristics of the participants. With the concern of fluctuated FBG and HOMA-IR levels across the clinical visits, to represent the glucose metabolic status of each participant during the whole follow-up period properly, we reclassified the 102 participants into pre-diabetes group and healthy group based on the cut-off of 6.1 mmol/L for the average FBG across repeated clinical measurements (≤6.1 mmol/L for healthy group). The participants were also separated into high-insulin resistance (HIR) and low-insulin resistance (LIR) groups using a median HOMA-IR score of 1.67 as the cut-off (≤1.67 for LIR group). Additionally, participants with an average BMI of ≥25 kg/m3 were categorized as overweight and all others as normal. Participants in the pre-diabetes, HIR, and overweight subgroups had higher levels of BMI, FBG, FINS, HOMA-IR, and leptin, were older, and were more likely to use medications (detailed information of medication usage shown in online supplemental table S1). The adiponectin level was lower and the resistin level was higher in participants with higher HOMA-IR scores. The sex distribution was similar among the subgroups; men accounted for ~40% of the participants.
Descriptive results for demographic and clinical characteristics of participants
Among the 102 participants, 62 (60.8%) resided within 5 km from the fixed monitoring station, and 8 (7.8%) lived more than 10 km away, and the rest (n=32) were in between. Table 2 summarizes the MA levels of ambient PM and meteorological parameters of 1 and 14 days. The 1-day MA concentration of PM2.5, UFP, and AMP was 65.5±58.6 µg/m3, 15.5±4.4×10³/cm3, and 11.7±3.8×10³/cm3, respectively. The correlation of PM2.5 with UFP and AMP concentrations was weak, where the UFP and AMP concentrations were highly positively correlated (Spearman coefficient was 0.85 and 0.78 for MA concentration of 1 and 14 days, respectively; p<0.05) (shown in online supplemental table S2).
MA levels (1 and 14 days) of ambient particulate matter and meteorological parameters
Results of the linear mixed-effects model
The results of linear mixed-effects model for all participants are shown in figure 1 and online supplemental table S3. The number concentrations of UFP and AMP were negatively associated with the levels of adiponectin, leptin, and resistin in multiple exposure time windows. Specifically, an IQR increment in 1-day MA exposure to UFP (6.0×10³/cm3) was associated with significant decreases in the adiponectin and resistin levels of −14.0% (95% CI −20.9% to −6.4%) and −8.5% (95% CI −14.5% to −2.2%), respectively. Similarly, an IQR increase in 1-day MA exposure to AMP (4.5×10³/cm3) was associated with decreases in the adiponectin and resistin levels of −9.7% (95% CI −16.3% to −2.6%) and −5.6% (95% CI −11.1% to 0.2%), respectively. The leptin level changed maximally by −11.2% (95% CI −18.9% to −2.7%) and −9.2% (95% CI −16.6% to −1.1%) after 11-day MA UFP exposure and 10-day MA AMP exposure, respectively. Exposure to ambient PM2.5 was not significantly associated with the levels of the three adipokines. In sensitivity analyses, the findings remained after excluding the 40 participants who lived more than 5 km away from the monitoring station or those who completed less than three (n=5), four (n=12) or five (n=25) visits (shown in online supplemental figure S1–S4).
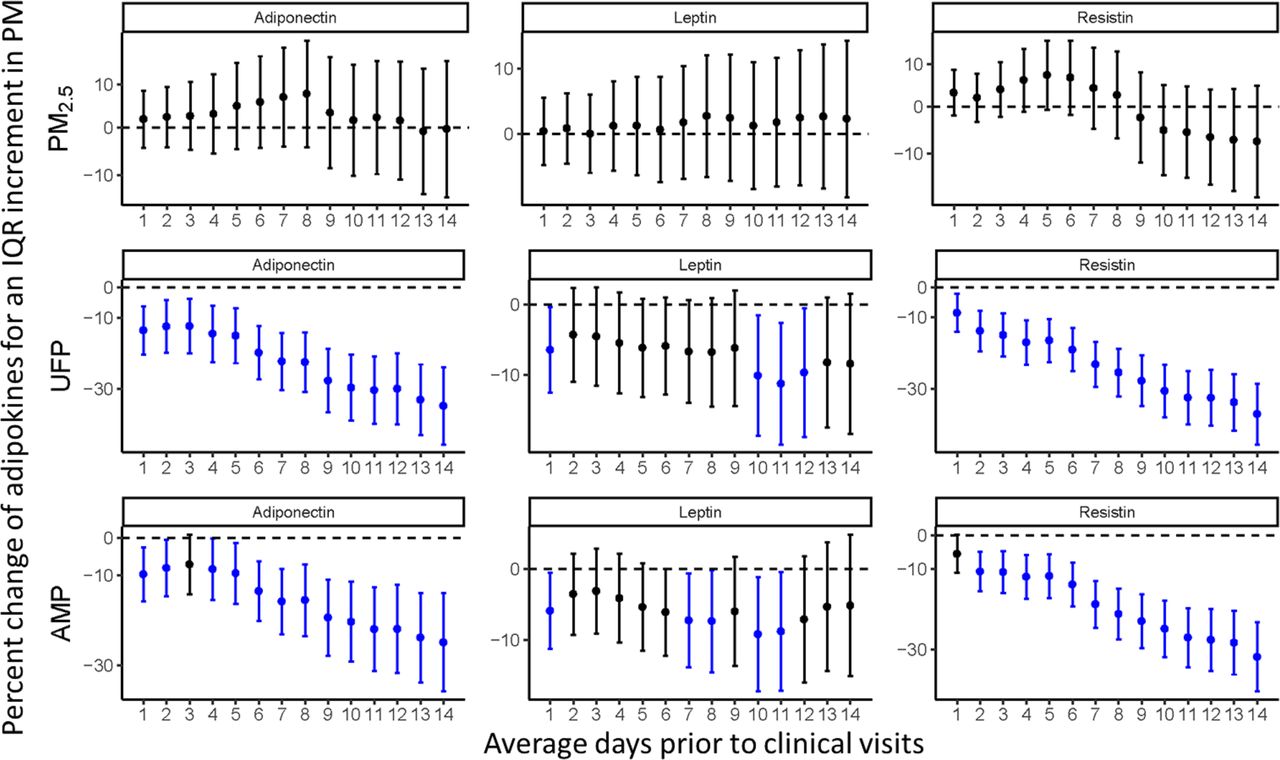
Associations between short-term exposure to ambient PM and adipokines in all participants. All models were adjusted for temperature, relative humidity, sex, age, body mass index, fasting blood glucose, homeostasis model assessment of insulin resistance, medication usage, season, and day of the week. The blue error bars indicate significant negative associations, and the black bars indicate non-significant associations. AMP, accumulation-mode particle; PM, particulate matter; PM2.5, fine particulate matter; UFP, ultrafine particle.
Figure 2 shows the ambient PM-associated changes in adipokine levels stratified by the average HOMA-IR. The decrease in adiponectin level associated with each IQR increment in UFP and AMP concentrations was higher in the HIR group than in the LIR group. For example, in the HIR group, an IQR increase in the 14-day MA exposure to UFP was associated with a change of −37.9% (95% CI −46.5% to −28.0%) in the adiponectin level, which was significantly lower than that for the LIR group (−30.1%, 95% CI −39.6% to −19.1%). Also, the decrease in the leptin level was greater in the LIR group than in the HIR group. The association between the leptin level and MA exposure to UFP and AMP of 1–14 days was not significant in the HIR group. The association between the resistin level and PM exposure was not modified by the level of insulin resistance. Additionally, the decrease in adiponectin level associated with exposure to UFP and AMP was greater in overweight than normal-weight participants, although the differences were non-significant (shown in online supplemental figure S5). The associations between exposure to PM and adipokine levels were not modified by the average FBG level (shown in online supplemental figure S6).

Associations between short-term exposure to ambient PM and adipokines modified by insulin resistance. All models were adjusted for temperature, relative humidity, sex, age, body mass index, fasting blood glucose, HOMA-IR, medication usage, season, and day of the week. Participants were classified as HIR/LIR subgroups using average HOMA-IR=1.67 as the cut-off. The blue error bars indicate significant negative associations, and the black bars indicate non-significant associations. Gray background denotes significant (p value<0.05) differences between subgroups. AMP, accumulation-mode particle; HIR, high insulin resistance; HOMA-IR, homeostasis model assessment of insulin resistance; LIR, low insulin resistance; PM, particulate matter; PM2.5, fine particulate matter; UFP, ultrafine particle.
Discussion
We determined the associations between short-term exposure to ambient PM of a variety of size fractions and the levels of adipokines in healthy individuals and individuals with pre-diabetes and examined whether these associations were modified by diabetic state, insulin resistance, and obesity. We were the first to find that exposure to small-sized particles, namely, UFP and AMP, was associated with decreased levels of adiponectin, leptin, and resistin. Exposure to PM2.5 was not associated with significant changes in adipokine levels. Also, the decrease in adiponectin levels associated with UFP and AMP exposure was of greater magnitude in participants with a high level of insulin resistance, whereas the decrease in leptin levels associated with UFP and AMP exposure was greater in participants with low insulin resistance levels.
Consistent with our findings, a panel study conducted in Beijing under extreme air pollution conditions found no significant association between short-term exposure to ambient PM2.5 and adiponectin and leptin levels in non-smoking adults with metabolic syndrome and insulin resistance.11 However, the Heinz-Nixdorf Recall cohort study reported negative associations8 and the Framingham Heart Study reported positive associations9 between short-term PM2.5 exposure and adiponectin levels. This may be due in part to differences in air pollution parameters and the demographic characteristics of the participants. For example, the mean 1-day PM2.5 concentration in the current study was 65.5 µg/m3, more than threefold higher than that in previous studies (17.8 µg/m38 and 9.7 µg/m3,9 respectively). The inclusion of current smokers in previous studies8 9 might have biased the exposure assessment, particularly when examining the acute effects. Further studies are needed to reach a conclusion on this issue.
Compared with PM2.5, exposure to UFP and AMP was associated with greater and significant changes in adipokine levels. This is in line with reports that smaller-size fraction particles have higher lung deposition efficiency and a larger surface area for absorption of toxic compounds.18–20 To our knowledge, no other study has investigated the association of UFP exposure with adipokine levels. The prospective population-based Heinz-Nixdorf Recall cohort study, conducted in the highly urbanized Ruhr area of Germany, reported negative associations between AMP exposure and adiponectin levels among 4052 non-diabetic elderly participants,8 in agreement with our findings. Additionally, this study observed that the magnitude of PM-induced changes in adiponectin increased in an exposure time-dependent manner in the range of 1–91 days,8 which is similar to our results, even though the potential mechanisms remain unclear. More studies are needed to verify our results and to investigate the effects of particles of other size fractions.
Adiponectin is an anti-inflammatory and insulin-sensitizing hormone.7 Animal and human studies have reported that reductions in adiponectin levels play a central role in obesity-associated diseases, including insulin resistance and type 2 diabetes. Restoration of adiponectin secretion by adipose tissue is a therapeutic approach for these diseases.31 Exposure to ambient PM was associated with the incidence and prevalence of insulin resistance and diabetes.4–6 Also, short-term exposure to PM was associated with elevations in glucose and insulin levels and HOMA-IR scores.11 15 25 Therefore, our finding of inverse associations between short-term exposure to UFP and AMP and adiponectin levels supports the hypothesis that some fractions of PM adversely impact metabolic health. This finding also sheds light on the mechanisms linking PM exposure with the onset and development of diabetes.
Leptin mainly acts in the brain (eg, hypothalamus, cortex, and limbic areas) to promote growth, energy expenditure, glycemic control, and reproduction. Leptin also suppresses appetite and the production of adrenal corticosteroids.32 Insulin stimulates both leptin biosynthesis and secretion from adipose tissue, and leptin, in turn, inhibits insulin secretion to form an endocrine adipoinsular feedback loop, the so-called adipoinsular axis.33 Toxicological evidence shows that decreased leptin results in disruption of glucose homeostasis34; therefore, our finding of inverse associations between short-term exposure to UFP and AMP and leptin levels may help to explain the imbalance of glucose metabolism after PM exposure.11 15 25 The only two studies of the associations between short-term PM exposure and changes in leptin levels, namely, the Framingham Heart Study9 and the panel study conducted by Brook et al in Beijing,11 reported non-significant results. In humans, resistin is mainly secreted by peripheral blood mononuclear cells. Resistin promotes insulin resistance and inflammation in animal models, but its effects in humans are unclear.7 The sole human study of the effects of PM exposure on resistin found that resistin was negatively associated with long-term PM2.5 exposure and positively associated with short-term SO42− exposure.9 In contrast, we also observed negative associations between the changes in resistin and short-term exposure to UFP and AMP. The result is hard to explain with the existing findings on its physiological mechanisms in the glucose metabolism. Because the data on PM-induced changes in leptin and resistin levels are insufficient, further research on different air pollution settings and on a variety of demographic groups is needed. Also, more evidence on the potential mechanisms of adipokines in the glucose metabolism might be helpful to understand the unexplained results.
Several other studies have also suggested that metabolic disorders increase the adverse effect of ambient PM exposure on adipokine levels.13 35 One toxicological study reported that in high-fructose diet-fed rats, expression of the adiponectin gene was downregulated and that of the leptin gene was upregulated after exposure to concentrated air particles, whereas only mild or no changes were observed in normal diet-fed rats.35 The sole human study by Wolf et al showed enhanced susceptibility of pre-diabetes to PM-induced changes in the leptin level,13 although they observed an elevation in leptin; this is unlike our findings and other toxicological evidence.34 The discrepancy might be because Wolf et al’s study was based on long-term exposure, whereas we focused on exposure over 1–14 days. Further studies should examine the susceptibility to particle-induced changes in adipokine levels among individuals with metabolic disorders.
Because adipokines play important roles in glucose metabolism, our findings help to understand the greater changes in glucose metabolism after exposure to air pollution among individuals with metabolic disorders25 36 and those who are overweight or obese.37 38 For example, in a population-based retrospective cohort study, IQR increases in 3-month average PM10 and PM2.5 concentrations were associated with greater elevations in serum glucose and glycosylated hemoglobin levels among participants with diabetes compared with those without.36 Chen et al reported that each 1% increase in body fat percentage resulted in an 8% increase in the negative association between PM2.5 and insulin sensitivity, suggesting that PM2.5 exerted a greater effect on individuals stressed by increased body fat levels.38 Although the mechanisms underlying the modification of insulin resistance and obesity on particle-associated effects are unclear, systemic inflammation and metabolic dysfunction have emerged as candidates. Inflammatory and metabolic processes are involved in the pathogenesis of both insulin resistance and obesity,39 as well as in the impact of air pollution on health.40 In another word, the adverse effect of PM exposure among individuals with higher insulin resistance and higher BMI levels might be strengthened through a shared pathway to exert a marked effect on the levels of adipokines and other metabolic biomarkers. However, these responses were not affected by FBG level, possibly because the level of glucose can fluctuate drastically due to several factors, such as exercise.41 The effects of PM might be confounded by such factors. Also, the leptin response was unexpectedly weaker among participants with higher insulin resistance. Because evidence on this is scarce, future studies of susceptibility are needed to corroborate our findings and to identify the underlying mechanisms.
This study, for the first time, reported that short-term exposure to UFP and AMP, but not PM2.5, was associated with decreased serum levels of adiponectin, leptin, and resistin. The adverse metabolic effects on adipokines were enhanced in the participants with higher insulin resistance levels. This represents an important public health concern because a large number of people suffer from metabolic disorders, and exposure to severe air pollution could increase their risk of detrimental health effects. This study has several limitations. First, exposure to ambient PM was measured at a fixed monitoring site, possibly leading to inaccurate estimation of exposure. Although more than 90% of the participants lived within 10 km of the monitoring station and the ambient concentrations could, to some extent, reflect their exposure trend, we should be cautious about exposure error, especially for smaller particles. Personal monitors for UFP and AMP should be used in future studies. Second, as we did not consider gaseous pollutant exposure in the linear mix-effects model, the potential confounding effects of gaseous pollutants could not be excluded. Third, the participants were relatively highly educated and of high socioeconomic status, so caution is needed when generalizing our findings to other demographic groups.
In conclusion, based on a panel study conducted among both pre-diabetic participants and healthy individuals, we found that decreased serum levels of adiponectin, leptin, and resistin were associated with short-term exposure to UFP and AMP, whereas exposure to PM2.5 was not associated with changes in adipokine levels. Additionally, insulin resistance might aggravate the adverse metabolic impact of PM.
Acknowledgments
We are greatly thankful to all the members in our research group and Peking University Hospital who helped to accomplish the study.
References
Supplementary materials
Supplementary Data
This web only file has been produced by the BMJ Publishing Group from an electronic file supplied by the author(s) and has not been edited for content.
Footnotes
WC and YH contributed equally.
Contributors WC participated in health measurement of the Study Comparing the Cardiometabolic and Respiratory Effects of Air Pollution Exposure on Healthy and Pre-diabetic Individuals (SCOPE), performed the data analysis and drafted the manuscript. YH participated in study design, exposure assessment, health measurement, and manuscript preparation. YW and XC participated in exposure assessment and health measurement. XQ participated in study design. WL offered help at the clinical site. YY participated in health measurement. TZ designed and organized the SCOPE study, discussed the data analysis, and revised the manuscript. All authors read and approved the final manuscript.
Funding This study was supported by the National Natural Science Foundation Committee of China (Grants 21190051, 41421064, and 41121004), and the Ministry of Science and Technology of China (Grant 2015CB553401).
Competing interests None declared.
Patient consent for publication Not required.
Ethics approval The Study Comparing the Cardiometabolic and Respiratory Effects of Air Pollution Exposure on Healthy and Pre-diabetic Individuals study was approved by the ethics committee of Peking University Health Sciences Center (IRB00001052-13024).
Provenance and peer review Not commissioned; externally peer reviewed.
Data availability statement Data are available upon reasonable request.
Supplemental material This content has been supplied by the author(s). It has not been vetted by BMJ Publishing Group Limited (BMJ) and may not have been peer-reviewed. Any opinions or recommendations discussed are solely those of the author(s) and are not endorsed by BMJ. BMJ disclaims all liability and responsibility arising from any reliance placed on the content. Where the content includes any translated material, BMJ does not warrant the accuracy and reliability of the translations (including but not limited to local regulations, clinical guidelines, terminology, drug names and drug dosages), and is not responsible for any error and/or omissions arising from translation and adaptation or otherwise.