Article Text

Abstract
Introduction Pre-diabetes, a status conferring high risk of overt diabetes, is defined differently by the American Diabetes Association (ADA) and the WHO. We investigated the impact of applying definitions of pre-diabetes on lifetime risk of diabetes in women and men from the general population.
Research design and methods We used data from 8844 women without diabetes and men aged ≥45 years from the prospective population-based Rotterdam Study in the Netherlands. In both gender groups, we calculated pre-diabetes prevalence according to ADA and WHO criteria and estimated the 10-year and lifetime risk to progress to overt diabetes with adjustment for competing risk of death.
Results Out of 8844 individuals, pre-diabetes was identified in 3492 individuals (prevalence 40%, 95% CI 38% to 41%) according to ADA and 1382 individuals (prevalence 16%, 95% CI 15% to 16%) according to WHO criteria. In both women and men and each age category, ADA prevalence estimates doubled WHO-defined pre-diabetes. For women and men aged 45 years having ADA-defined pre-diabetes, the 10-year risk of diabetes was 14.2% (95% CI 6.0% to 22.5%) and 9.2% (95% CI 3.4% to 15.0%) compared with 23.2% (95% CI 6.8% to 39.6%) and 24.6% (95% CI 8.4% to 40.8%) in women and men with WHO-defined pre-diabetes. At age 45 years, the remaining lifetime risk to progress to overt diabetes was 57.5% (95% CI 51.8% to 63.2%) vs 80.2% (95% CI 74.1% to 86.3%) in women and 46.1% (95% CI 40.8% to 51.4%) vs 68.4% (95% CI 58.3% to 78.5%) in men with pre-diabetes according to ADA and WHO definitions, respectively.
Conclusion Prevalence of pre-diabetes differed considerably in both women and men when applying ADA and WHO pre-diabetes definitions. Women with pre-diabetes had higher lifetime risk to progress to diabetes. The lifetime risk of diabetes was lower in women and men with ADA-defined pre-diabetes as compared with WHO. Improvement of pre-diabetes definition considering appropriate sex-specific and age-specific glycemic thresholds may lead to better identification of individuals at high risk of diabetes.
- diabetes mellitus
- type 2
- pre-diabetic state
- risk assessment
- diagnosis
This is an open access article distributed in accordance with the Creative Commons Attribution Non Commercial (CC BY-NC 4.0) license, which permits others to distribute, remix, adapt, build upon this work non-commercially, and license their derivative works on different terms, provided the original work is properly cited, appropriate credit is given, any changes made indicated, and the use is non-commercial. See: http://creativecommons.org/licenses/by-nc/4.0/.
Statistics from Altmetric.com
Significance of this study
What is already known about this subject?
Pre-diabetes is a highly prevalent condition and increases the risk for women and men to develop diabetes.
Data on the impact of applying different definitions of pre-diabetes in women and men and lifetime risk to eventually progress to diabetes are scarce.
What are the new findings?
Women with pre-diabetes have significantly higher lifetime risk to progress to diabetes than men.
The American Diabetes Association (ADA) criteria diagnose up to half the women and men as pre-diabetes, more than twice the prevalence of WHO-defined pre-diabetes. Furthermore, the lifetime risk to progress to diabetes is substantially lower in women and men with ADA-defined pre-diabetes as compared with the WHO-defined pre-diabetes.
How might these results change the focus of research or clinical practice?
Our findings indicate the need for setting appropriate population-wide sex-specific and age-specific glycemic thresholds for pre-diabetes.
Introduction
The worldwide prevalence of diabetes varies between 8.8% and 14.2% and is expected to increase in coming years.1–3 Although gender differences exist in the prevalence of obesity and diabetes,1 4 lifestyle and pharmacological interventions are the cornerstone to deflect the global rise in diabetes prevalence among both women and men.5–8 Pre-diabetes, a condition with elevated blood glucose levels below the threshold of diabetes, places women and men at high risk of diabetes.9–11 The American Diabetes Association (ADA) and the WHO are the authorities that publish the major clinical guidelines for pre-diabetes definition.12 13 The main difference in the definition of pre-diabetes between the ADA and WHO is difference in the threshold of the glycemic index. For fasting glucose, the threshold according to the ADA guideline is 5.6 mmol/L, whereas the WHO defines a threshold of 6.0 mmol/L. To be clinically useful in prevention, pre-diabetes definition should accurately identify future cases of diabetes. Recent evidence points towards gender differences in epidemiology of both diabetes and obesity, possibly resulting from biological and lifestyle factors but also from disparities in treatment and prevention.1 4 14 For example, more men are overweight at a younger age and women develop diabetes at a higher body mass index (BMI) then men. Gender differences also exist in the development of diabetes-associated complications, such as coronary heart disease and stroke.15 16 These findings highlight the importance of a sex-specific approach in the assessment of high-risk individuals for diabetes. In preventive settings, long-term absolute risks are preferable by clinicians and patients over relative risks for risk communication and estimation.17–19 Lifetime risks provide straightforward messages to patients and clinicians on cumulative risks of developing certain diseases during a life span.11 20 Data on the lifetime risk of developing diabetes in women and men for different definitions of pre-diabetes have been lacking or are limited to absolute risks within a limited time period.21
Hence, our aim was to study the impact of applying ADA and WHO pre-diabetes definitions on women and men from a community-dwelling population and to assess their prediction of lifetime risk to progress to diabetes. We first studied the proportion that meets the diagnosis of pre-diabetes according to the ADA and WHO criteria. Second, we examined the remaining 10-year and lifetime risk for women and men to progress to overt diabetes across different age groups according to both criteria. We then compared the lifetime risk of developing diabetes between WHO-diagnosed and ADA-diagnosed pre-diabetes status in both women and men.
Research design and methods
Study population
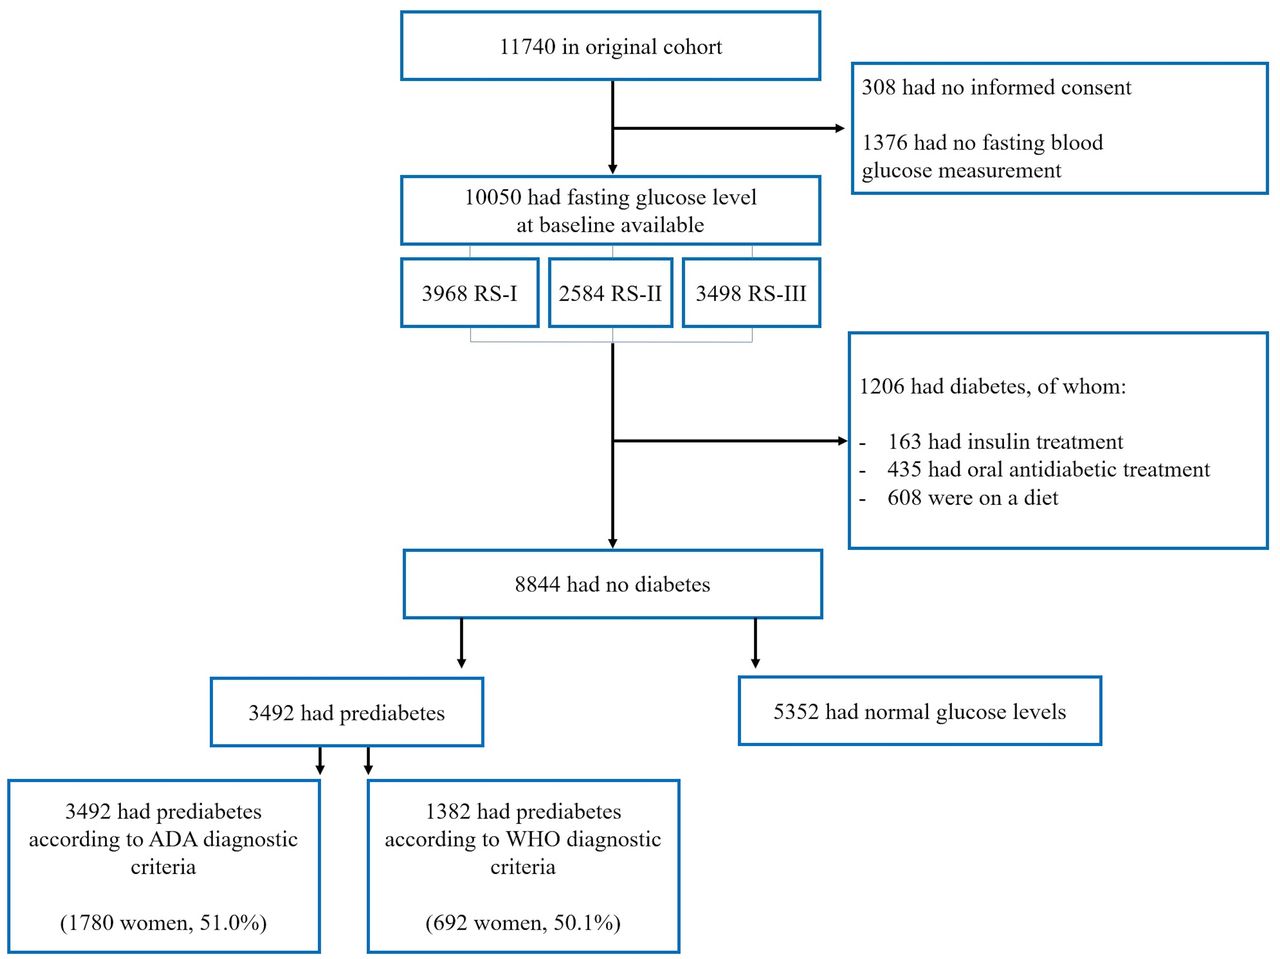
We used data from the Rotterdam Study, a prospective community-dwelling study in a district of Rotterdam, the Netherlands. The Rotterdam Study has been described in detail elsewhere.22 In 1990, 7983 individuals aged 55 years and older were included in the first cohort of the Rotterdam Study. In 2000, the study was extended with a second cohort of 3011 individuals who had reached the age of 55 years or had moved into the research area since the beginning of the first cohort. Further, in 2006, a third cohort was started, including 3932 individuals of 45 years and older. For the current analyses, we used data from the third center visit of the first cohort (1997–1999) and the first center visit of the second and third cohorts as baseline. We excluded 1376 participants without available fasting glucose measurement and 314 from whom informed consent was not obtained. Then we excluded 1206 participants with diabetes. This led to inclusion of 8844 individuals 45 years and older who were free from diabetes at baseline for this study (flowchart in figure 1). We included individuals with pre-diabetes (n=3492) to calculate the lifetime risk of diabetes.

Flowchart of the selection of study participants. ADA, American Diabetes Association.
Assesment of glycemic status at baseline and follow-up
All participants were subject to an overnight fasting period after which blood was drawn at the research facility. All biochemical variables, including glucose, were assessed using fasting serum. Glucose and other biochemical variables were measured using a COBAS 8000 Modular Analyzer (Roche Diagnostics). The corresponding interassay coefficient of variation of glucose was <1.4%. Individuals were categorized at baseline according to glycemic state using the WHO and ADA guidelines. For the WHO, individuals with fasting blood glucose levels of 6.0 mmol/L or lower were included in the group of normoglycemic individuals. Individuals with fasting glucose levels of >6.0 and <7.0 mmol/L were diagnosed with pre-diabetes. For the categorization of individuals according to the ADA guidelines, a fasting glucose of ≥5.6 and <7.0 mmol/L were categorized as pre-diabetes. Individuals in the normoglycemic and pre-diabetes group did not use any antidiabetic medication. From baseline assessment throughout follow-up, individuals were analyzed according to their category of pre-diabetes at baseline (WHO or ADA). Incident type 2 diabetes was diagnosed based on data from general practitioners, hospital discharge letters, regular research center visits and pharmacy records as a fasting blood glucose level of ≥7.0 and non-fasting glucose levels of ≥11.0 (when fasting samples were unavailable) and/or the use of blood glucose-lowering medication. Pharmacy data covered more than 95% of the cohort study population.23 Each incident event of type 2 diabetes mellitus was coded by two independent medical doctors. In case of disagreement, consensus was sought in a meeting with an endocrinologist. Follow-up data were completed until 1 January 2012. Completeness of follow-up until 1 January 2012 was 99.3%.
Assessment of all-cause mortality
Follow-up on vital status of the Rotterdam Study participants was obtained from the medical records of general practitioners and municipal records and were completed until 1 January 2012.
Statistical analysis
Baseline characteristics were compared between women and men using an independent sample t-test and χ² for variables with a normal distribution. Comparisons between groups for continuous variables that were not normally distributed were performed with Mann-Whitney U tests. Prevalence of pre-diabetes according to the ADA and WHO diagnostic criteria was calculated for five age categories, in women and men separately: 45–55, 55–65, 65–75, 75–85, and 85 years and older. In these age categories, an age of exactly 55 years fell into age category 55–65 years, and every age below 55 years until age 45 years fell into age category 45–55 years, and so on. CIs for the prevalence were calculated using the prop.test function in the ‘stats’ library in R. Ten-year and lifetime risk estimates for the progression to diabetes were calculated for individuals with pre-diabetes according to WHO and ADA diagnostic criteria at the index ages 45, 55, 65, 75, and 85 years. For these calculations, a modified version of survival analysis according to Kaplan-Meier was used. In this modified version, death free from diabetes is a separate event. For each age during follow-up, we calculated the incidence of disease and death free from diabetes.
Survival probabilities, age-specific HRs, cumulative incidences and incidence rates are calculated in a way similar to that of Kaplan-Meier. In the lifetime risk calculation, the competing risk of death is taken into account in order to not overestimate the lifetime risk of diabetes when the competing risk is high (more detailed description in online supplemental file 1).The lifetime risk estimates reflect the risk at the index age to the age of last observation (107 years in our study). The missing value rate for covariates was less than 5% and was therefore considered to be inconsequential. For the analysis of all data, IBM SPSS Statistics V.21.0.0.1 and R V.2.1 with the ‘etm’ and ‘survival’ libraries were used.
Supplemental material
Results
Baseline characteristics of the population
The baseline characteristics of the study population are summarized in table 1. In a population of 8844 individuals without diabetes, 3492 had pre-diabetes (prevalence 40%, 95% CI 38% to 41%) according to the ADA criteria, of whom 1780 were women (51%), while 1382 individuals (prevalence 16%, 95% CI 15% to 16%) had pre-diabetes according to the WHO criteria, of whom 692 were women (50.1%). Women with pre-diabetes were older and had higher BMI and higher insulin levels compared with men.
Baseline characteristics of participants by gender and prevalent pre-diabetes
Prevalence of pre-diabetes at different ages
As displayed in table 2, prevalence estimates of ADA pre-diabetes were more than twice the prevalence of WHO pre-diabetes in each age category in both women and men. Furthermore, prevalence of pre-diabetes was higher in men compared with women in each age category. The difference in prevalence of pre-diabetes between women and men was largest at younger age groups, and this gender gap narrowed with advancing age.
Prevalence of pre-diabetes according to the ADA and WHO diagnostic criteria in different age categories in women and men.
10-year risk of diabetes for ADA and WHO pre-diabetes diagnosis
For women and men aged 45 years with pre-diabetes based on the ADA criteria, the 10-year risk of diabetes was 14.2% (95% CI 6.0% to 22.5%) and 9.2% (95% CI 3.4% to 15.0%) (p value for gender difference 0.16) compared with 23.2% (95% CI 6.8% to 39.6%) and 24.6% (95% CI 8.4% to 40.8%) in women and men with WHO-defined pre-diabetes (p value for gender difference 0.45) (table 3). The 10-year risk of diabetes increased up to the age of 75 years, after which it decreased. Other than in age category 55–65 and 75–85 years, there were no statistically significant gender differences in 10-year risks for diabetes in ADA and WHO pre-diabetes.
Remaining lifetime risks and 10-year risk of diabetes in women and men with pre-diabetes according to the ADA and WHO criteria, for different index ages
Lifetime risk for diabetes for ADA and WHO pre-diabetes diagnosis
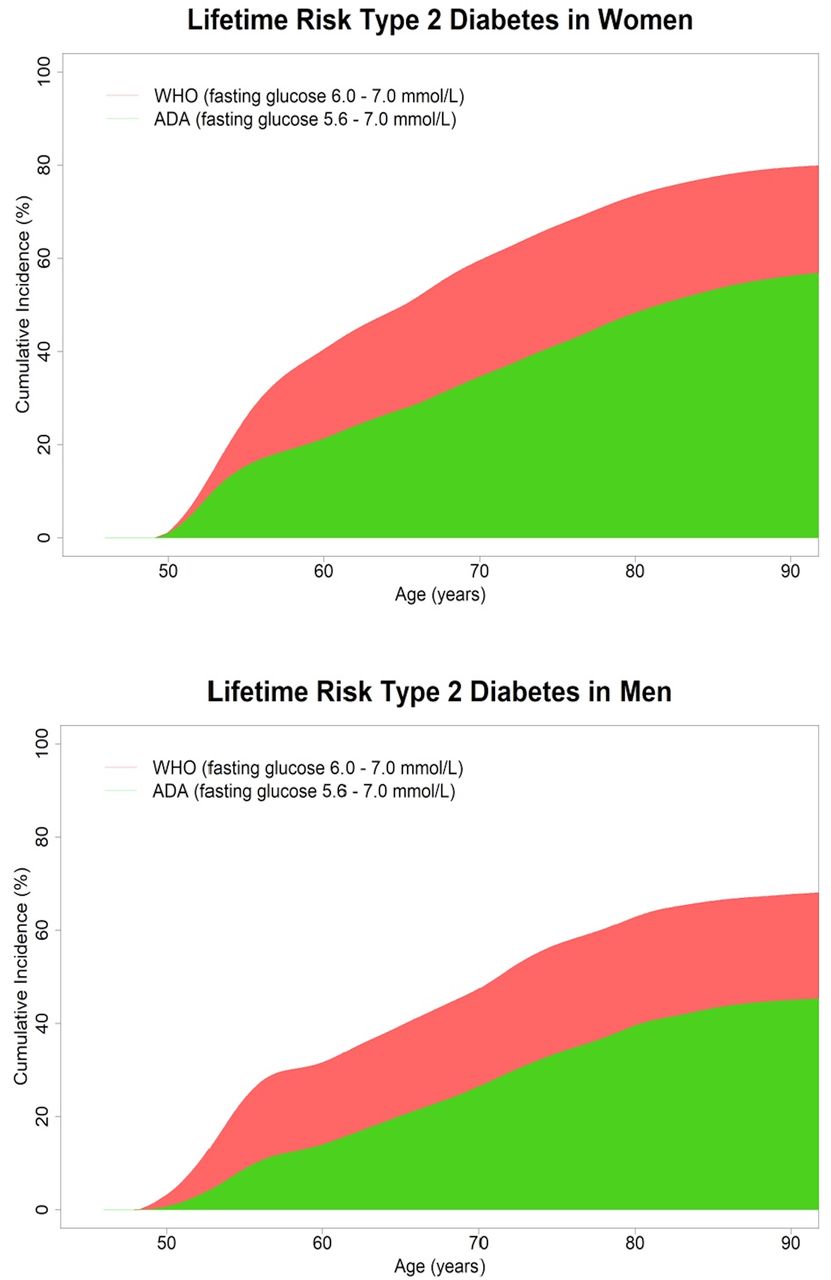
During a total of 27 679 person-years of follow-up, 632 individuals that had pre-diabetes according to ADA criteria at baseline developed diabetes and 709 died (diabetes incidence rate per 1000 person-years: 22.8, 95% CI 21.1 to 24.7; mortality rate per 1000 person-years 25.6, 95% CI 23.8 to 7.6; median follow-up time 8.1 years with a maximum follow-up time of 14.7 years). In individuals who were diagnosed with pre-diabetes according to WHO criteria, 425 developed diabetes and 257 died during 9884 person-years of follow-up (diabetes incidence rate per 1000 person-years: 43.0, 95% CI 39.0 to 47.3; mortality rate per 1000 person-years: 26.0, 95% CI 22.9 to 29.41; median follow-up time 5.7 years with a maximum follow-up time of 14.7 years). In table 3, the remaining lifetime risks of diabetes for women and men with pre-diabetes according to ADA and WHO diagnostic criteria are summarized. At age 45 years, the remaining lifetime risk to progress to overt diabetes among individuals with ADA-defined pre-diabetes was 57.5% (95% CI 51.8% to 63.2%) for women and 46.1% (95% CI 40.8% to 51.4%) for men. The lifetime and 10-year risk for individuals with normoglycemia and glucose levels between 5.6 and 6.1 were lower (online supplemental table 1). The remaining lifetime risks attenuated with increasing index age. In figure 2, the cumulative incidence of type 2 diabetes is displayed for two categories of fasting glucose levels in individuals aged 45 years and adjusted for the competing risk of death.
Supplemental material

Lifetime risk of type 2 diabetes at 45 years of age, adjusted for the competing risk of death, in women and men. The functions represent the cumulative incidences of type 2 diabetes for individuals aged 45 who have fasting glucose values between 6.0 and 7.0 mmol/L (WHO, red) and between 5.6 and 7.0 mmol/L (ADA, green). ADA, American Diabetes Association.
Conclusion
In this population-based cohort study, we found that ADA criteria for pre-diabetes assigned up to half of women and men as pre-diabetes, more than twice the prevalence estimates of pre-diabetes generated by WHO criteria in both genders for each age category. Approximately half the individuals diagnosed with pre-diabetes according to ADA-definition and approximately two-thirds of WHO-defined pre-diabetes at age 45 years would eventually develop diabetes in their remaining life span. Furthermore, women with pre-diabetes at age 45 years had higher lifetime risk to progress to diabetes than men.
In this study, we are the first to compare lifetime diabetes risk estimates between women and men for ADA and WHO pre-diabetes criteria. The lifetime risk of women with pre-diabetes to progress to diabetes was higher than that of men with pre-diabetes in most age categories. This could be an effect of susceptibility as men are more likely to develop diabetes at a younger age and lower BMI compared with women,4 24 25 which indicates them being more vulnerable to the effects of obesity and ageing compared with their female counterparts.26 Therefore, more men than women could already have had diabetes before the start of follow-up, making women at risk of developing diabetes during the course of follow-up. We have previously provided evidence for this observation.11 Also, women had higher BMI at baseline, which is an established risk factor for type 2 diabetes. Pre-diabetes according to ADA criteria was highly prevalent in our study population, and pre-diabetes was more prevalent in men than in women. US data from 2011 to 2012 in the age category of 45–64 years show that pre-diabetes prevalence based on any of three glucose dysregulation criteria (glycated hemoglobin (HbA1c), fasting plasma glucose and 2-hour plasma glucose level) was 44.9%.27 Since their prevalence was based on three glycemic criteria, the slightly higher US prevalence could be comparable or lower compared with our prevalence estimate based on fasting plasma glucose solely. In our study, the prevalence of pre-diabetes was higher than that in a UK population (35.3% in 2011).28 However, the UK study diagnosis was less sensitive29 due to a sole HbA1c measurement and participants were younger. Similar to our study, pre-diabetes had trends of higher prevalence in men compared with women. As previously described, men may thus be more vulnerable to the metabolic effects of obesity.25 The gap in prevalence of pre-diabetes between men and women narrowed with ageing. This could be due to the fact that more men are overweight at younger ages and men are likely to develop diabetes type 2 at a younger age and at a lower BMI than women.4 24 Women tend to become more overweight than men and generally do after the age of 45 years.30 Another explanation could be that impaired fasting glucose (IFG) is more prevalent in men compared with women, in whom more often impaired glucose tolerance (IGT) is observed.31
We assessed pre-diabetes as a homogeneous entity using IFG, without analyzing IGT separately or combined (IFG–IGT). Of note, IFG and IGT have different pathophysiological underlying mechanisms Furthermore, IFG is more prevalent in men, whereas IGT is more likely to be identified in women.31 IFG and IGT overlap in 20%–30% of pre-diabetes,32 and the combination of IFG and IGT best predicts incident type 2 diabetes. Therefore, the lifetime risks of the pre-diabetes estimated in our study might be subject to a certain level of underestimation of true lifetime risk of diabetes. Nevertheless, we have a large prospective population-based study with long follow-up. Given the time-consuming nature of the IGT testing with potential loss-to-follow-up with poor reproducibility33 rendering missing data, we have chosen a straightforward approach with fasting glucose measurements. Other aspects of single glucose measurements are that, although we had complete data on fasting state of the participant and procedures were standardized, unforeseen preanalytical conditions could interfere with the single diagnostic glucose measurement. Furthermore, an extensive amount of information is lost through dichotomizing fasting glucose into a diseased or non-diseased state. This is, however, inevitable from a clinical diagnostic and therapeutic perspective.
ADA criteria yielded a higher prevalence of pre-diabetes in both genders. Furthermore, half of the individuals aged 45 years with pre-diabetes according to the ADA criteria would never progress to overt diabetes, although they would qualify for lifestyle or pharmacological intervention according to prevailing clinical practice guidelines. The WHO-defined prevalences of pre-diabetes were lower, and lifetime risks of diabetes were 1.5 times higher compared with ADA criteria. The lower cut-off values for the ADA are based on results from observations on progression to diabetes in Pima Indians and inhabitants of the island of Mauritius34 35 and were set to improve the prediction of diabetes risk.12 Altogether, our data show that the use of ADA criteria will increase the prevalence of pre-diabetes. Although there is a known benefit of intensive behavioral lifestyle interventions on weight loss and diabetes prevention in subjects with diabetes and pre-diabetes7 36), the relative cost-effectiveness of these interventions in those with pre-diabetes as diagnosed by ADA versus WHO is unknown. Since a greater number of individuals at lower lifetime risk of disease progression may represent a financial strain to the healthcare system, further research is warranted to evaluate the cost-effectiveness of screening and treating according to both definitions. Importantly, since pre-diabetes confers a high risk of cardiovascular morbidity37 mainly explained by clustering of cardiometabolic factors associated with hyperglycemia,38 extensive lifestyle counseling and cardiovascular risk assessment should not be discarded. An individual with pre-diabetes would benefit from interventions triggered by screening for hypertension and dyslipidemia to reduce cardiovascular risk. Although it is certainly debatable, we emphasize the importance of lifestyle medicine in a wider perspective than screening and treating for pre-diabetes with low-glucose thresholds. Even though we have not studied cost-effectiveness in our analyses, a population-based approach that aims to change public health behavior through general education on diet and lifestyle instead of screen-and-treat strategies in high-risk individuals could be helpful in controlling the diabetes epidemic.33 39
Finally, the prevalence of pre-diabetes for both ADA and WHO criteria was high at older ages, whereas the lifetime risk of diabetes in the elderly with pre-diabetes was low due to the limited life expectancy in the higher age categories. The current study results implicate that at older age, pre-diabetes is less useful as a screening tool in order to determine which patients may benefit from interventions to prevent diabetes. An observation from a 12-year follow-up study of older adults with pre-diabetes in Sweden showed that the progression rate to diabetes was one-third of the progression rate at middle age, and common prevention goals promoted reversion to normoglycemia.40 Given the low progression rate to diabetes and the preventive treatment goals, such as weight management, physical activity and blood pressure, one could question whether a clinician needs a diagnosis of pre-diabetes in elderly to decide to implement preventive strategies. This is reflected by a qualitative interview study from the UK in which the majority of clinicians tended to adjust their management of pre-diabetes to the age and perceived risk/benefit to the patient.41 So for the use of pre-diabetes to identify high-risk individuals at older age, introduction of age-dependent criteria of pre-diabetes diagnosis may improve the efficacy to select individuals at increased risk of diabetes to justify lifestyle or pharmacological intervention.
The comprehensive assessment of the diagnosis of incident diabetes is a strength of our study, since it was done using blood glucose-lowering treatment (identified from medical records from general practitioners and hospitals), repeated study center visits with standardized blood glucose measurements and linkage with pharmacy dispensing records in the study area. Furthermore, we had data from a prospective, population-based study with long follow-up and adjusted lifetime risk for the competing risk of death in order to correct for overestimation.
There are limitations to our study. First, the study population was predominantly of European ancestry (>95%). Therefore, results may not apply to other ethnic groups. Second, the remaining lifetime risk at the age of 45 years was calculated because there were no data available for individuals younger than 45 years. Nevertheless, the cumulative incidence of type 2 diabetes before the age of 45 years is low.20 Third, we used data from a study that requires active participation through which there is always a certain level of healthy volunteer effect. This could lead to an underestimation of the absolute risk calculations at short-term follow-up. At long-term follow-up, however, this underestimation is probably limited.42
In conclusion, we showed that in men and women from a community-dwelling population, women with pre-diabetes had a significantly higher lifetime risk of diabetes than men. Furthermore, prevalence of pre-diabetes doubled when applying ADA compared with WHO criteria, and lifetime risk to progress to diabetes was substantially lower in women and men with ADA pre-diabetes as compared with the WHO pre-diabetes. Improvement of pre-diabetes definition would help better select individuals at high risk of diabetes. This could be done by setting appropriate population-wide and sex-specific and age-specific glycemic thresholds. Eventually, this would improve the appropriate application of both pharmacological and non-pharmacological preventive interventions.
Acknowledgments
The authors are grateful to the study participants, the staff from the Rotterdam Study, and the participating general practitioners and pharmacists. We thank Layal Chaker, Jolande Verkroost-van Heemst and Ke-Xin Wen for their invaluable contribution to the collection of the diabetes data.
References
Footnotes
Contributors TTWvH researched the data/wrote the manuscript. TTWvH, SL, MJGL and MK designed the analysis. All authors were involved in the acquisition, analysis or interpretation of results; reviewed/edited/critically revised the manuscript; and approved the final version of the manuscript to be published. The corresponding author states that all listed authors meet authorship criteria. MK is the guarantor of this study.
Funding This work was supported by the Erasmus Medical Center and Erasmus University, Rotterdam; the Netherlands Organization for the Health Research and Development (ZonMw); the Research Institute for Diseases in the Elderly (014-93-015, RIDE2); the Ministry of Education, Culture and Science; the Ministry for Health, Welfare and Sports; the European Commission (DG XII); the Municipality of Rotterdam; the Netherlands Organization of Scientific Research (NWO; 175.010.2005.011, 911-03-012); the Netherlands Genomics Initiative (NWO 050-060-810). MK is supported by the VENI grant (91616079) from the ZonMW.
Disclaimer The sponsors had no role in the design and conduct of the study; collection, management, analysis and interpretation of the data; and preparation, review or approval of this article.
Competing interests None declared.
Patient consent for publication Not required.
Ethics approval The Rotterdam Study has been approved by the medical ethics committee of the Erasmus MC (registration number MEC 02.1015) and by the Dutch Ministry of Health, Welfare and Sport (Population Screening Act WBO, license number 1071272–1 59 521 PG). The Rotterdam Study has been entered into the Netherlands National Trial Register (NTR, www.trialregister.nl) and into the WHO International Clinical Trials Registry Platform (www.who.int/ictrp/network/primary/en/) under shared catalog number NTR6831. All participants provided written informed consent to participate in the study and to have their information obtained from treating physicians. All data were non-identifiable and anonymized.
Provenance and peer review Not commissioned; externally peer reviewed.
Data availability statement Data are not publicly available. Data are however available from the authors upon reasonable request and with permission of the Rotterdam Study Management Team.
Supplemental material This content has been supplied by the author(s). It has not been vetted by BMJ Publishing Group Limited (BMJ) and may not have been peer-reviewed. Any opinions or recommendations discussed are solely those of the author(s) and are not endorsed by BMJ. BMJ disclaims all liability and responsibility arising from any reliance placed on the content. Where the content includes any translated material, BMJ does not warrant the accuracy and reliability of the translations (including but not limited to local regulations, clinical guidelines, terminology, drug names and drug dosages), and is not responsible for any error and/or omissions arising from translation and adaptation or otherwise.