Article Text

Abstract
Introduction To report the observations of point-of-care (POC) glycated hemoglobin (HbA1c) testing in people with non-diabetic hyperglycemia (NDH; HbA1c 42–47 mmol/mol (6.0%–6.4%)), applied in community settings, within the English National Health Service Diabetes Prevention Programme (NHS DPP).
Research design and methods A service evaluation assessing prospectively collected national service-level data from the NHS DPP, using data from the first referral received in June 2016–October 2018. Individuals were referred to the NHS DPP with a laboratory-measured HbA1c in the NDH range and had a repeat HbA1c measured at first attendance of the program using one of three POC devices: DCA Vantage, Afinion or A1C Now+. Differences between the referral and POC HbA1c and the SD of the POC HbA1c were calculated. The factors associated with the difference in HbA1c and the association between POC HbA1c result and subsequent attendance of the NHS DPP were also evaluated.
Results Data from 73 703 participants demonstrated a significant mean difference between the referral and POC HbA1c of −2.48 mmol/mol (−0.23%) (t=157, p<0.001) with significant differences in the mean difference between devices (F(2, 73 700)=738, p<0.001). The SD of POC HbA1c was 4.46 mmol/mol (0.41%) with significant differences in SDs between devices (F(2, 73 700)=1542, p<0.001). Participants who were older, from more deprived areas and from Asian, black and mixed ethnic groups were associated with smaller HbA1c differences. Normoglycemic POC HbA1c versus NDH POC HbA1c values were associated with lower subsequent attendance at behavioral interventions (58% vs 67%, p<0.001).
Conclusion POC HbA1c testing in community settings was associated with significantly lower HbA1c values when compared with laboratory-measured referrals. Acknowledging effects of regression to the mean, we found that these differences were also associated with POC method, location, individual patient factors and time between measurements. Compared with POC HbA1c values in the NDH range, normoglycemic POC HbA1c values were associated with lower subsequent intervention attendance.
- primary prevention
- diabetes mellitus, type 2
- point-of-care systems
This is an open access article distributed in accordance with the Creative Commons Attribution Non Commercial (CC BY-NC 4.0) license, which permits others to distribute, remix, adapt, build upon this work non-commercially, and license their derivative works on different terms, provided the original work is properly cited, appropriate credit is given, any changes made indicated, and the use is non-commercial. See: http://creativecommons.org/licenses/by-nc/4.0/.
Statistics from Altmetric.com
Significance of this study
What is already known about this subject?
Point-of-care (POC) glycated hemoglobin (HbA1c) devices are increasingly used in community settings and may vary in performance.
What are the new findings?
POC HbA1c measurements within the English National Health Service Diabetes Prevention Programme were significantly lower when compared with referral HbA1c measurements. These differences were associated with the POC assay, its location of use, individual patient factors (including deprivation status, age and ethnicity) and the time between measurements.
How might these results change the focus of research or clinical practice?
Practitioners using POC HbA1c devices to assess people with non-diabetic hyperglycemia should be aware of factors associated with differences in HbA1c values but crucially the impact of these values on interpretation and on subsequent attendance at behavioral interventions.
Introduction
In 2016, the Healthier You: National Health Service Diabetes Prevention Programme (NHS DPP) was developed to prevent or delay onset of type 2 diabetes in adults in England identified with non-diabetic hyperglycemia (NDH) (glycated hemoglobin (HbA1c) 42–47 mmol/mol (6.0%–6.4%) or fasting plasma glucose (FPG) 5.5–6.9 mmol/L).1 The NHS DPP delivers behavioral interventions based on guidance from the National Institute for Health and Care Excellence (NICE) via provider organizations who used serial point-of-care (POC) HbA1c testing to track responses to interventions.2
Routine internal monitoring of the program indicated a significant mean difference between laboratory-measured HbA1c values obtained on referral to the program (undertaken by referring general practices) and values obtained on first attendance of the program, where HbA1c was remeasured using a POC device.
Differences in an HbA1c level measured at two time points may reflect regression to the mean, a genuine biological change, or variation in the testing methodology used. The demographic, individual patient or assay-related factors that affect change in HbA1c outside of the diabetes range are not well-studied. This knowledge is vital, however, if serial measurements are used in people with NDH, which represents a narrow clinical range of interest, and where small changes in HbA1c have the potential to diagnose type 2 diabetes at one extreme or to declassify NDH status at the other.
Using data from the first 29 months of the NHS DPP, we aimed to
Determine if there were significant differences between laboratory-measured HbA1c and subsequent POC HbA1c measurements across all devices and testing pathways in the NHS DPP.
Identify modifiable and non-modifiable factors associated with observed differences between laboratory-measured HbA1c and POC measured HbA1c in the NHS DPP.
Assess the association between POC remeasurements of HbA1c and subsequent attendance of the NHS DPP.
The study does not attempt to assess the performance of POC devices in the measurement of HbA1c but rather to examine the implications of their use in a community setting as a follow-up to a laboratory HbA1c measurement.
Research designs and methods
Study design
This study is a service evaluation in England assessing prospectively collected national service-level data from the NHS DPP using data from the first referral received in June 2016 to October 2018.
Intervention
The NHS DPP delivers behavioral interventions encouraging weight loss in those overweight or obese, increased physical activity and healthier diets, through a minimum of 13 face-to-face group-based sessions, over at least 9 months, constituting at least 16 hours of contact time. Over this time period, interventions were delivered by one of four service providers selected as part of a national competitive procurement process: Reed Momenta Ltd (London, UK), ICS Health and Well-being (Leeds, UK), Ingeus UK Ltd (London, UK), and Living Well Taking Control LLP (Birmingham, UK).
Participants
Individuals with a test result indicating NDH within the previous 12 months, aged 18 years or over, not pregnant and not previously diagnosed with type 2 diabetes were identified from NHS Health Checks,3 general practice records or routine clinical practice. The majority of referrals included HbA1c results from laboratory testing, rather than FPG, although testing methodology was not stipulated. Individuals referred to the program were invited to attend an initial assessment (IA) during which further details of the program were provided, and participants were assigned to a group for intervention delivery.
Data collection
Program providers were contractually required to collect a minimum dataset; age, sex, postcode, the referral HbA1c/FPG and optionally, weight, were recorded on referral; ethnicity, weight and height at IA. Providers were contractually required to assess HbA1c at IA if the referral HbA1c or FPG was assessed more than 3 months previously. This service evaluation involved assessment of anonymized data collected during routine service delivery; NHS England has published an information governance framework setting out the legal basis for data collection and data flows, ensuring that the service and its evaluation are delivered in compliance with data protection legislation.4
Sex was recorded as male, female or indeterminate. Recorded ages were grouped (to align with both NHS health checks and retirement age) into <40, 40–64, 65–74 and 75+ years and self-reported ethnicity as white, Asian, black, mixed or other. Deprivation scores were obtained using lower super output area (derived from participant postcode) linked to the deprivation quintile from the Index of Multiple Deprivation. BMI was calculated for participants who had weight and height recorded at IA. All variables also include an unknown category where either the participant declined to give the relevant information or a value was not recorded.
POC devices
An expert working group was established to advise on internationally stipulated minimum performance criteria for HbA1c within the program and provided more specific guidance around use of POC devices,5 including calibration to the International Federation of Clinical Chemistry and Laboratory Medicine (IFCC) reference measurement procedure, and that Medicines and Healthcare products Regulatory Authority guidance around the provision of a quality framework, including internal quality control and external quality assessment (EQA) to support POC delivery, be followed.6 EQA, a process by which individual analytical devices can be compared with a reference or other devices, captures device bias and, with serial assessment, changes in analytical performance over time for any single device. Deviation in EQA performance can be investigated and resolved.
The four providers used HbA1c POC devices: DCA Vantage (Siemens Healthcare, Guildford, UK), Afinion (Abbott Diagnostics, Maidenhead, UK) or A1C Now+ (BHR Pharmaceutical, Nuneaton, UK). A ‘POC pathway’ was defined as the combination of the device used and the location where testing was performed, either a Lloyds pharmacy (subcontracting arrangements used by two providers) or ‘in-house’ (a community venue where a provider delivered the intervention). Pathways are listed in table 1. Providers used the same device and pathway for each participant. Though not contractually required, in some individuals, providers undertook POC HbA1c within 3 months of the referral HbA1c.
Provider pathways and devices used by the National Health Service (NHS) Diabetes Prevention Programme
Outcomes
The primary outcomes were the difference in HbA1c between laboratory-measured HbA1c and subsequent POC measured HbA1c and SD of POC measured HbA1c. The factors associated with the difference in HbA1c and the association between IA POC HbA1c and subsequent attendance were also evaluated.
The HbA1c difference between referral and IA and the SD of IA POC HbA1c was calculated for participants with a valid HbA1c recorded at both referral and IA. For a subgroup of participants with available data, the relationship between recorded HbA1c difference and weight change was examined. In those who had had sufficient time to attend, the relationship between IA POC HbA1c results and subsequent attendance at the group-based behavioral intervention sessions was studied by grouping individuals according to IA POC HbA1c values as normoglycemic (<42 mmol/mol), NDH (42.0–47.9 mmol/mol) and type 2 diabetes range (≥48 mmol/mol).
Statistical analysis
A paired t-test was used to test for differences between the mean referral and mean IA HbA1c, and a one-way analysis of variance was used to determine differences in the mean HbA1c change at IA. Where the null hypothesis for Bartlett’s test for equality of variances was rejected, Kruskal-Wallis equality of population rank test was also undertaken. Levene’s test was used to test equality of SDs between pathways.
Mixed-effects linear regression models were used to identify factors associated with differences in HbA1c. In model 1, pathway, referral HbA1c, time (days) between referral HbA1c and IA HbA1c, and participant characteristics (age, sex, ethnicity and deprivation) were considered as fixed effects, and local referral area was considered as a random effect with the contribution of the random effect quantified using the intraclass correlation coefficient (ICC). Local referral areas are only associated with a single provider and therefore incorporate the same facilities and facilitators used by that provider. Variation between the four providers was directly accounted for by a fixed effect in the model. Model 2 substituted pathway for device, with other variables remaining the same. Model 3 included weight change between referral and IA. A mixed-effects logistic regression model was used to identify factors associated with attendance of at least one intervention session following IA and was applied to the subgroup who had had at least 6 months to attend an intervention session. Pathway, participant characteristics (including BMI at IA) and POC HbA1c grouping at IA were considered as fixed factors and local referral area as a random effect. Only participants from the given subgroup for whom all data fields were complete were included in the regression analyses.
Sensitivity analyses were conducted on the regression models using multiple imputation, employing the multivariate chained equations approach to impute missing data and then comparing the results to the primary analyses.7 We used the fraction of missing information as a rule of thumb to estimate the number of imputations needed and imputed missing values for age, deprivation, sex, ethnicity and BMI. All participants had recorded data for pathway, local referral area, referral HbA1c and IA HbA1c.
Statistical significance was defined as a p value of <0.05. Where there were multiple comparisons, a post hoc Bonferroni correction was applied. CIs were set at 95%. All data were analyzed using STATA V.15.
Results
HbA1C at referral
Overall, 73 703 participants had an HbA1c measurement at both referral and IA. Characteristics of participants are provided in table 2; 44% of participants were male; the mean age was 64 (SD 12) years; and 20% were of black, Asian, mixed or other ethnicity; 65% were white; and 16% were unknown. There was broadly equal representation from all deprivation quintiles. The mean HbA1c at referral was 43.7 (SD 1.5) mmol/mol (6.1% (SD 0.14%)). Though statistically significant differences, there were no clinically meaningful differences in the mean referral HbA1c by pathway, ranging from 43.6 (SD 1.5) mmol/mol (6.1 (SD 0.14) %) to 43.8 (SD 1.5) mmol/mol (6.2 (SD 0.14) %). Data were missing for age (<0.01%), sex (0.6%), ethnicity (15.7%) and deprivation (0.4%). There were no missing data for referral HbA1c, IA HbA1c and pathway and device.
Mean HbA1c laboratory measurement at referral, POC remeasurement at IA, change in HbA1c between referral and IA and SD of IA HbA1c by device, pathway and participant characteristics
HbA1C at IA
The mean (SD) number of days between HbA1c measurements was 203 (120) days. The mean IA HbA1c was 41.2 (SD 4.46) mmol/mol (5.9 (SD 0.41) %), a significant difference of −2.48 mmol/mol (SD −0.23%) from the mean referral HbA1c (t=157, p<0.001). Significant differences were observed for all pathways and for all devices (table 2). Mean differences were significantly different between pathways (F(5, 73 697)=374; p<0.001) and between devices (F(2, 73 700)=738; p<0.001), with significant differences for 11 of the 15 pairwise combinations of pathways and all pairwise combinations of devices (online supplemental tables S1 and S2). There were significant differences in the SD of the HbA1c at IA between pathways (F(5, 73 697)=598.9; p<0.001) and devices (F(2, 73 700)=1541.8; p<0.001) (table 2). There were no significant differences in the SD between pathways using the same device. There were significant differences between the DCA Vantage and A1c Now+ devices (F(1, 62 133)=2186.6; p<0.001), Afinion and A1c Now+ devices F(1, 42 832)=1548.4; p<0.001) and Afinion and DCA Vantage devices F(1, 42 502)=68.0; p<0.001).
Supplemental material
Factors associated with the change in HbA1c from referral to IA
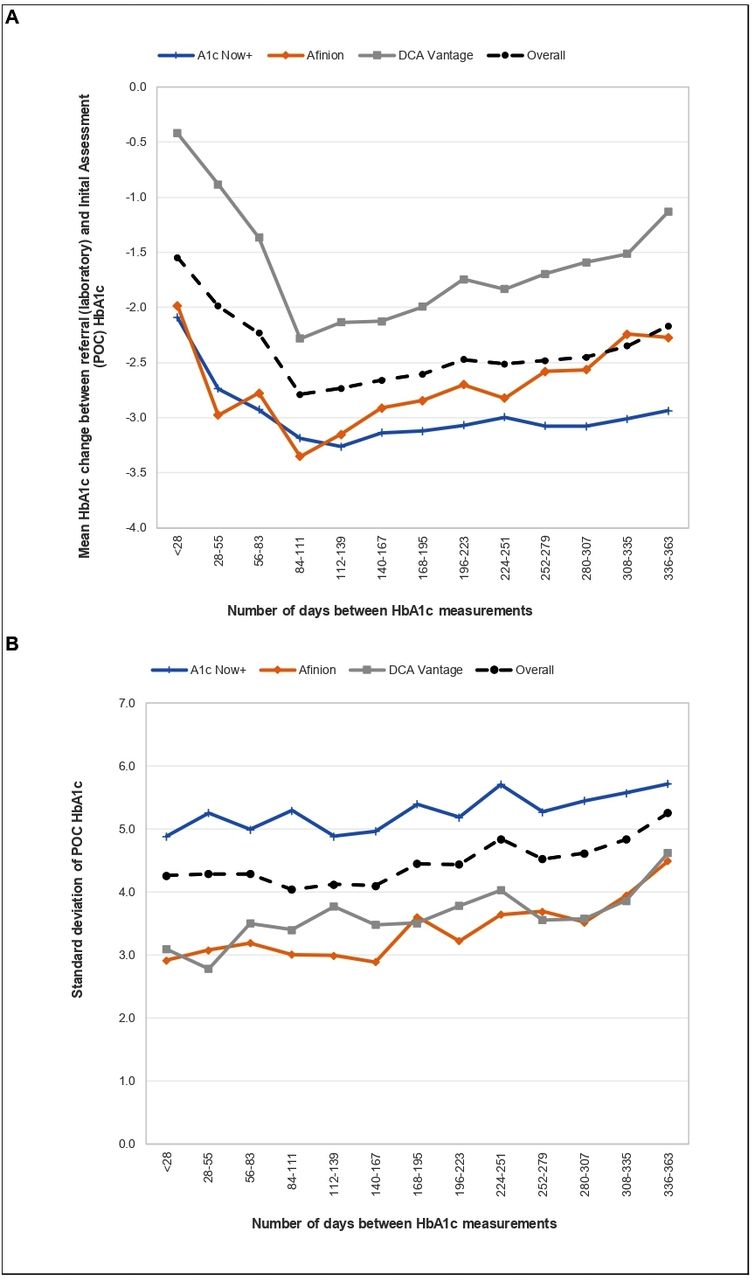
Univariate analyses of outcomes are provided in table 2. HbA1c differences between referral and IA measurements became larger as the number of days between measurements increased from the category of <28 days up to the category of 84–111 days, then reduced as the number of days increased further (figure 1A). The SD of the HbA1c at IA increased as the number of days between measurements increased (figure 1B). Regression analysis indicated that for each 1.0 mmol/mol higher value of referral HbA1c, there was a corresponding 0.2 mmol/mol greater difference between referral and IA POC HbA1c (table 3). The POC pathway had a significant association with observed HbA1c difference; using the ICS Health and Well-being (DCA Vantage) pathway (which had the greatest number of participants) as a reference, no difference in the magnitude of reduction was observed for the Ingeus (DCA Vantage) pathway, but all other pathways were associated with a greater HbA1c difference. Measurements from participants who were older or from more deprived areas were associated with smaller HbA1c differences, but there was no effect of sex. Relative to white groups, Asian, black and mixed ethnic groups had a smaller HbA1c difference. Clustering by local referral area made a proportionally small contribution to the outcomes (ICC 3.7% (2.6%–5.4%)). In model 2, the device was found to be significantly associated with HbA1c difference; Afinion and A1C Now+ devices were both associated with larger differences compared with the DCA Vantage device (online supplemental table S3).

(A) Mean HbA1c change between laboratory-measured HbA1c at referral and POC remeasurement at IA by the number of days between measurements and device. (B) SD of IA POC remeasurement HbA1c by the number of days between HbA1c measurements and device. HbA1c, glycated hemoglobin; IA, initial assessment; POC, point-of-care.
Difference between laboratory-measured HbA1c at referral and point-of-care remeasurement at IA by pathway (N=61 623), mixed-effects linear regression
Association of HbA1c change with weight
A subset of 20 576 participants had available weight measurements at referral and IA. At referral, the mean weight was 81.7 (SD 18.3) kg and the mean HbA1c was 43.6 (SD 1.5) mmol/mol (6.1 (0.14) %). The mean weight change between referral and IA was +1.4 kg (t=39.8, p<0.001), with 56% of the participants gaining weight, 17% remaining the same and 27% losing weight. The mean HbA1c difference between referral and IA for those with recorded weight measures was −3.13 mmol/mol (−0.29%) (t=95, p<0.001). A reduction in the mean HbA1c was observed across all weight change categories (gaining weight/remaining the same/losing weight). Incorporating weight into the regression model (model 3), we found that change in the referral weight had a small but significant positive association with the change in HbA1c; for each 1 kg increase in weight, there was a 0.06 mmol/mol smaller decrease in HbA1c (online supplemental table S4). The ICC was 1.8% (0.9%–3.7%).
Association between POC HbA1c result and attendance at subsequent intervention session
Studying only those who had sufficient time to attend an intervention session (46,894), 48% of HbA1c measurements were in the normoglycemic range, 46% in the NDH range and 6% in the type two diabetes range. Participants with an IA POC HbA1c in the normoglycemic range had significantly lower subsequent attendance at an intervention session compared with those in the NDH range (58% vs 67%; p<0.001). Logistic regression analysis indicated that participants who were older, up to 74 years, female, from less deprived areas and with a higher BMI, were more likely to attend a subsequent intervention session. It also confirmed lower attendance for those with IA POC HbA1c in the normoglycemic range, even after adjusting for other factors (table 4). The ICC was 26.1% (18.3%–35.8%).
Attendance of at least one intervention session in the National Health Service (NHS) Diabetes Prevention Programme after IA (N=33 544), mixed-effects logistic regression
Sensitivity analyses conducted by rerunning the regression models using imputed data showed no changes in direction and magnitude of the associations (online supplemental tables S5–S8).
Discussion
Summary of key findings
Data from 73 703 participants in the NHS DPP show significant reductions between referral laboratory-measured HbA1c and HbA1c remeasured using a POC device on first attendance of the program. Acknowledging the effects of regression to the mean, we found that the magnitude of the reduction in HbA1c observed was associated with the POC device used, the POC testing pathway, individual participant factors, including age, ethnicity and social deprivation, and time between measurements. Furthermore, reductions in HbA1c were greater than concurrent weight change would suggest is attributable to behavior change, although it is possible that other behavioral modification, independent of weight change, and not captured in this study, were also associated with the mean HbA1c difference. POC HbA1c in the normoglycemic range was associated with lower subsequent intervention attendance. However, it is important to note that this study does not attempt to assess the accuracy of POC testing, but rather examines the implications of using POC in the NHS DPP.
Use of POC HbA1c devices
There is increasing interest in the use of POC diagnostics internationally, where the provision of results in real time might positively impact patient care.8 Despite reasonable POC HbA1c testing performance in laboratory method evaluations, performance has been variable in some research studies,9–11 although newer-generation analyzers have shown improved analytical performance.12 13 While the use of POC HbA1c in community settings has generated interest,14–18 performance of POC HbA1c away from highly regulated, specialist supported laboratories within the narrow NDH range remains unclear.
The NHS DPP does not generate contemporaneously measured POC and laboratory-measured HbA1c and cannot robustly validate POC device performance against a reference. However, significant differences in the mean HbA1c between referral and IA were demonstrated for all pathways and devices. POC pathway and device had significant associations with the observed HbA1c difference, independent of other variables, including the time between measurements. The association of higher referral HbA1c values with larger differences suggests regression to the mean. However, the mean HbA1c differences were significantly larger for all devices and pathways than the mean HbA1c differences between two laboratory HbA1c measurements as part of a previously published regional study, the Norfolk Diabetes Prevention Study.19 20 While regression to the mean is likely contributory, there is no obvious reason why the contribution should be so much greater for NHS DPP compared with the previous regional study, although the regional population was smaller, less ethnically diverse with less variation by age and over a shorter time period. One potential explanation for the observed differences in our study is the introduction of a significant negative bias (attributable to both pathway and device) when POC HbA1c testing was applied in the community setting.
The significant differences in the SDs of IA POC HbA1c between pathways may reflect differences in the level of training of the user, location and transportation of devices, or other factors such as device maintenance and calibration, although the POC HbA1c device used was a significant independent factor with significant differences between all three devices, suggesting the underlying assay methodology was an important contributor.
Use of POC HbA1c assays in the NDH range
The IFCC task force (TF) published performance criteria for HbA1c methods using total allowable error, a concept applied to the measurement of any analyte that encompasses both assay bias and imprecision.21 Total allowable error that falls within the biological variability of an analyte or below the threshold for a clinically meaningful change is considered acceptable. For HbA1c, a total allowable error of 5 mmol/mol is an internationally derived performance standard for HbA1c assays.21 22 Laboratory environments are highly controlled with specialists available to identify and troubleshoot errors quickly. In contrast, POC application in community settings may struggle with recognition of quality issues without adequate support.18 21–23 Indeed, in one study, many non-laboratory practitioners did not appreciate the impact of biological variability and analytical imprecision on small changes in HbA1c.24 However, while this allowable error is acceptable when applied to the values of HbA1c commonly encountered in diabetes care, it nearly completely traverses the NDH range, challenging meaningful interpretation despite appropriate quality frameworks.
The EurA1c study assessed both laboratory and POC devices in different countries and settings, using the 5 mmol/mol total allowable error criteria set by the IFCC TF.25 Data from the most recent round of this study showed a mean bias of +0.5 mmol/mol and coefficient of variation (CV) of 4.1% in the UK. The Afinion device reported a bias of −1.7 mmol/mol and CV of 3.3% and the DCA Vantage device reported a bias of −0.6 mmol/mol and CV of 3.7%. The A1CNow device was not studied. These data reflect observations in the NHS DPP and suggest that bias of devices within the NHS DPP lie within the allowable error.
Clinical implications of using POC HbA1c devices
The use of HbA1c to track responses to interventions in those with NDH has not previously been evaluated in terms of reliability of results or effects on behavior. It has been suggested that the immediacy of POC HbA1c results may have beneficial effects on motivation and behavior.26 27 However, in this context, POC HbA1c testing in the NHS DPP moved a large proportion of people into the normoglycemic range, which in turn was associated with reduced subsequent attendance, although regression to the mean may have accounted for some of this effect, irrespective of the methodology used for retesting HbA1c. However, it is possible that other behavioral changes not captured in this study may have influenced participants’ decisions not to continue to attend the program.28
HbA1c measurements within the NHS DPP were only used to assess response to the intervention and not for diagnosis. A POC HbA1c value in the diabetes range did lead to a repeat laboratory-measured HbA1c value, but POC HbA1c values in the normoglycemic range were not repeated. The risk of a delayed diagnosis of type 2 diabetes resulting from lower POC HbA1c values within the NHS DPP should be mitigated by the routine application of NICE guideline PH38,2 which recommends annual reassessment of glycemic status for people with NDH. Annual rechecks of HbA1c in those with NDH in England will also be incentivized in future via general practice pay-for-performance.29
The same POC HbA1c device and pathway was used for each individual to track response to the intervention, so at cohort level, mean changes in HbA1c preintervention/postintervention provided a useful marker of overall program effectiveness, irrespective of any potential negative bias and higher variability.30
EQA is a reliable mechanism for identifying assay drift and for identifying poor performance beyond total allowable error, although this relies on the ability to identify and resolve quality issues, which may be challenging for non-specialists.24 Some national schemes where POC HbA1c has been implemented in standardized community locations have had some success, though performance is variable despite intensive education and not all devices can undergo EQA.23 31
Other factors associated with HbA1c change
Other significant associations in the change in HbA1c include age (with those under 40 years with the greatest decrease), ethnicity (Asian, black and mixed participants have a significantly smaller decrease compared with white participants), and socioeconomic status (with the least deprived having the greatest decrease). The change in HbA1c varied by the number of days between tests, with the HbA1c difference between referral and IA becoming larger from the category of <28 days up to the category of 84–111 days and then some decrease. This could be consistent with people modifying their behavior initially after diagnosis of NDH (assuming at referral) and then lapsing. It is possible that the association between measurement change and some of the aforementioned parameters relates to differences in the extent of behavior change following referral/diagnosis of NDH and prior to attendance at IA. However, using weight change between referral and IA as a surrogate for behavior change, which shows more weight gain than weight loss, suggests against this.
Limitations
A limitation to the current analysis is that it is not possible to fully determine the extent of regression to the mean. The HbA1c reductions seen in these analyses were certainly much larger than those seen in a study applied to a very similar but smaller homogeneous population where repeat values were also assessed after an interval,19 20 suggesting an impact of additional contributors in the current analyses.
We assumed all referral HbA1c values were laboratory-measured, but a small proportion, although not routine practice in the UK, may have been POC-measured. Differences in mean HbA1c reduction may also reflect variability in the referral HbA1c values from different laboratory methods, which were not harmonized across the program, but are all assumed to be IFCC-calibrated.
There was a large variation in time between referral and IA. However, associations between HbA1c change and pathway and device were independent of time elapsed in the regression analyses. We were not able to formally assess bias of POC methods but used regression models to demonstrate that devices and pathways had associations with observed HbA1c differences.
Device selection was left to the providers who were supplied with guidance around expected minimum performance criteria.
Conclusion
In summary, we show that a variety of modifiable and non-modifiable factors are associated with differences between laboratory-measured HbA1c in the NDH range and subsequent POC measurements in the NHS DPP, including POC device, but also how it is used and implemented (POC pathway). Critically, we show that the difference in measured HbA1c may indicate values in the normoglycemic range at IA and that this is associated with a reduction in subsequent attendance at diabetes prevention intervention sessions. We propose that particular attention be paid to the modifiable factors identified in this analysis, such as the POC device selected and pathway of implementation, as the observed changes in some cases have the potential to alter subsequent participant engagement with the program.
Acknowledgments
SM is supported by a European Federation for the Study of Diabetes (EFSD) Mentorship Award and by the NIHR Biomedical Research Centre at Imperial College Healthcare NHS Trust. The views expressed are those of the author(s) and not necessarily those of the NHS, the NIHR or the Department of Health. KK acknowledges support from National Institute for Health Research (NIHR) Applied Research Collaboration and the NIHR Leicester Biomedical Research Centre. SJ is funded by the NIHR Oxford Biomedical Research Centre and NIHR Collaboration for Leadership in Applied Health Research and Care Oxford.
References
Supplementary materials
Supplementary Data
This web only file has been produced by the BMJ Publishing Group from an electronic file supplied by the author(s) and has not been edited for content.
Supplementary Data
This web only file has been produced by the BMJ Publishing Group from an electronic file supplied by the author(s) and has not been edited for content.
Footnotes
EB and SM are joint first authors.
Contributors JV, SM and EB conceived the study. EB managed the data and did the statistical analysis. All authors collaborated in the interpretation of the results and in the drafting and revision of the report.
Funding The authors have not declared a specific grant for this research from any funding agency in the public, commercial or not-for-profit sectors.
Competing interests JV is the national clinical director for Diabetes and Obesity at NHS England and is the Clinical Lead for the Healthier You: NHS Diabetes Prevention Programme. EB is the Head of Health Intelligence (diabetes) for Public Health England and leads analysis of the Diabetes Prevention Programme. CB is the primary care advisor to the NHS Diabetes Programme. BY is clinical lead of the National Diabetes Audit for England and Wales and a Trustee of Diabetes UK. KK was chair of the Programme Development Group for the National Institute for Health and Care Excellence (NICE) public health guidance on type 2 diabetes: prevention in people at high risk (NICE PH38). KK is also codirector of the Leicester Diabetes Centre, and one of the programme providers, Ingeus UK Ltd, provide interventions based on the type 2 Diabetes Prevention Programme developed by LDC. NJW was Chair of the Programme Development Group for NICE public health guidance on Type 2 diabetes prevention: population and community-level interventions (NICE PH35). JS represents Public Health England on the NHS England Diabetes Programme Board. SON is the clinical director at Diabetes UK. MS is primary investigator for the NDPS programme. WGJ was chair of the IFCC-WG on Haemoglobin A1c Standardisation and of the IFCC-TF.
Patient consent for publication Not required.
Provenance and peer review Not commissioned; externally peer reviewed.
Data availability statement No data are available.
Supplemental material This content has been supplied by the author(s). It has not been vetted by BMJ Publishing Group Limited (BMJ) and may not have been peer-reviewed. Any opinions or recommendations discussed are solely those of the author(s) and are not endorsed by BMJ. BMJ disclaims all liability and responsibility arising from any reliance placed on the content. Where the content includes any translated material, BMJ does not warrant the accuracy and reliability of the translations (including but not limited to local regulations, clinical guidelines, terminology, drug names and drug dosages), and is not responsible for any error and/or omissions arising from translation and adaptation or otherwise.