Article Text

Abstract
Introduction Population-level and individual-level analyses have strengths and limitations as do ‘blackbox’ machine learning (ML) and traditional, interpretable models. Diabetes mellitus (DM) is a leading cause of morbidity and mortality with complex sociodemographic dynamics that have not been analyzed in a way that leverages population-level and individual-level data as well as traditional epidemiological and ML models. We analyzed complementary individual-level and county-level datasets with both regression and ML methods to study the association between sociodemographic factors and DM.
Research design and methods County-level DM prevalence, demographics, and socioeconomic status (SES) factors were extracted from the 2018 Robert Wood Johnson Foundation County Health Rankings and merged with US Census data. Analogous individual-level data were extracted from 2007 to 2016 National Health and Nutrition Examination Survey studies and corrected for oversampling with survey weights. We used multivariate linear (logistic) regression and ML regression (classification) models for county (individual) data. Regression and ML models were compared using measures of explained variation (area under the receiver operating characteristic curve (AUC) and R2).
Results Among the 3138 counties assessed, the mean DM prevalence was 11.4% (range: 3.0%–21.1%). Among the 12 824 individuals assessed, 1688 met DM criteria (13.2% unweighted; 10.2% weighted). Age, gender, race/ethnicity, income, and education were associated with DM at the county and individual levels. Higher county Hispanic ethnic density was negatively associated with county DM prevalence, while Hispanic ethnicity was positively associated with individual DM. ML outperformed regression in both datasets (mean R2 of 0.679 vs 0.610, respectively (p<0.001) for county-level data; mean AUC of 0.737 vs 0.727 (p<0.0427) for individual-level data).
Conclusions Hispanic individuals are at higher risk of DM, while counties with larger Hispanic populations have lower DM prevalence. Analyses of population-level and individual-level data with multiple methods may afford more confidence in results and identify areas for further study.
- informatics
- diabetes mellitus
- type 2
- ethnic groups
- risk factors
This is an open access article distributed in accordance with the Creative Commons Attribution Non Commercial (CC BY-NC 4.0) license, which permits others to distribute, remix, adapt, build upon this work non-commercially, and license their derivative works on different terms, provided the original work is properly cited, appropriate credit is given, any changes made indicated, and the use is non-commercial. See: http://creativecommons.org/licenses/by-nc/4.0/.
Statistics from Altmetric.com
Significance of this study
What is already known about this subject?
Much has been reported about the relationship between certain sociodemographic factors and diabetes mellitus (DM): low SES, African-American ethnicity and other factors have been associated with higher rates of DM.
What are the new findings?
Machine learning (ML) outperforms regression in modeling DM in both of the datasets used (ie, at both the individual and population levels) and may thus be a better tool in guiding community-level and population-level health efforts.
ML identifies nearly identical risk factors for DM as those identified by regression both in this analysis as well as in past analyses using regression.
There exists a paradoxical relationship between Hispanic ethnicity and DM; Hispanic individuals are at higher risk of DM themselves, while counties with larger Hispanic populations have lower DM prevalence as a whole.
How might these results change the focus of research or clinical practice?
First, this analysis should prompt thoughtful evaluation of how different communities—such as Hispanic populations—both affect and are affected by their surroundings. This evaluation, in turn, should be used to guide more effective, meaningful efforts to support disadvantaged communities. Additionally, the result that ML outperformed regression in both datasets serves as an impetus for increased use of ML in guiding population-level interventions and policy—even small increases in predictive power are meaningful at these scales. Finally, we hope that the technique used in this study of analyzing complementary datasets with multiple methods serves as a model for future, robust analyses.
Background and significance
Over 30 million individuals in the USA live with diabetes mellitus (DM), a leading risk factor for cardiovascular disease, kidney disease, and health expenditures.1–3 Prior work has identified numerous sociodemographic and health risk factors associated with either population-level or individual-level DM, such as age, race/ethnicity, and income levels.4–9 However, neither individual-level nor population-level analyses alone are likely to identify all relevant associations, as the interaction between an individual and their geography may impact DM prevalence and in risk factors associated with DM.9 10
Population-level and individual-level analyses of health data are each associated with specific strengths and limitations. Population-level studies based on interview data have the advantage of size, but the disadvantage of potentially inaccurate self-reported data.11 These disparities are exacerbated by the fact that rates of under-reporting differ across populations.12 However, individual-level, in-person analyses may produce more accurate data but are limited in size and may fail to capture important macro-level phenomena associated with health outcomes such as access to healthcare, one’s built environment, or the median income of the community in which one lives.8 9 13 Unfortunately, few studies of DM have simultaneously used both county-level and individual-level data to validate (or identify discrepancies between) the factors associated with DM at the community and individual level. For these reasons–and given recent emphasis on the need to perform external validation of analyses of large data sets—we sought to identify sociodemographic factors associated with county-level DM prevalence and to validate our analyses using individual-level DM data.14
The collective understanding of diabetes and its associated risk factors will likely be furthered by the rapid growth and utilization of machine learning (ML). In fact, ML models, as compared with traditional epidemiological models, have shown promise in studying disease prevalence and explaining variation in health outcomes, including risk factors and complications associated with diabetes.13 15 However, in healthcare, the theoretical promise of ML has perhaps exceeded its demonstrated successes.16 17 Three closely related properties of ML likely contribute to reluctance in embracing its use: (1) ML models allow such complex relationships between variables that they are capable of ‘overfitting’, potentially reporting apparently statistically significant yet spurious associations; (2) ML models may encode bias from the data on which they are trained or the way in which their features are designed; and (3) even if a model does suffer from these aforementioned shortcomings, it is not always apparent since ML models are ‘blackboxes’—the exact ways in which features interact with each other to inform the results are typically not readily interpretable.18 19 Depending on data used for analysis, these issues are further complicated by questions about the reliability of self-reported data. Thus, using traditional epidemiological models alongside ML to study the same questions on the same datasets—as is done in this analysis—can help to alleviate concerns about the relationships identified by ML or to identify those instances in which ML suffers from the aforementioned flaws.
In this study, we sought to investigate the association between sociodemographic factors and county-level DM prevalence, validating the analysis using individual-level data. Additionally, for both analyses, we used contemporary ML methods, validating each analysis with traditional regression methods. Thus, we employed two layers of validation in this analysis: validation at the level of datasets (ie, individual-level and county-level data) and statistical techniques (ie, traditional regression and ML). By using these validation measures, we hoped to responsibly extend the current literature surrounding DM and how DM is modeled.
Methods
This manuscript is reported following the Strengthening the Reporting of Observational Studies in Epidemiology guidelines for cross-sectional studies.20
Data sources
County-level DM prevalence, demographics, and socioeconomic factors were extracted from the 2018 Robert Wood Johnson Foundation County Health Rankings (CHR)—the most recent CHR dataset available at the time this analysis was performed. The CHR, produced annually, is based on data from the Behavioral Risk Factor Surveillance System, the Centers for Disease Control, and other research organizations. The CHR county-level factors include demographic, socioeconomic, healthcare, and environmental factors. These data are collected from 3138 US counties. Details regarding this dataset, including the interpolation and estimation methodology used, are available online.21 These data were merged with US Census data to identify each county’s respective census region.
Individual-level demographics, socioeconomic factors, and health data were extracted from the biannual National Health and Nutrition Examination Survey (NHANES) studies conducted from 2007 to 2016—the most recent, complete NHANES dataset available at the time of this analysis. NHANES, established by the National Center for Health Statistics, is a series of complex, multistage cross-sectional examinations administered annually to approximately 5000 non-institutionalized civilian individuals of all ages from 15 randomly selected counties or small groups of contiguous counties. NHANES participants initially participate in a health interview in their home, followed by clinical tests, a dietary interview, and physical exams at mobile examination centers. Through these interviews, tests, and exams, NHANES collects sociodemographic and physiological information. NHANES amasses data on a wide variety of diseases, medical conditions, and health indicators, including DM, cardiovascular disease, sexual behavior, physical activity, dietary intake, and environmental exposures. Further details are available on the NHANES website.22
Assessment of DM status
County-level DM prevalence, obtained directly from CHR data, is the interpolated county-level percentage of adult survey respondents aged 20 years and above with diagnosed DM in a given county, that is, those adults 20 years and older who responded ‘yes’ to the question, ‘Has a doctor ever told you that you have diabetes?’. Given the data available, the present analysis did not distinguish between type 1 and type 2 DM. To do so, further study leveraging additional richer datasets is necessary.23 Individual-level DM status was manually classified in this analysis using a defined set of laboratory and/or survey criteria in order to capture diagnosed and previously undiagnosed DM. Specifically, if an individual met/answered ‘yes’ to either of the following criteria, he or she was deemed to have DM: (1) hemoglobin A1c (HbA1c) >6.5% or (2) ‘Have you ever been told by a doctor or health professional that you have diabetes or sugar diabetes?’. HbA1c was used to capture previously undiagnosed participants in keeping with recent studies that demonstrated that HbA1c represents the gold-standard indicator of undiagnosed DM in the NHANES dataset.24 25
Eligibility criteria
Among the CHR data, individuals younger than 20 years of age were automatically excluded as part of the survey design. Of the NHANES data, the present study included adults over the age of 20 years who reported not being pregnant. This was done to exclude participants with gestational DM, which has been shown to be associated with different etiologies, risk factors, and prevention strategies than other types of DM.26
Statistical analyses
All analyses were performed using R V.3.5.2 software (The R Foundation). The continuous outcome assessed (ie, county-level prevalence) was modeled with multivariate linear regression; the binary outcome assessed (ie, individual-level DM status) was modeled with multivariate logistic regression. Models were evaluated based on the percent of variation explained (ie, mean R2 (county) or area under the receiver operating characteristic (AUROC) curve (individual)). For both individual-level and county-level data, univariate regression models were fit on each prespecified sociodemographic factor and DM status or prevalence. Multivariate linear regression was used to find the association between county-level DM prevalence and all county-level factors in each group of factors: demographic, socioeconomic, healthcare, environmental, and region. Multivariate logistic regression was used to find the association between individual-level DM status and all individual-level factors in each group of factors: demographic, socioeconomic, and behavioral/health. Finally, given that some risk factors have been shown to be associated only with undiagnosed DM, sensitivity analyses were performed to apply the same definition of DM (ie, only undiagnosed DM) to both datasets; that is, HbA1c levels were excluded from assessment of DM status in the individual-level (NHANES) dataset.27 28
The ML models included in the present investigation were chosen, trained, and evaluated following an approach from recent, related work on obesity.29 The models used were Gradient Boosting (GBM), regression trees, random forest, a linear model chosen using penalized-likelihood criteria such as Akaike information criterion and Bayesian information criterion, and a penalized linear model based on the least absolute shrinkage and selection operator. The parameters of each model were tuned using fivefold cross-validation, where the training data were divided into five subsets or folds, in order to balance performance on training data and overall generalizability. For each parameter of each model, all combinations of values from a predetermined range were combined into a search grid from which values were sampled consecutively. For each combination of parameter values in this grid, one testing fold was set aside as a testing fold, while the model was trained—and the AUROC (individual) or R2 (county) was evaluated—on the other four folds of the data. This was repeated five times, so that each of the five folds was used once as a testing fold, and the average of the AUROC/R2 values over the five testing folds was reported. The top-performing model and its parameters were selected based on per cent of variation explained (ie, mean AUC (individual) or R2 (county)). Then, in both individual-level and county-level datasets, regression and the top-performing ML model were compared using the Wilcoxon rank-sum test for paired samples based on the relevant measure of percent variation explained in 30-fold cross-validation.
To account for the complex survey design of NHANES, sample survey weights were employed using the ‘survey’ package in R to generate population summary statistics and to adjust regression analyses accordingly.30 Separately, summary statistics and regression analyses were generated without survey weights. The impact of the exclusion of survey weights was examined by comparing the confidence intervals for the regression coefficients in the models that did and did not use survey weights.
Results
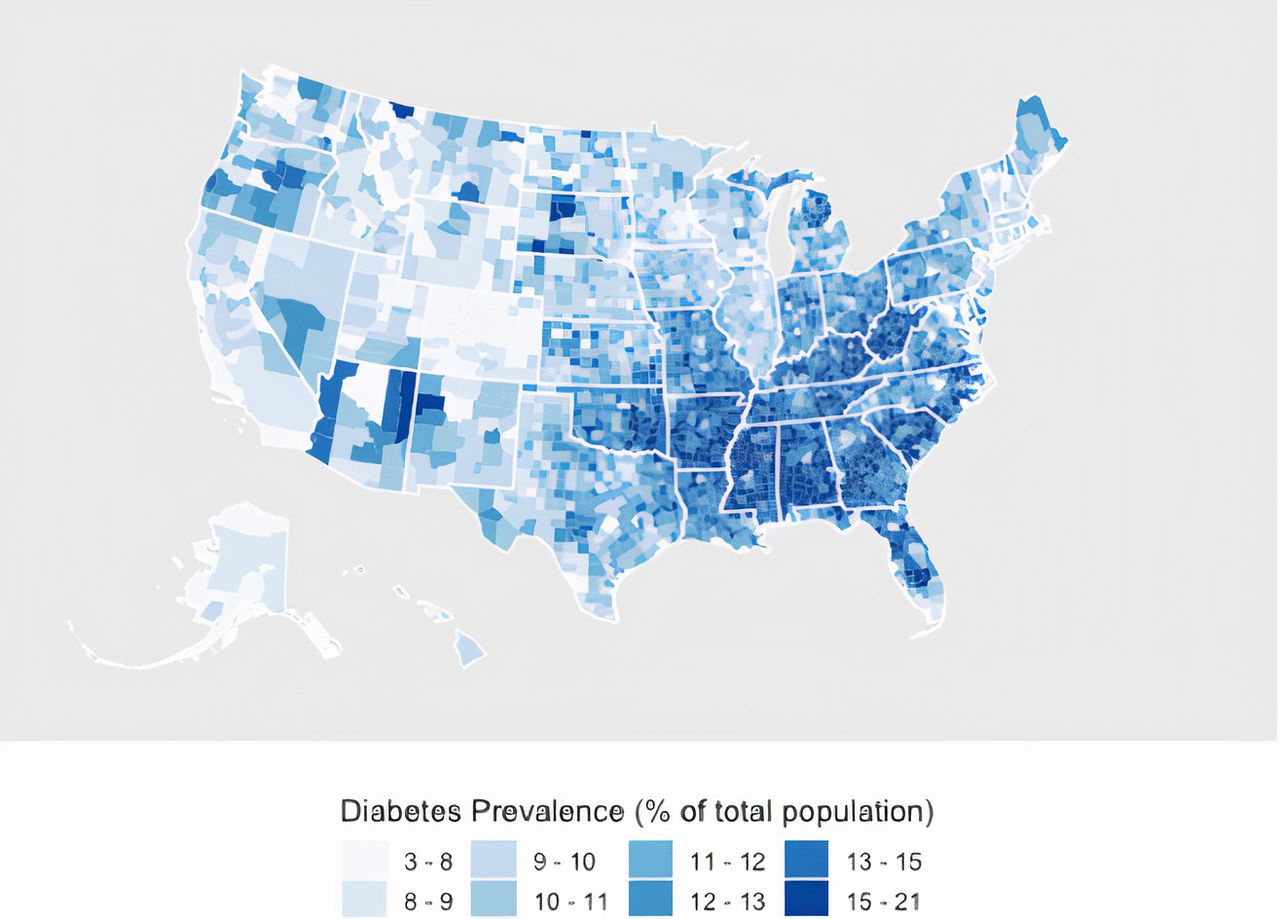
Among the 3138 counties from the 2018 CHR dataset, the mean county-level DM prevalence was 11.4% (3.0%–21.1%); among the 12 824 individuals from the 2007–2016 NHANES data, 1688 met laboratory and/or survey criteria for DM (13.2% unweighted; 10.2% weighted). There are marked regional differences in DM prevalence (figure 1); the US South and Midwest had the highest DM prevalence, while the Northeast and West regions had the lowest prevalence (see online supplemental table 5). In univariate regression models, among the sociodemographic variables shared by both the NHANES and CHR datasets, age, male gender, percentage identifying as African-American, average household income, and education level were all associated with both individual DM status and county-level DM prevalence (table 1). Higher household income and education level were associated with lower rates of DM at both the county and individual levels; African-American per cent (county) or status (individual), as well as older age, was associated with high rates of DM at both the county and individual levels. A higher percentage of Hispanics was associated with lower rates of DM at the county level, while individual Hispanic status was associated with higher individual rates of DM. Similarly, higher county-level ratios of females to males were associated with higher county-level rates of DM, while being female was associated with lower individual rates of DM (table 1). In multivariate regression models adjusting for demographic and socioeconomic factors, household income, education level, gender, race or ethnicity, and age were all significantly associated with DM at the county and individual levels (table 2). In sensitivity analyses applying the same definition of DM (ie, only self-reported DM) to both datasets, all associations reported above remained significant using multivariate regression; using univariate regression, all associations remained significant except that between Hispanic ethnicity and individual DM status (p=0.124) (see online supplemental tables 3 and 4). In additionally adjusted models—controlling for environmental, healthcare access, census region, and behavioral/health factors—all of the sociodemographic factors above remained significantly associated with county-level DM prevalence and individual DM status except education level, which was no longer associated with individual DM (see online supplemental tables 1 and 5).
Supplemental material
Supplemental material
Supplemental material
Supplemental material
Univariate regression results
Multivariate regression results
Map of DM prevalence by county. Map of US counties according to county-level DM prevalence rates obtained from CHR data. CHR, County Health Rankings; DM, diabetes mellitus.
Summary statistics and multivariate regression output for the individual data constructed without using NHANES survey weights can be found in online supplemental tables 2 and 6. The same factors remained significantly associated with individual DM status–and the direction of the relationship (positive or negative) remained the same—with and without the use of survey weights (table 2, see online supplemental tables 2 and 6).
Supplemental material
Supplemental material
Model comparison
GBM was the top-performing ML model in both datasets. For both, GBM significantly outperformed regression (mean AUROC of 0.737 vs 0.727, respectively (p<0.0427) for individual-level data; mean R2 of 0.679 vs 0.610, respectively (p<0.001) for county-level data). The parameters of the GBM model with the highest AUC using individual-level data were number of trees=60, interaction depth=6, shrinkage=0.05, and minimum number of observations in node=2; the parameters of the GBM model with the highest R2 using county-level data were number of trees=200, interaction depth=16, shrinkage=0.05, and minimum number of observations in node=2. These values maximize performance on training data while avoiding overfitting in order to maintain generalizability.
Discussion
Using two nationally representative datasets, we studied the associations between sociodemographic factors and (1) DM prevalence at the county level and (2) DM status at the individual level. We compared the explanatory power of traditional epidemiological and novel ML methods. All of the sociodemographic factors assessed in the present analysis—including age, gender, African-American race, Hispanic ethnicity, household income, and education level—were significantly associated with diabetes prevalence or status at both the county and individual levels. After adjusting for additional behavioral and health factors, all of these associations remained except education level. We found that ML outperformed multivariate regression in both individual-level and county-level data. We observed that higher proportions of Hispanic individuals were associated with lower rates of county-level DM, but being Hispanic was associated with higher rates of individual-level DM, a novel finding that would not have been uncovered through the analysis of only one type of data.
The finding that Hispanic ethnicity was negatively associated with DM prevalence at the county level, but positively associated with risk of DM at the individual level, is noteworthy and warrants further study. Since Hispanics disproportionately live in the US West, it is possible that counties where Hispanics tend to live have lower overall rates of obesity and other risk factors associated with DM.29 Counties in the Western USA also have relatively smaller populations of African-Americans, who have a higher risk for DM.4 Nevertheless, Hispanic ethnicity remained an independent predictor of DM prevalence after controlling for region. This finding that a higher percentage of Hispanics was associated with lower county-level rates of DM gives credence to the observations of previous studies, demonstrating that high proportions of Hispanics are associated with a protective effect against county-level obesity, which is in turn closely associated with DM.29 31 32 The results of those and the present analysis indicate that higher Hispanic ethnic density is associated with better health at the county level, corroborating the notion of a ‘Hispanic Paradox’—that is, the epidemiological phenomenon in which Hispanic and Latino Americans tend to have health outcomes and mortality rates that ‘paradoxically’ are comparable with, or in some cases better than, those of their US non-Hispanic white counterparts, even though Hispanics have lower average income and education.33 34 The observation that being of Hispanic ethnicity was associated with higher individual DM risk, however, complicates this idea of a Hispanic paradox but is perhaps unsurprising, given that Hispanic populations are on average associated with lower income and education, both of which are independently associated with higher rates of DM.32–36 This association between Hispanic ethnicity and individual DM status remains significant after controlling for income and education level; this implies that there exist unmeasured risk factors for DM beyond these impactful socioeconomic factors. Future research should explore potential explanations for these paradoxical findings, including whether living alongside more other members of one’s own culture is associated with improved health outcomes, or whether individuals who live in communities with higher proportions of Hispanics or otherwise more ethnically diverse communities possess more DM-friendly diets or engage in healthier lifestyles or behaviors.
Complementary to other studies, we found household income and education level to be protective against DM at the county and individual levels.37–41 Our finding that female gender was protective against individual DM status was consistent with past studies.42–44 However, we found that at the county level, a higher proportion of women was associated with higher rates of DM prevalence. This novel and paradoxical finding could be explained by the longer life expectancy of women, insufficiently controlled for by the per cent of the population over 65 years old or by underlying differences that this analysis did not account for. Nevertheless, because there exists relatively little variability in percentage female across counties, this may also simply be a spurious finding. Further research should examine the association between the female population of a county and diabetes prevalence.
African-American race was positively associated with both county-level DM prevalence and individual DM status, consistent with the reports of studies illustrating a higher risk of DM among African-American individuals.4 Historically, African-Americans live in higher proportions in counties with lower household incomes as well as in the US South, which was independently associated with higher rates of DM (see online supplemental table 5).29 Nevertheless, African-American race was an independent predictor of both DM at the county and individual levels even when income and geography were adjusted for. It should be noted that counties with higher proportions of African-American individuals may have more diabetogenic environments that we could not adjust for, such as fewer healthy food options and fewer opportunities for physical activity.36 45 Thus, both African-Americans and Hispanics are associated with lower income levels and education, but communities with a higher proportion of Hispanics are associated with lower rates of DM, while communities with a higher proportion of African-Americans are associated with higher rates of DM.
Though the findings at the county and individual levels were very similar, the differences that emerged—particularly those for Hispanic individuals and populations–underscore the importance of validating analyses of large datasets. Both population-level and individual-level analyses serve important roles in understanding phenomena that differentially influence health outcomes at different levels of society, but neither tells the complete story. Failing to validate one with the other introduces the possibility of obtaining spurious or misleading findings, which may yield inefficient or misguided efforts to prevent disease development and progression.
We found that ML models explained more of the variation in individual diabetes status and county-level diabetes prevalence than standard regression models, while identifying nearly the same set of risk factors. The fact that ML and standard multivariate regression identified the same risk factors from both individual-level and county-level data provides crucial validation for these ML methods and affords additional confidence in the increased explanatory power associated with ML. The performance improvement generated by ML was significant for the county-level analysis, suggesting that researchers and policymakers should use these models to guide population-level analyses and interventions. The marginal performance improvement of ML for the individual-level analysis suggests that for such studies, more interpretable model will likely be adequate, or potentially superior, for most practical purposes. This may alleviate the concerns of those using traditional interpretable models in this context that they are missing out on the potentially superior performance of ML. This also provides an additional data point for the current, impassioned debate about whether interpretable models must necessarily suffer from performance far inferior to that of ML models.46
Because publicly available CHR data lack individual-level information—and because publicly available NHANES data lack county-level information—there does not currently exist a single dataset that can be used to examine each potential risk factor at the individual and county levels simultaneously using the same data. Using two independent datasets does, however, confer value in the context of ML by increasing the amount of data available—and, through this, increasing explanatory power—while mitigating the risk of producing spurious or misleading results.
In order to protect and better serve disadvantaged groups, certain ethical considerations should be made when using ML and traditional methods alike. First, results must not be used to exacerbate existing health or socioeconomic disparities—and results regarding race must be interpreted with the understanding that race itself is a social construct.47 48 Additionally, in clinical practice, it is crucial that providers continue to take into account individual priorities and socioeconomic or cultural circumstances, which statistical methods are unable to account for. Finally, just as with traditional regression, sampling methods in ML must minimize bias; ML models are trained on the data creators supply them, and their predictive power and perceived accuracy on subsequent data is rooted in the same biases introduced during the acquisition of the data. Both NHANES and CHR have implemented measures such as oversampling of minority populations, in the case of NHANES, and contribution from multiple datasets, in the case of CHR, to ensure sufficient data are gathered for often-under-represented populations. Nevertheless, as will be discussed, both datasets rely in part on self-reported data and on certain difficult-to-obtain data that is unable to be obtained for all individuals or counties, which may introduce bias.
Limitations
This study is associated with several limitations. First, the NHANES and CHR data used in this analysis were derived from time periods of differing lengths. This was crucial to increase the data available for analysis of NHANES—for many variables included, 2-year cohorts of NHANES reported fewer than 2000 data points. This was particularly important when training ML algorithms, which rely on larger amounts of data. Another possible limitation is the fact that the NHANES and CHR data are based in part on self-reported measures, which could introduce bias. Nevertheless, self-reported DM status has been shown to be effective in estimating provider-assessed DM in certain populations.49 Moreover, while most population studies rely exclusively on self-reported data, the NHANES dataset incorporates ample objective laboratory and physiologic measures. Another potential limitation is how DM was defined or assessed in these two datasets. In the county-level data, CHR may underestimate county-level DM prevalence by only including those diagnosed by a physician. Nevertheless, as long as this bias is non-differential by county or other factors considered, our statistical results remain directionally valid. Additionally, in the individual-level data, individuals were deemed to have DM if they met particular laboratory or survey criteria. Though imperfect, these criteria used are consistent with established, gold-standard definitions of DM that capture participants with both diagnosed and undiagnosed DM. Finally, given the data available, we were unable to distinguish between type 1 and type 2 DM. Because type 2 represents over 90% of US cases of DM, the impact of this limitation is likely minimal.50 Ultimately, as data continue to be amassed and data linkage techniques grow more sophisticated, it may become possible to join different datasets to overcome these sorts of data limitations.
Conclusion
The present analysis confirmed prior results and uncovered novel findings about county-level and individual-level DM. All sociodemographic factors assessed were associated with DM at the individual and county levels. Our finding that a larger Hispanic population was associated with decreased county-level DM prevalence, while being Hispanic was associated with an increased individual risk of DM, requires further study and reinforces the need for external validation when analyzing large repositories of health data. Subsequent studies should continue to explore the complex interplay between environmental and individual factors and their differential effects on health outcomes. Finally, the additional explanatory power afforded by ML compared with traditional methods suggests ML possesses significant utility on the level of population-level analyses and interventions. Nevertheless, the marginal performance improvement on individual-level data suggests that more interpretable regression models will likely be adequate, or potentially superior, for most practical purposes.
References
Supplementary materials
Supplementary Data
This web only file has been produced by the BMJ Publishing Group from an electronic file supplied by the author(s) and has not been edited for content.
Footnotes
FR and DS are joint senior authors.
Contributors GMK designed the research, performed statistical analysis, and wrote the manuscript. DS and FR contributed to data analysis, interpretation of results, and critical revision of the manuscript. All authors contributed meaningfully to this manuscript and approved the final version. GMK is the guarantor of this work and, as such, had full access to all the data in the study and takes responsibility for the integrity of the data and the accuracy of the data analysis.
Funding DMM, DS, PP were supported by R18DK122422. DMM was additionally supported by P30DK116074. FR is funded by a career development award from the National Heart, Lung, and Blood Institute (K01 HL 14460) and the American Heart Association/Robert Wood Johnson Harold Amos Medical Faculty Development Program.
Map disclaimer The depiction of boundaries on the map(s) in this article does not imply the expression of any opinion whatsoever on the part of BMJ (or any member of its group) concerning the legal status of any country, territory, jurisdiction or area or of its authorities. The map(s) are provided without any warranty of any kind, either express or implied.
Competing interests DMM acts as an advisor for Sanofi-Aventis US LLC, Novo Nordisk Inc, WL Gore and Associates, Inc, and Medtronic Minimed, Inc. DS acts as an advisor for Carta Healthcare. No other potential conflicts of interest relevant to this article were reported.
Patient consent for publication Not required.
Provenance and peer review Not commissioned; externally peer reviewed.
Data availability statement Data are available in a public, open access repository. All data used in this study were publicly available from National Health and Nutrition Examination Survey (https://www.cdc.gov/nchs/nhanes/index.htm) and County Health Rankings (https://www.countyhealthrankings.org/)
Supplemental material This content has been supplied by the author(s). It has not been vetted by BMJ Publishing Group Limited (BMJ) and may not have been peer-reviewed. Any opinions or recommendations discussed are solely those of the author(s) and are not endorsed by BMJ. BMJ disclaims all liability and responsibility arising from any reliance placed on the content. Where the content includes any translated material, BMJ does not warrant the accuracy and reliability of the translations (including but not limited to local regulations, clinical guidelines, terminology, drug names and drug dosages), and is not responsible for any error and/or omissions arising from translation and adaptation or otherwise.