Article Text

Abstract
Introduction Several studies have argued a causal relationship between diabetes and depression, while others have highlighted that their association is a result of common risk factors. Because Mexico is a country with a high prevalence of diabetes, and diabetes and depression are a frequent comorbidity, we chose this country to investigate the longitudinal relationship of these two conditions, focusing on the influence of demographic, health, and socioeconomic factors which could act as common risk factors for both conditions.
Research design and methods Using the harmonized Mexican Health and Aging Study, a nationally representative sample of adults older than 50 with a response rate of 93%, we analyzed the longitudinal relationship of diabetes and depressive symptoms using ‘between-within’ random-effects models, focusing on the effect of demographic, socioeconomic and health factors.
Results While older adults with diabetes reported a higher prevalence of depressive symptoms in the four waves of the study, there was no causal longitudinal association between them once controlling for demographic, socioeconomic and health factors (between-effect OR=0.88, 95% CI 0.77 to 1.01; within-effect OR=0.87, 95% CI 0.69 to 1.11).
Conclusions There is no causal longitudinal association between diabetes and depression; the higher prevalence of depression among older adults with diabetes seems a result of socioeconomic and health factors that are not exclusive to respondents with diabetes but are more frequent in this group. Our results highlight the importance of prevention and control of chronic conditions as well as the role of socioeconomic inequalities in mental health.
- diabetes mellitus
- type 2
- depression
- aging
- longitudinal studies
This is an open access article distributed in accordance with the Creative Commons Attribution Non Commercial (CC BY-NC 4.0) license, which permits others to distribute, remix, adapt, build upon this work non-commercially, and license their derivative works on different terms, provided the original work is properly cited, appropriate credit is given, any changes made indicated, and the use is non-commercial. See: http://creativecommons.org/licenses/by-nc/4.0/.
Statistics from Altmetric.com
Significance of this study
What is already known about this subject?
Depression and diabetes are a frequent comorbidity in older adults.
There are doubts about a causal relationship between depression and diabetes.
What are the new findings?
In older adults from Mexico, there does not seem to be a causal relationship between diabetes and depressive symptoms longitudinally.
The relationship between diabetes and depressive symptoms is a result of the higher prevalence of other chronic conditions and socioeconomic hardship in this group.
Older women from Mexico face a particular unfavorable scenario for the development of depressive symptoms as they have higher prevalence of chronic conditions and lower socioeconomic resources.
How might these results change the focus of research or clinical practice?
Clinicians should be aware of the risk factors for depressive symptoms in older patients with diabetes and address comorbidities promptly.
Public health policies should include reduction of health inequalities in diabetes treatment.
Introduction
The worldwide prevalence of diabetes in adults aged 20–79 has been estimated to be 6.4% years and is expected to increase to 7.7% by 2030. However, this increase will not be the same for developed and developing countries. While estimations predict a 20% increase in developed countries, estimates for developing countries are much higher (69%).1 2 In the case of Mexico, this poses urgent public health concerns as the current prevalence of the condition is 11.8%, and its prevalence and the prevalence of its complications and related mortality are also expected to increase.2 3
Equally, the worldwide prevalence of depression is increasing. Even if rates vary depending on the measurement scale, results from previous studies in Mexico estimate a prevalence of depression in older adults of 25.3%.4–7 Risk factors for late life depression include age, female gender, being a widower or single, low educational level, presence of physical illness, use of multiple drugs, presence of stressors and changes in brain white matter.8 Late life depression is associated with poorer outcomes from other physical illnesses; it is linked to a higher incidence of dementia and is related to functional impairments and higher healthcare utilization rates and costs.9–11
Evidence suggests that people with diabetes have an increased risk of developing depression.12 13 Results from Mexico have estimated a prevalence of depression of 48.27% among adults with diabetes.14 Because of this relationship, previous research has tried to explain a causality chain. While some studies suggest that a new diagnosis of diabetes generates a sense of threat and loss which could trigger the onset of depression, others have proposed that this higher prevalence is related to a general psychological distress of being sick; therefore, depression among people with diabetes would seem not exclusively diabetes-related. However, another possible explanation is that both share common sociodemographic, economic and health risk factors, for example age, female gender, lower education and lower income, lower self-rated health, and multimorbidity.15–18 In summary, it is still unclear whether diabetes itself increases the risk of onset of depression or if this relationship is a result of common risk factors.19
In the current study we addressed these issues by looking into the prevalence of depression in older adults with diabetes across the four waves of the Mexican Health and Aging Study (MHAS) and analyzing the longitudinal relationship of diabetes and depression using a ‘between-within’ random-effects approach.
Materials and methods
Data and sample
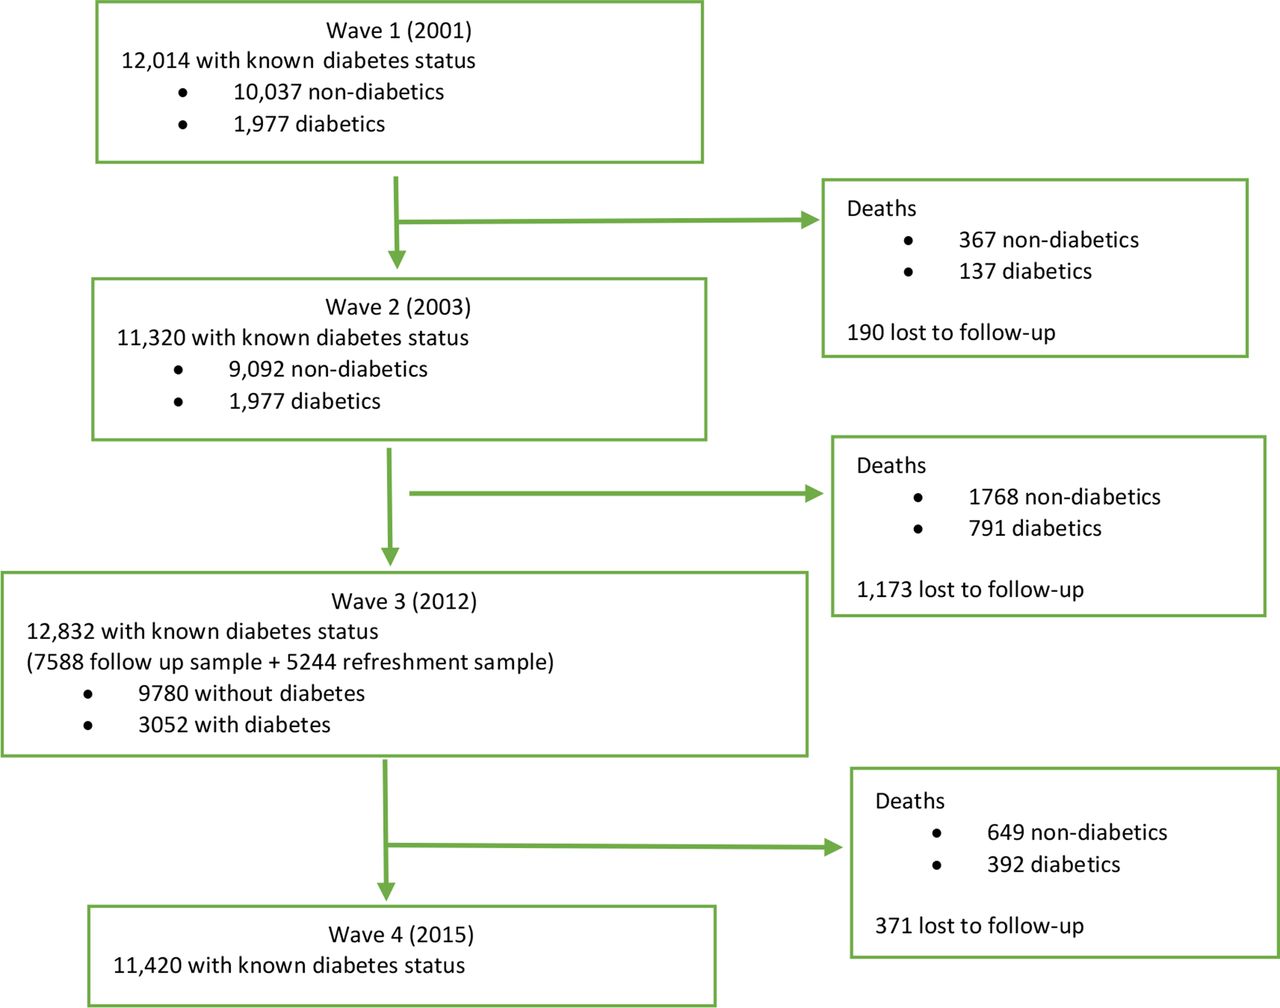
We used panel survey data from the four waves of the MHAS (2001, 2003, 2012 and 2015). This is a prospective study of aging focusing on examining the aging processes as well as the burden of disease and disability in a representative panel of older adults from Mexico born prior to 1951 and their spouses regardless of their age.20 As MHAS is only nationally representative of adults 50 and older, we decided not to include the younger spouses. MHAS was designed following the framework of the Health and Retirement Study from the USA and has a refresher sample in the 2012 wave. A flow chart representing the sampling strategy of respondents with known diabetes is presented in figure 1. For the descriptive statistics, we included adults older than 50 with valid responses for each of the variables with a self-reported diabetes status at baseline and analyzed the differences between respondents with and without diabetes (see table 1). For the panel data analyses, we included all available data from adults older than 50 regardless of their diabetes status at baseline in order to analyze the effect of change in diabetes status.

Data screening process flow chart of adults aged 50 and older with known diabetes status by wave.
Descriptive characteristics of the sample by diabetes status by wave
Measures
The independent variable of this study is self-reported diabetes. Respondents were asked ‘has a doctor or medical personnel ever diagnosed you with diabetes?’ Even if the question does not specify the type of diabetes, as this is a sample of older adults it is assumed that it is diabetes type 2. For the descriptive analyses we only included respondents with known diabetes status, while for the longitudinal analyses we included all individuals. In order to find the overall effect of having diabetes and the effect of change in diabetes status, the mean and the time lagged variables were included in the models. Time lagged variables represent the difference between the baseline response and the response in the next wave, reflecting a change in diabetes status if the respondent did not have diabetes at baseline and has an affirmative response on the next wave.
The dependent variable is depressive symptoms measured by the Center for Epidemiological Studies-Depression-9 (CESD-9). This scale is an adaptation of the Center for Epidemiological Studies-Depression-20 (CESD-20) scale for Anglo-Saxon participants. The equivalent CESD-9 has been validated for the Mexican population. This scale has a calculated sensitivity of 80.7% and a specificity of 68.7%, and a cut-off of 5 points has been used previously to analyze clinically significant symptoms of depression.21
Other control variables
Demographic control variables included three age categories (50–59, 60–69 and 70+), gender (male or female) and marital status (married, widowed separated or divorced, and never married). Socioeconomic variables used as covariates were net worth in quintiles, education in four categories, and being employed or not. Finally, health variables included body mass index (BMI), number of chronic conditions (arthritis, hypertension, heart conditions, lung disease and cancer) and self-rated health as a proxy for objective health status. For the panel data analyses, for all dichotomic and continuous variables, the mean and the time-demeaned variables were included in the models in order to find the ‘between’ and ‘within’ effects. The effects of smoking were considered but were not significant in the cross-sectional analyses and did not change the result of the models so were left out.
Analysis strategy
The first analysis used Pearson’s χ2 test in order to find significant distribution differences between the groups by diabetes status by wave. Depressive symptoms in the four waves of the study as well as demographic, health and socioeconomic characteristics were included (see table 1). This was followed by panel data analyses using ‘between-within’ random-effects models in order to distinguish significant differences between respondents with or without the condition (between effect) using the average diabetes status, from the subject-specific effect of a change in status over time (within individuals) using the time lagged diabetes status variable. Significant results of only between estimates would suggest that the effect of diabetes is driven by unobserved between-individual characteristics which have not been controlled for, or selection effects bias as individuals with diabetes may be inherently different from those without the condition. Significant within-effects estimates would provide better causal inferences as these indicate whether, for an individual, a change in diabetes status affects the likelihood of depressive symptoms (analogous to fixed-effects models).22 With regard to missing values, similar to random-effects models, between-within random-effects models hold the assumption that data are missing at random, so no imputation or other further tests of missing values were performed. The first model (M1) included diabetes status and demographic characteristics (age, gender and marital status). Then, in order to find if the significance of the effect of these characteristics was modified by other factors, the second model (M2) included socioeconomic factors (net worth, education and employment) and the third model included health conditions (obesity status, number of chronic conditions and self-rated health).
Results
Descriptive statistics
As table 1 shows, significant differences were seen among respondents with and without diabetes. As expected, respondents with diabetes experienced a significantly higher prevalence of depressive symptoms across the four waves of the study when compared with respondents without the condition.
At wave 1 there were no significant differences in age; however, in wave 2 respondents without the condition were significantly older than respondents with diabetes, but by waves 3 and 4 respondents with diabetes were significantly older than respondents without. Table 1 also shows that, with regard to gender, across the four waves of the study a higher proportion of those with diabetes were women. With regard to socioeconomic conditions, there were only significant differences in net worth at the first wave; however, in the second, third and fourth waves there were no significant differences. The χ2 analysis of education categories showed that during the first two waves of the study there were no significant differences in education between the two groups; however, during the third and fourth waves there was a significantly higher proportion without the condition with 7 or more years of studies. Across the three last waves, a higher proportion of respondents with diabetes did not work. Finally, when looking into health conditions, a significantly higher proportion of respondents with diabetes were obese and reported significantly higher number of chronic conditions and worse self-rated health across the four waves of the study.
Longitudinal relationship between diabetes and depression
Table 2 summarizes the results from the longitudinal relationship between diabetes and depression using a ‘between-within’ random-effects approach. In M1, when including only diabetes and demographic characteristics, respondents with the condition showed higher odds of clinically significant depressive symptoms (OR 1.71, p<0.00), as did respondents who developed diabetes throughout the course of the study (OR 1.32, p<0.01). This effect was modified in M2, where respondents with diabetes reported significantly higher odds (OR 1.65, p<0.000) of depressive symptoms compared with those without, but the individual change in diabetes status (within effect) did not increase these odds significantly (OR 1.23). Finally, in M3, once including other health factors to the model, respondents with diabetes did not report significantly higher odds of depressive symptoms (OR 0.88, p=0.07), nor did respondents with a change in diabetes status (OR 0.87, p=0.24).
Longitudinal relationship between diabetes and clinically significant depressive symptoms and the effect of demographic, health and socioeconomic characteristics in older adults from Mexico
This last model also shows that the demographic and socioeconomic factors associated with higher odds of clinically significant depressive symptoms longitudinally in older adults from Mexico were female gender (OR 1.92, p<0.00), not in a partnership (OR 1.72, p<0.00), lower educational achievements (OR 1.28, OR 1.55 and OR 1.10 for each education category group), a lower than average net worth (OR 1.10, p<0.00), as well as not having a job (OR 1.21, p<0.05). In the case of health characteristics, a higher than average and a change in number of chronic conditions (OR 1.33 and OR 1.24, respectively, p<0.00) and worse and a change in self-rated health (OR 4.95 and OR 2.08, respectively, p<0.00) significantly increased the likelihood of depressive symptoms.
Discussion
Individuals with diabetes have a higher prevalence of depression. However, discussions of a causal effect of diabetes on depression remain inconclusive. While some suggest diabetes as a causal mechanism, others suggest that this association is a result of common risk factors. In the current study we addressed this issue by looking into the prevalence of depression in older adults with diabetes at the four waves of the MHAS and by analyzing the relationship with a longitudinal panel.
Results from these analyses showed that respondents with diabetes reported a prevalence of between 13% and 6% higher depressive symptoms when compared with respondents without the condition. These results are similar to previous studies. In our sample the prevalence of depressive symptoms among older adults with diabetes ranged from 37% to 47%, while previous studies had estimated a prevalence of between 46% and 63%.14 Descriptive statistics also showed that a significantly higher proportion of respondents with diabetes across the four waves of the study were women, obese, reported significantly higher number of chronic conditions and worse self-rated health, and did not have a job across the four waves of the study, and that in the last two waves a lower proportion of respondents with diabetes reached 7 or more years of education. These findings are supported by previous research on depression after the age of 65 which concluded that older age, being a woman, lower educational levels, having physical illness, use of multiple drugs, as well as the existence of psychosocial stressors are risk factors for depression.8 These contextual factors are particularly relevant in Mexico, where a higher proportion of women are obese, have multiple chronic conditions but are also less well-off and have lower educational achievements.23–25 In the case of multimorbidity, a recent meta-analysis by Read et al26 concluded that the risk of depressive disorders was two to three times more likely among individuals with two or more chronic conditions. In the same way, our results show that this is true among older adults from Mexico and that not only having higher number but an increasing number of chronic conditions significantly increased the odds of depressive symptoms. In sum, respondents with diabetes showed a significantly higher prevalence of depressive symptom but also a significantly higher prevalence of risk factors for depression across the four waves of the study.
Results from the longitudinal analyses suggest that once controlling for socioeconomic and health factors, having diabetes did not significantly increase the odds of depressive symptoms. The different models show that the main drivers of the relationship between diabetes and depressive symptoms are socioeconomic and health factors, which are not exclusive to diabetes. In M1, when including only demographic characteristics, the between and within individual effects of diabetes were significantly associated with depressive symptoms, as were the average and individual effects of older age, being a woman and not being in a partnership. However, in M2, when including socioeconomic characteristics, significant differences between respondents with and without diabetes persisted, but the within-individual effect of diabetes did not. Results from this model suggest that the effect between respondents with and without diabetes could be driven by unobserved individual characteristics which were not controlled for, or that respondents with the condition are inherently different from those without the condition with regard to personality traits or experiences. With regard to the effect of socioeconomic characteristics on depressive symptoms, our results are consistent with previous studies which have suggested that cumulative economic hardship could increase chronic inflammation, which in turn would increase the prevalence of type 2 diabetes and depression,27 and thus the inclusion of these characteristics modified the findings from M1. In M3, when including the between and within effects of BMI, number of chronic conditions, and self-rated health, the significant differences seen between respondents with and without diabetes became non-significant. Going back to the results from the descriptive statistics, respondents with diabetes experienced significantly lower education, higher prevalence of obesity, chronic conditions and worse self-rated health, all of which are considered risk factors for depression in the elderly.8 Thus, our results suggest the higher prevalence of these characteristics among respondents with diabetes as the main driver of depressive symptoms longitudinally and these results agree with previous findings. Findings are not exclusive to the Mexican population; they are similar to the results from the German longitudinal study by Boehme et al,28 where using data from 3222 individuals with type 2 diabetes the authors concluded that functional health (mobility, pain and activities of daily living) and self-rated health were the best predictors of depressive symptoms. They also agree with the study by Chima et al 27 in a USA-based population which concluded that the highest rates of depression in individuals with diabetes were seen among those experiencing multimorbidity.
These results do not oppose theories on a possible common biological origin of both diabetes and depression. For example, the role of in utero fetal and maternal stress or genetic predispositions could cause dysregulation of the hypothalamic pytuitary adrenal axis and thus result in a series of chronic conditions such as diabetes, depression or cardiovascular conditions. Our results, however, emphasize that this relationship is not unique to diabetes and depression but for other conditions as well. They also suggest a possible role of chronic inflammation on depressive symptoms, as it would be expected that respondents with a higher number of chronic conditions would have higher circulating proinflammatory cytokines, which have been suggested to mediate the effect of multimorbidity on disability.29 Our findings showed that worse self-rated health and worsening self-rated health also had a significant longitudinal relationship with depressive symptoms. These results equally agree with previous findings in population surveys where lower self-rated health is associated with higher prevalence of depression in older adults from Costa Rica,30 and with a research done in clinical setting where poorer self-rated health increased the risk of long-term depression.31 However, the biochemical processes that could link self-rated health, diabetes and depressive symptoms are less studied and understood. Previous studies trying to associate self-rated health and inflammatory biomarkers have not been successful and thus should be furthered studied.32 Findings from this and previous studies suggest that prevention of diabetes-associated multimorbidity and strategies to increase self-rated health status could decrease the cross-sectional relationship between diabetes and depressive symptoms. This is important in Mexico, where the International Diabetes Federation Global Diabetes Scorecard has highlighted several deficiencies in diabetes prevention, diagnosis, treatment and medication provision, and the Organisation for Economic Co-operation and Development has criticized the high out-of-pocket expenses and inefficient availability of healthcare provision.33 34
In sum, the main finding of our study was that, even if longitudinally respondents with diabetes and respondents with a new diagnosis of diabetes showed significantly increased likelihood of having depressive symptoms, it seems that this association is related to factors that are not exclusively diabetes-related but are more frequent in the group with the condition. These results are not exclusive of the Mexican population and are supported by previous research suggesting that diabetes does not cause depression, but that depression is rather a result of many other conditions that are more prevalent among individuals with diabetes.
Our study has some limitations. There is the possibility that patients with diabetes and high levels of depressive symptoms measured by the CES-D questionnaire are not clinically depressed. Evidence suggests that when used among individuals with diabetes, the CESD score reflects more accurately diabetes-specific distress instead of clinical depression.35 Another limitation is the smaller sample of individuals with diabetes (n=1524) compared with the sample of those without (n=5368). Finally, the MHAS has only four waves, with a gap of 9 years between the 2003 and 2012 samples; some respondents may have had transitions in clinically significant depressive symptoms during that gap.
Conclusions
Older adults with diabetes have a higher prevalence of depressive symptoms compared with those without the condition. However, it seems that this relationship is a result of the higher prevalence of social and health risk factors shared by both conditions. Therefore, the effect of diabetes on the longitudinal prevalence of depressive symptoms was non-significant when considering these factors. Overall our results agree with other international studies highlighting the importance of prevention of multimorbidity and the role of socioeconomic factors, such as net worth and education, on mental health among respondents with and without diabetes. Additionally, they also highlight the effect of socioeconomic and health characteristics on the risk of depressive symptoms in women from Mexico. Further studies should focus on analyzing the biochemical mechanisms by which these socioeconomic and health characteristics increase depressive symptoms and on how healthcare policies could decrease these associations.
Acknowledgments
The MHAS (Mexican Health and Aging Study) is partly sponsored by the National Institutes of Health/National Institute on Aging in the United States and the Instituto Nacional de Estadística y Geografía (INEGI) in Mexico.
References
Footnotes
Contributors TA-C conceived of the presented idea, developed the theory, performed the computations, and drafted the discussion and conclusion. PR-R and CG-P verified the analytical process. All authors discussed the results and contributed to the final manuscript.
Funding This project was supported by a grant from the Secretaría de Educación, Ciencia, Tecnología e Innovación de la Ciudad de México CM-SECTEI/041/2020 ‘Red colaborativa de Investigación Traslacional para el Envejecimiento Saludable de la Ciudad de México (RECITES)’.
Competing interests None declared.
Patient consent for publication Not required.
Ethics approval The MHAS was approved by the institutional review boards and ethics committees of the University of Texas Medical Branch in the USA (R01AG018016, R Wong, P), the Instituto Nacional de Estadística y Geografía (INEGI), and the Instituto Nacional de Salud Pública (INSP) in Mexico. All participants gave informed consent before taking part.
Provenance and peer review Not commissioned; externally peer reviewed.
Data availability statement Data are available in a public, open access repository. All data and documentation used in this study are publicly available from the Mexican Health and Aging Study to any registered user at http://www.mhasweb.org.