Article Text

Abstract
Introduction The availability of easily accessible continuous glucose monitoring (CGM) metrics can improve glycemic control in diabetes, and they may even become a viable alternative to hemoglobin A1c (HbA1c) laboratory tests in the next years. The REALISM-T1D study (REAl-Life glucoSe Monitoring in Type 1 Diabetes) was aimed at contributing, with real-world data, to a deeper understanding of these metrics, including the time in range (TIR)–HbA1c relationship, to facilitate their adoption by diabetologists in everyday practice.
Research design and methods 70 adults affected by type 1 diabetes were monitored for 1 year by means of either flash (FGM) or real-time (rtCGM) glucose monitoring devices. Follow-up visits were performed after 90, 180 and 365 days from baseline and percentage TIR70–180 evaluated for the 90-day time period preceding each visit. HbA1c tests were also carried out in the same occasions and measured values paired with the corresponding TIR data.
Results A monovariate linear regression analysis confirms a strong correlation between TIR and HbA1c as found in previous studies, but leveraging more homogeneous data (n=146) collected in real-life conditions. Differences were determined between FGM and rtCGM devices in Pearson’s correlation (rFGM=0.703, rrtCGM=0.739), slope (β1,FGM=−11.77, β1,rtCGM=−10.74) and intercept (β0,FGM=141.19, β0,rtCGM=140.77) coefficients. Normality of residuals and homoscedasticity were successfully verified in both cases.
Conclusions Regression lines for two patient groups monitored through FGM and rtCGM devices, respectively, while confirming a linear relationship between TIR and A1c hemoglobin (A1C) in good accordance with previous studies, also show a statistically significant difference in the regression intercept, thus suggesting the need for different models tailored to device characteristics. The predictive power of A1C as a TIR estimator also deserves further investigations.
- type 1
- continuous glucose monitoring
- hemoglobin A1c
- observational study
This is an open access article distributed in accordance with the Creative Commons Attribution Non Commercial (CC BY-NC 4.0) license, which permits others to distribute, remix, adapt, build upon this work non-commercially, and license their derivative works on different terms, provided the original work is properly cited, appropriate credit is given, any changes made indicated, and the use is non-commercial. See: http://creativecommons.org/licenses/by-nc/4.0/.
Statistics from Altmetric.com
Significance of this study
What is already known about this subject?
Continuous glucose monitor (CGM)-derived metrics, like TIR70–180, are easily accessible, but users need to become more familiar with their interpretation in order to optimize clinical outcomes.
A good understanding of the relation between time in range (TIR) and the biomarker hemoglobin A1c (HbA1c), which is still the gold standard for clinical judgment on glycemic control, is crucial if TIR is to complement HbA1c or become a viable alternative to it in the next years.
What are the new findings?
Results confirm a strong linear correlation between HbA1c and TIR based on 90-day CGM data in real-life conditions, whereas quadratic contributions reported in other studies were found to be negligible.
The work revealed a statistically significant difference in the regression intercept of flash (FGM) and real-time (rtCGM) sensor data and highlighted that tailored models are likely to be required for different monitoring systems; statistical significance tests performed on the regression slope difference were instead inconclusive.
How might these results change the focus of research or clinical practice?
CGM-related metrics might provide valuable and actionable information not just for instant overview but also for long-term disease management.
Clinical judgment based on CGM metrics should also take into account differences in devices and relevant TIR–HbA1c relationships.
Introduction
Continuous glucose monitoring (CGM) has opened new horizons in diabetes care,1–3 enabling frequent measurements of blood glucose through minimally invasive techniques and wearable devices.4 5 Moreover, CGM makes available to diabetologists parameters and metrics,6 7 such as time in range (TIR), time above range, time below range and coefficient of variation, which can be leveraged in effective glucose control and might prevail over, although not replace, A1c hemoglobin (A1C) laboratory tests in the years to come.8–10 On the one hand, the adoption of the A1C biomarker has been well assessed in the usual clinical practice for quite a long time and is currently the gold standard for follow-up in metabolic control or diabetes outcomes assessment. A1C reflects hyperglycemia and its association with chronic disease complications, but unfortunately has also proven to be unsuitable for assessing daily glycemic variations11 12 and in particular determining short-term glycemic changes accurately.13 Thus, further tailored evaluations are needed when dealing with individual care and in the attempt to realize precision medicine.14 On the other hand, CGM systems are both gaining popularity and being increasingly adopted thanks to fast advances in sensor and device technology.5 15 16
TIR is a recognized key metric readily available for targeting insulin therapy day by day. Thus, it is more flexible and provides more actionable information than A1C alone. However, evidence regarding correlation with long-term glycemic control and diabetes complications is limited and will probably require years to collect. Thus, clinicians could feel more confident in targeting patients’ glucose management according to the new indicator if a strong correlation with the gold standard (A1C) was confirmed. Percentages of desirable ‘time in range’ might also be refined, depending on observed relationship with A1C values, until a reliable prediction of A1C levels is possible.
Some recent retrospective and cohort studies17–19 have focused on the existing relationships between CGM metrics and A1C to assess their correspondences and differences. Moreover, real-world observational studies are gaining regard as an additional source of information that can help in better understanding findings of clinical trials.20 21
A real-world observational study, called ‘REAl-Life glucoSe Monitoring in Type 1 Diabetes’ (REALISM-T1D), was conducted in Torino, Italy, to gain more insight on emerging CGM-enabled metrics in diabetes care and in particular the relationship between percentual time-in-range 70–180 mg/dL and A1C. The study was carried out jointly by two Italian institutions: the Department of Medical Science, University of Turin, and the Institute of Electronics, Computer and Telecommunications Engineering (IEIIT) of the National Research Council of Italy (CNR).
Research design and methods
Study design and participants
REALISM-T1D was based on real-world observations of adult patients with type 1 diabetes who did not have any previous experience with CGM; they were monitored for a full 12-month period in their daily life through commercial CGM devices. The study involved a single diabetes care center at ‘Le Molinette’ hospital in Torino, which is not devoted to the treatment of young (under 18) patients with diabetes as they are addressed to different facilities. Every year about 100 real-time (rtCGM) and flash (FGM) sensors are prescribed for the first time to adults with type 1 and type 2 diabetes who refer to the center, while about 4000 patients are currently receiving follow-up visits and treatment.
A total of 70 adult patients of Caucasian race with type 1 diabetes participated in the study. In particular, 94 individuals aged 20–60 were screened, who turned to the center for the first time in a 12-month time period (between April 1, 2017 and March 31, 2018) and did not have previous experience with CGM. Eleven did not qualify, while 13 did not consent to participate. Eventually, 70 patients were enrolled depending on their voluntary informed consensus to be included in the investigation, with a mean age of 40.4±12.9 years (range 20–60), disease duration of 21.6±14.0 years (range 1–54), body mass index (BMI) of 24.8±3.5 kg/m2 and A1C of 7.6%±1.0% (60±10 mmol/mol). To grant personal data protection, pseudonymization was used and transcoding tables were stored in a single protected server of the care center. In the selection, no constraint was imposed on the metabolic compensation in terms of A1C at the baseline and stable complications. Instead, the only reasons for exclusion were the presence of severe complications at an advanced stage, uncompensated psychiatric disorders, and dangerous societal problems sometimes encountered in a negligible minority of the center patients. Differently from randomized controlled trials, there was no need for a control group equipped with blinded devices, while inclusion/exclusion criteria, such as patients already at the target with A1C under 7% (53 mmol/mol), could be avoided.
Patients were first given instructions about the use of the prescribed devices and the procedures to calibrate their sensors and upload CGM data (in the case they were requested to do so themselves, in particular with rtCGM sensors) during a preliminary visit and a subsequent 2-week training, and then CGM was started and data seamlessly collected for a full 1-year time period. As the study was purely observational by design, participation had no influence on the behavior and decision of the care team and patients were let free to manage their devices in their everyday glucose monitoring. Insulin therapies, however, resulted evenly distributed between multiple daily injections and insulin pumps.
Three follow-up visits were planned at 90, 180, and 365 days from the beginning of the monitoring activity, and on those occasions A1C laboratory tests were also performed based on the high-performance liquid chromatography (HPLC) ion-exchange chromatography method. Sensor data were uploaded to the relevant websites by either the patients themselves at home or the center physicians during the follow-up visits. Observations were successfully completed at the end of March 2019 for 59 patients out of the 70 belonging to the initial pool. The group at the end of the study consisted of patients with a mean age of 41.4±13.1 years (range 21–61), disease duration of 22.6±14.3 years (range 2–55), BMI of 24.2±3.8 kg/m2 and A1C of 7.2%±0.9% (55±10 mmol/mol). The 11 dropouts were caused by patients not reporting sensor faults promptly (two cases), incorrect sensor management for more than 30% of the monitoring timeframe (seven cases) and patients moving to a different region and care center (two cases).
Only commercial monitoring devices whose cost is repayable by the Italian National Health System were considered in the study; they belong to two rough different sets characterized by either a 300 s (rtCGM) or 900 s (FGM) sampling period. The FGM set consists of Abbott Freestyle Libre sensors, while the rtCGM group includes Dexcom G4 Platinum, Dexcom G5 Mobile and Medtronic Guardian devices. Each set was assigned to half of the study group according to the center physicians’ customary recommendations. Current Italian Standards of Care for Diabetes Management strongly recommend rtCGM for patients with type 1 diabetes and poor glycemic control, especially if hypoglycemia unawareness as well as severe or nocturnal hypoglycemic episodes are present. The latest update also includes specific recommendations of FGM for people with type 1 diabetes whose metabolic control is already adequate but are struggling with frequent glucose testing. When REALISM-T1D started, we did not have specific indications for prescribing FGM with respect to rtCGM. Several elements were then taken into account, including the estimate of individuals’ reliability to perform calibrations, their tolerance toward alarms, the interest for future integrated functions of those wearing insulin pumps, and finally patients’ own preferences.
Data collection and statistical analysis
At the end of the observation period all (heterogeneous) raw sensor data were collected from the relevant online repositories (Abbott Libreview, Dexcom Clarity and Glooko-Diasend) and preprocessed to exclude those timeframes where the actual use of the CGM sensor was less than 70%,22 harmonize the data formats, and normalize timestamps with respect to the starting time of monitoring,23 so as to make subsequent computer-aided analyses easier. This means that the computation of any time point took, respectively, 6000 (FGM) and 18 000 (rtCGM) raw sensor data at least. Overall, roughly 6.5 million glucose values were analyzed and processed.
Only continuously stored values were used for FGM sensors, that is, intermittently scanned data were not considered in the study.24 Moreover, individuals were constantly reminded and monitored to perform calibrations as specified in the device manufacturer’s instructions. Data processing and statistical computation were performed at CNR-IEIIT by means of the GNU Octave scientific programming tool. Although 14 days of CGM data are often considered a good estimation of metrics in a 3-month period,6 22 the TIR percentage was computed using the full 90-day timeframe data to improve both the accuracy and robustness of measurements and reduce noise sensitivity in data acquisition.
In order to quantify the relationship between A1C and TIR, a linear monovariate regression was conducted on the experimental data set (n=146 data points) by means of the ordinary least squares (OLS) method, using A1C as predictor and TIR as response variable. On average, each individual contributed 2.5 data points, as 31 measurements out of 177 were discarded because they did not satisfy the ‘70% CGM use’ requirement. The choice of adopting A1C as predictor and TIR as response variable was made because, for general relationship assessment, A1C values were considered to be reference data, whereas TIR values were subject to measurement noise, which should contribute to the residual OLS variance. This also facilitates the comparison with the results presented in Vigersky and McMahon,17 although variables may be swapped, as was done in Bergenstal et al25 where the specific aim is to predict A1C given TIR. For the purpose of the study, TIR percentage calculations were based on an in-range glycemic interval of 70–180 mg/dL, according to recent international consensus of Advanced Technologies & Treatments of Diabetes (ATTD) experts.6 The normality of the residuals and the homogeneity of their variance (homoscedasticity) assumptions were also tested in two alternative ways each. Furthermore, the possible presence of a quadratic component in the regression was assessed by means of a second-degree polynomial OLS. Finally, regression analyses were performed separately for the patient subgroups monitored through either FGM or rtCGM devices, respectively, to assess whether there are statistically significant differences between the two device groups. Statistical significance was evaluated by means of a multivariate OLS analysis with categorical/interaction variables.
Results
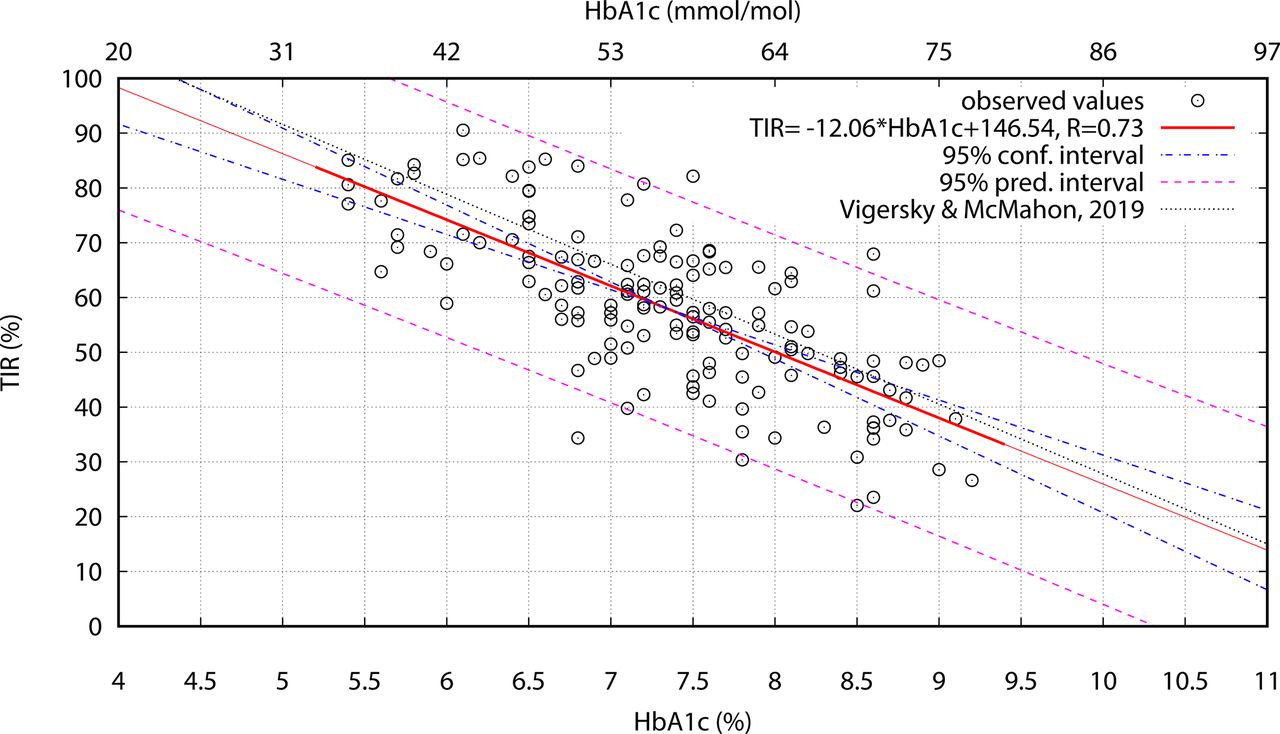
Figure 1 depicts the sample data (‘°’ markers) and the best-fit regression line. The solid line refers to the interpolation interval from the minimum A1C=5.6% (38 mmol/mol) to the maximum A1C=9.2% (77 mmol/mol) observed values. The dot-dashed lines represent the 95% CI of the best fit, while the dashed lines delimit the 95% prediction interval. These two intervals are both important because of their two distinct meanings:
The CI demarcates the region in which the true regression line resides, with a given degree of confidence, and therefore conveys information about the accuracy of the adopted model.
The prediction interval is the region around an estimated value that contains the corresponding true value with a given degree of confidence. Hence, it expresses the predictive power of the model.

OLS linear regression with 95% confidence and prediction intervals on the whole data set (n=146), compared with Vigersky and McMahon.17 β1=−12.06±1.86, p<0.001; β0=146.54±13.83, p<0.001; r2=0.53. HbA1c, hemoglobin A1c; OLS, ordinary least squares; TIR, time in range.
Moreover, the prediction interval considers the residual variance by definition, whereas the CI does not. As a consequence, the prediction interval width also depends, for instance, on the noise introduced by the way the predictor and response variable are measured. This noise may be considered an inherent property of the measurement method, which is therefore independent of the model itself.
The regression coefficients are shown in the figure, while online supplemental appendix tables 1 and 2 list the data sets used in the analysis and the TIR values predicted with the regression separately for the FGM and rtCGM subgroups, besides the experimental observations. The regression points out a strong correlation (r=0.73, r2=0.53) between the predictor and the response variable.
Supplemental material
To validate the linear regression model from the mathematical point of view, further tests were conducted to confirm two crucial assumptions, namely the normality of the residuals and the homogeneity of their variance (homoscedasticity). The normality of the residual was successfully confirmed with two distinct methods:
The quartile-quartile (Q-Q) plot of the distribution of the residuals, normalized with respect to their estimated variance based on the sample data, versus a normal distribution with zero mean and unity variance, is shown in figure 2A. It reveals an extremely good agreement between the two distributions with only a small number (<5) of outliers at the extremes.
The Anderson-Darling normality test.26 The result of this test, A2=0.19, is well below the critical value, even at a significance level of 10% (A20.1=0.63). In addition, the p value corresponding to the obtained A2 is 0.900,27 thus giving no reasons to reject the null hypothesis of normality. The Anderson-Darling test was preferred to other, more traditional tests (like the Kolmogorov-Smirnov test) because it is specific to the normal distribution, is independent from the distribution variance, and was found to be very effective in detecting deviations from normality,28 and also because it is sensitive to the tails of the distribution under test.

Q-Q plot of normalized residuals versus a normal distribution (µ=0, σ2=1) (A), scatter plot of the residuals (B), and comparison between a linear and a quadratic OLS regression (C). HbA1c, hemoglobin A1c; LR, linear regression; OLS, ordinary least squares; Q-Q, quartile-quartile; TIR, time in range.
Similarly, the homogeneity of the variances of the residuals was also verified in two distinct ways, one graphical and one analytical:
The scatter plot of the residuals in figure 2B shows that the residuals are contained in the horizontal band ±25, except for three outliers, and there is no visible dependency on the A1C value in abscissa.
A standard Goldfeld-Quandt test29 was performed by sorting the sample points by increasing values of the predictor and dividing them into three bands. The central band comprising one-third of the samples was then discarded, and two distinct, auxiliary linear regressions were conducted on the remaining two bands. The two sample variances of the residuals s2L=104.400 (lower band, 49 samples) and s2H=104.488 (higher band, 49 samples) were then compared with an F-test of equality of variances with (47, 47) df, obtaining F=0.999. The corresponding two-tailed p value, p=0.997, strongly suggests accepting the null hypothesis that the two variances of the residuals are equal.
Another implicit, but equally important hypothesis of linear regression is that the underlying relationship being investigated is indeed linear. In our case, this hypothesis is corroborated by two factors:
The empirical observation of the scatter plot of the sample data set (figure 1).
The uniformity of variances (figure 2B and Goldfeld-Quandt test) at the extremes of the predictor range, which is in general unlikely to occur when a non-linear phenomenon is subject to a linear fit.
However, although in the literature some authors advocate a linear relationship,17 18 a recent work suggests the presence of a quadratic component.19 Therefore, as a further check, we performed an OLS quadratic regression on our sample data. As depicted in figure 2C, which contrasts the two regressions, we noted that in the quadratic regression the magnitude of the quadratic coefficient β2=–0.31 is negligible because it is more than one order of magnitude smaller than the linear coefficient β1=–7.56. Moreover, the introduction of the quadratic term did not improve r2 in any significant way, and just brought it from r2=0.5303 to r2=0.5307. We can then conclude that, at least for the study data set, the unexplained variance does not depend on the use of a linear model instead of a quadratic one.
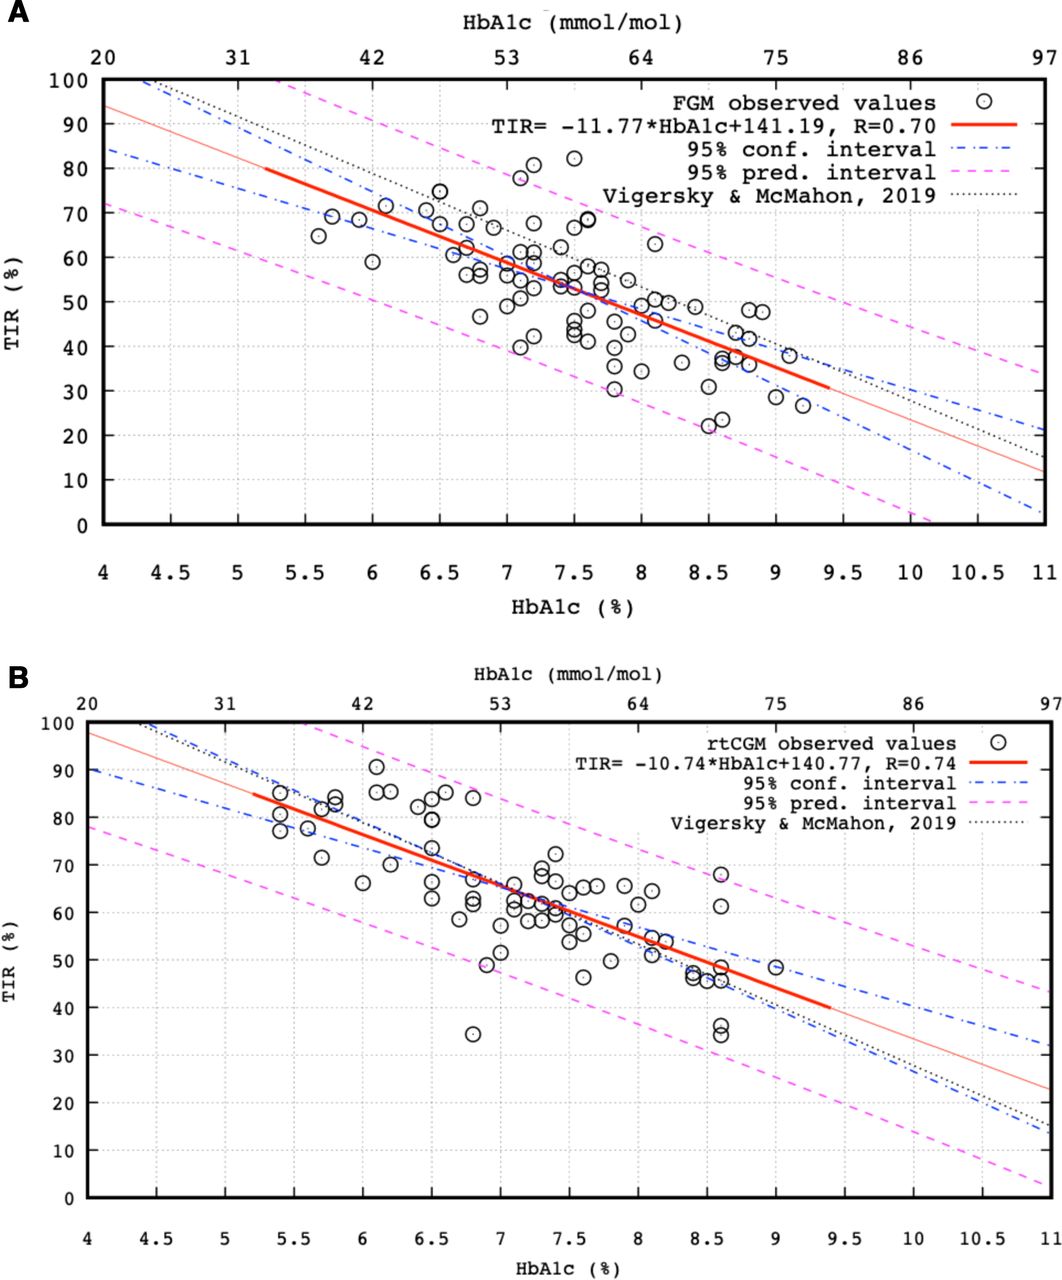
As discussed in the previous section, the TIR of the data set under analysis was computed from measurements taken by two kinds of devices (FGM and rtCGM), which sample the patient’s glucose level every 900 s (and contributed n=78 data points) and 300 s (n=68 data points), respectively. To get insights on possible differences between them, two separate linear regressions were performed on the two subsets. The results are presented in figure 3A,B, while sample data are available for reference in online supplemental appendix tables 1 and 2.

Linear regressions performed separately on patient groups monitored with different device types (FGM or rtCGM) and different sampling periods (900 s or 300 s) compared with Vigersky and McMahon.17 (A) FGM group: β1=−11.77±2.73, p<0.001; β0=141.19±20.6, p<0.001; r2=0.49. (B) rtCGM group: β1=−10.74±2.4, p<0.001; β0=140.77±17.35, p<0.001; r2=0.55. CGM, continuous glucose monitoring; FGM, flash CGM; HbA1c, hemoglobin A1c; rtCGM, real-time CGM; TIR, time in range.
The two most important observations concerning this last part of the analysis are the following:
The r2 obtained when considering the first subset of devices (rtCGM with 300 s sampling interval) is marginally better than the one obtained from the data set as a whole, 0.55 vs 0.53, and the regression line exhibits a better agreement with the results of Vigersky and McMahon.17
Restricting the analysis to data collected from devices with a 900 s sampling interval (FGM devices) results instead in a deterioration of r2, from 0.53 to 0.49, as well as a departure from the results of Vigersky and McMahon.17
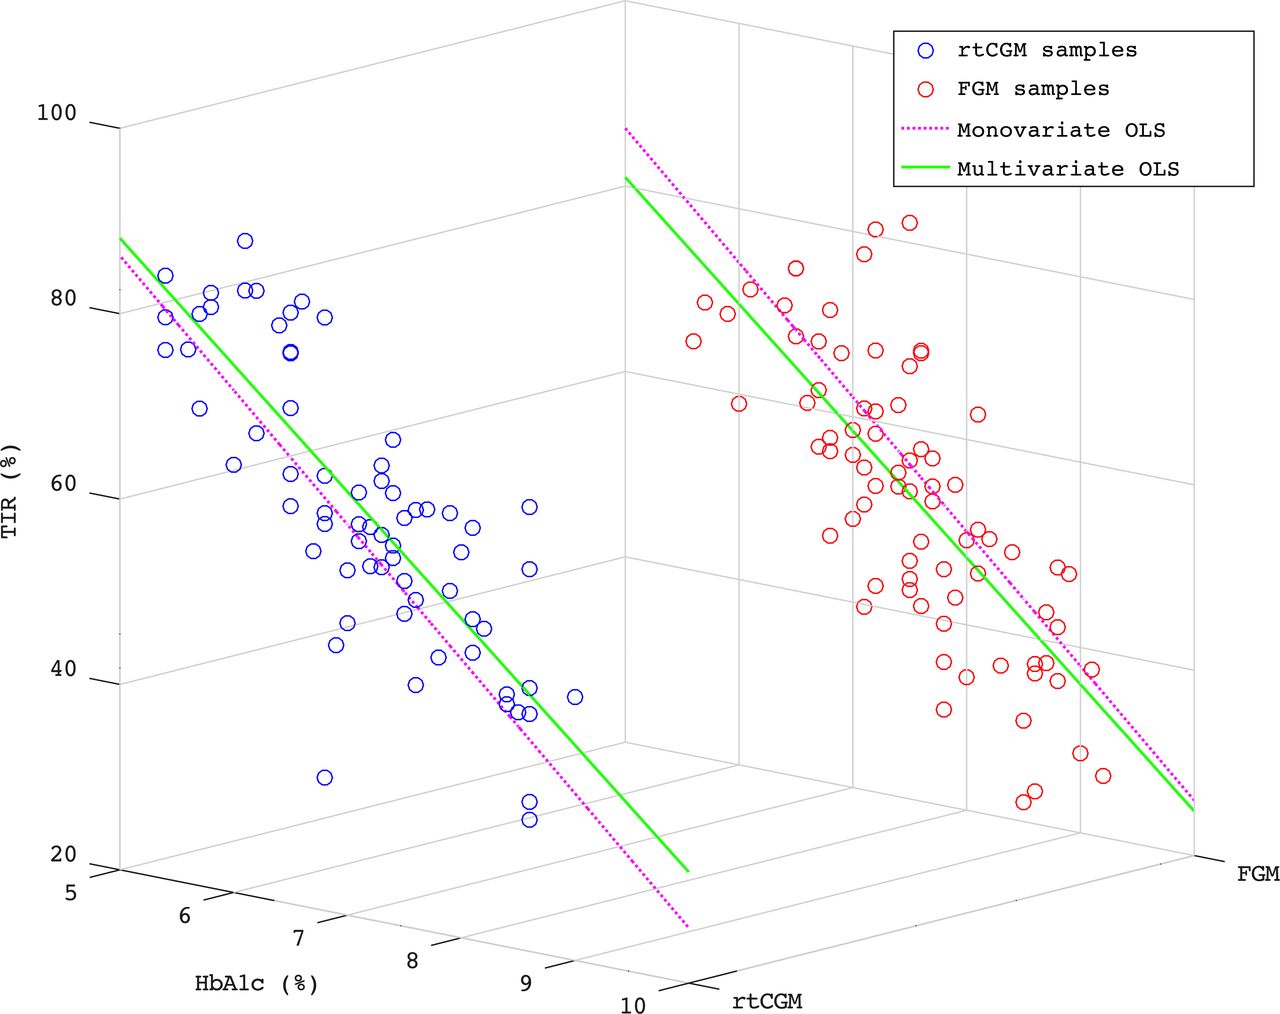
The statistical significance of the observed difference was tested by means of a multivariate OLS on all samples (from both rtCGM and FGM devices) in which, besides A1C, a dichotomous categorical variable c (0 for rtCGM and 1 for FGM samples) and an interaction variable d=A1C·c were introduced.30 The coefficients of c and d quantify the intercept and slope difference, respectively, while their two-tailed p values indicate whether the difference is significant or not. The results (p<0.001 for c and p=0.57 for d) show that there is a statistically significant difference between the intercepts, given by c’s coefficient βc=–7.19, but not between the slopes. Furthermore, the introduction of c increased r2 from 0.53 to 0.59 and decreased the sample variance of the residuals from s2NC=102.335 to s2C=89.921. An F-test of equality of these variances with (144, 143) df gave F=1.135 and a two-tailed p=0.22. Figure 4 illustrates graphically how the introduction of c (on the y axis) affected the regression and improved the fit of TIR (z axis) as a function of A1C (x axis).

Monovariate versus multivariate regression using a categorical variable c to indicate FGM or rtCGM devices. Categorical coefficient βc=−7.19±3.20, p<0.001. CGM, continuous glucose monitoring; FGM, flash CGM; HbA1c, hemoglobin A1c; OLS, ordinary least squares; rtCGM, real-time CGM; TIR, time in range.
Conclusions
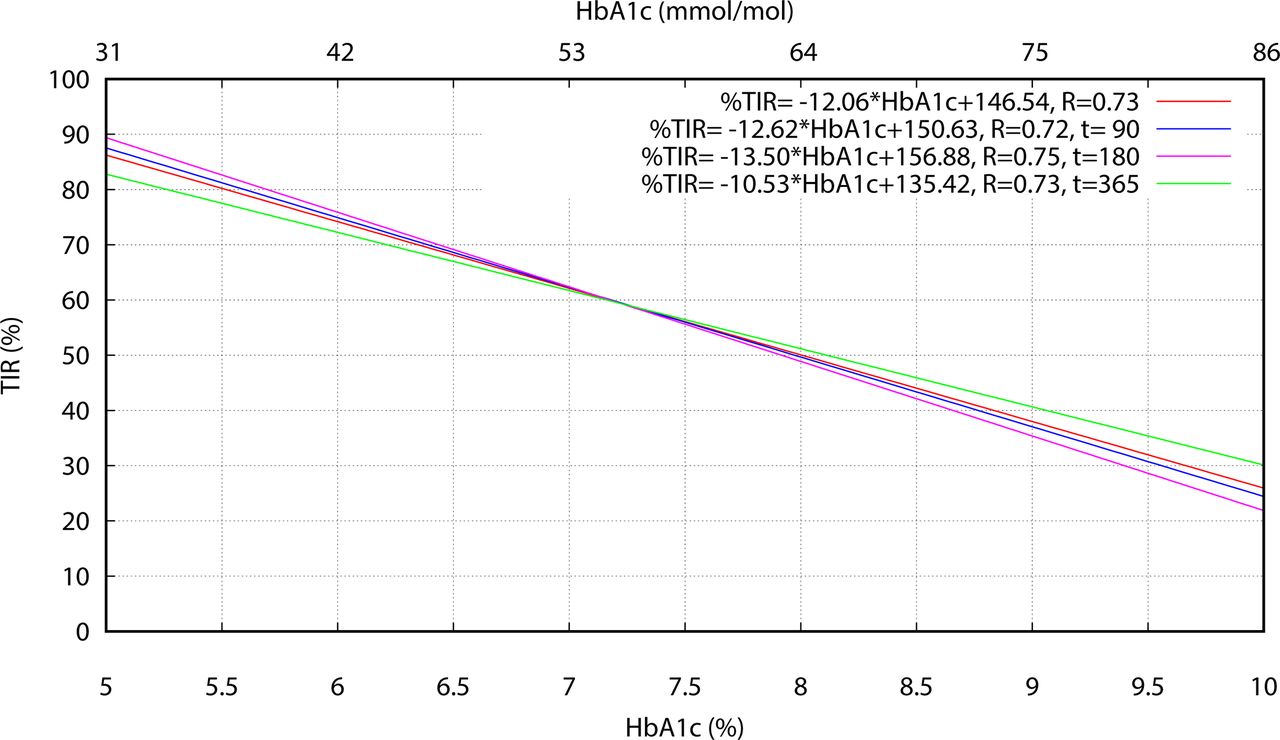
The careful assessment of the TIR–A1C relationship in real-life conditions is important for diabetologists to gain confidence and rely on this and other CGM-derived metrics in their usual practice. Differently from other works based on randomized studies, such as Vigersky and McMahon,17 Beck et al,18 and Petersson et al,19 our investigations were based on pure 1-year observations of 70 patients with type 1 diabetes adopting CGM in their everyday routine. TIR percentages were evaluated directly from the raw sensor data over long (90 days) periods of at least 70% CGM use, as opposite to average values derived from larger populations but in more heterogeneous conditions, including for instance both type 1 and type 2 diabetes, juvenile and/or adult patients, blood glucose monitoring, and different and shorter CGM durations (eg, from 7 to 84 days in Vigersky and McMahon,17 6 months in Beck et al,18 and 60 days in Petersson et al19) and registration times. Results obtained in this way confirm a linear relationship between TIR and A1C as quadratic contributions, unlike in Petersson et al,19 were found to be negligible. Values of the regression slope and intercept obtained for the whole data set are similar to results from Vigersky and McMahon,17 with a slightly weaker correlation in our case. This can be partially justified considering that Vigersky and McMahon17 sourced selected paired (hemoglobin A1c, TIR) metrics from multiple articles. Hence, the averaging process used in those articles to calculate the paired metrics may have had a damping effect on the residual variance of the subsequent linear regression analysis, with respect to the direct use of the original, more dispersed data points. As each REALISM-T1D individual contributed to the study with 2.5 data points, on average, distinct linear regressions were also computed separately using points collected at t=90, t=180 and t=365, respectively (where each individual contributed a single point), to investigate possible correlation effects in the pooled analysis. Results reported in figure 5 show that differences in the 6%–9% A1C range are quite limited for the three time-instants considered and compatible with typical individual glucose variations over a 90-day time interval, while r always remains greater than 0.72. Consequently, the pooled analysis does not seem to be affected by correlation problems due to multiple point contributions by the same individual.
Linear regressions performed separately at time points t=90 days, t=180 days and t=365 days using both FGM and rtCGM sensor data. CGM, continuous glucose monitoring; FGM, flash CGM; HbA1c, hemoglobin A1c; rtCGM, real-time CGM; TIR, time in range.
More evident differences exist between patients who were prescribed either an FGM or rtCGM sensor. In the first case, the computed regression coefficients are still close to those presented in Vigersky and McMahon,17 although r is lower. When rtCGM devices are considered, instead, the distance of β1 and β0 with respect to Vigersky and McMahon17 increases, but r improves. This difference in behavior also becomes evident by comparing figure 3A,B. In our opinion this may be due to the heterogeneity of conditions and devices in Vigersky and McMahon17 and partly in figure 3A, which tends to mask diversities in the overall regression computation. Differences become clearer when homogeneous groups are considered, such as in figure 3A,B. This also stresses the need for the availability of more data and investigations if TIR and other CGM-related metrics have to be massively adopted in routine practice, since a set of ‘good for all’ parameters values, such as for the joint FGM and rtCGM group, can hardly meet individual patient conditions.
In fact, a 0.5% decrease in A1C, from 7.5% (58 mmol/mol) to 7.0% (53 mmol/mol), means an improvement of the predicted TIR percentage from 52.9% to 58.8% for the FGM group and from 60.2% to 65.6% for the rtCGM group. Although the absolute variation is similar (5.9% vs 5.4%), the impact is significantly different in the two situations because of the role played by the corresponding values of β1 and β0, which match the same A1C value with higher TIR percentages for the rtCGM group than for FGM. The unavailability of CGM (TIR) data at baseline cannot exclude for sure that this discrepancy might be caused by some bias effect in the study, despite no appreciable differences existing in the two groups concerning anthropometry and therapy. An additional check carried out in the regression analysis by dropping two sensor-sampled data out of three in the rtCGM case (thus simulating a lower sampling rate equal to the FGM sensors) resulted in no appreciable changes in the computed TIR values and consequently in the regression coefficients. Other reasons, possibly deserving more investigations, are differences in sensor technology and patient-induced behavior. Actually, the FGM sensors used in the study are unable to generate alerts and alarms for hypoglycemia and hyperglycemia, likely requiring more attention and intervention by patients, thus justifying slower reaction times, which ultimately can result in a reduction in the overall time spent in the 70–180 mg/dL range.
The power of A1C as a predictor of TIR is another aspect of utmost interest and, to some extent, concern. The rather large prediction interval boundaries depicted in figure 3A show that even in the central zone around A1C=7.5% (58 mmol/mol), where the uncertainty of the predicted TIR=56% is the smallest, the true TIR value can actually vary from 34% to 78%. It is worth noting that these figures are in good accordance with those reported in Beck et al,18 where a CI of 38 to 79 was established for a TIR predicted value equal to 59%. When FGM and rtCGM groups are considered, the predicted values for A1C=7.5% (58 mmol/mol) are TIR=54% and TIR=60%, respectively, while the prediction interval is 33–73 in the former case and 42–78 in the latter, which imply a maximum relative difference between true and estimated values of about 37% for FGM and 30% for rtCGM. In turn, this highlights possible limitations of A1C in predicting the TIR percentage accurately and confirms the opportunity of having different models for different patient groups as suggested by some authors,31 as well as for FGM versus rtCGM devices, due to the statistically significant difference between their OLS regression models.
Acknowledgments
The University of Torino and the Division of Endocrinology and Metabolic Diseases at Azienda Ospedaliera Universitaria Città della Salute e della Scienza di Torino supported the observation, monitoring and follow-up of patients in this study. All CGM devices used in the study were prescribed and reimbursed by the Italian National Health System. The Institute of Electronics, Information and Telecommunication Engineering of the National Research Council of Italy supported the data processing and analysis. All institutions evenly supported the writing of the manuscript.
References
Supplementary materials
Supplementary Data
This web only file has been produced by the BMJ Publishing Group from an electronic file supplied by the author(s) and has not been edited for content.
Footnotes
Contributors MV and GG designed the study and took care of patient follow-up and also supervised all visits. ICB and AV performed the relevant data processing and statistical analysis. All authors contributed significantly to the writing and editing process of this manuscript. GG is the guarantor of this work and as such had full access to all the data in the study and takes responsibility for the integrity of the data and the accuracy of the data analysis.
Funding The authors have not declared a specific grant for this research from any funding agency in the public, commercial or not-for-profit sectors.
Competing interests None declared.
Patient consent for publication Not required.
Ethics approval All procedures performed in this study involving human participants were in accordance with the authors’ institutions’ ethical recommendations and with the 1964 Helsinki Declaration and its later amendments.
Provenance and peer review Not commissioned; externally peer reviewed.
Data availability statement All data relevant to the study are included in the article or uploaded as supplemental information.
Supplemental material This content has been supplied by the author(s). It has not been vetted by BMJ Publishing Group Limited (BMJ) and may not have been peer-reviewed. Any opinions or recommendations discussed are solely those of the author(s) and are not endorsed by BMJ. BMJ disclaims all liability and responsibility arising from any reliance placed on the content. Where the content includes any translated material, BMJ does not warrant the accuracy and reliability of the translations (including but not limited to local regulations, clinical guidelines, terminology, drug names and drug dosages), and is not responsible for any error and/or omissions arising from translation and adaptation or otherwise.