Article Text

Abstract
Introduction Respective alterations in resting-state brain neural activity and cerebral blood flow (CBF) in type 2 diabetes mellitus (T2DM) have been reported. However, their coupling alteration in T2DM remains largely unknown.
Research design and methods Twenty-seven patients with T2DM aged 40–67 years and 36 well-matched healthy controls (HCs) underwent resting-state functional MRI (rs-fMRI) and arterial spin labeling (ASL) scans at two time points with a 5-year interval. Regional homogeneity (ReHo) and CBF were calculated from rs-fMRI and ASL, respectively. The standardized ReHo:CBF ratio (mReHo:mCBF ratio), the spontaneous neuronal activity per unit CBF supply, was compared between the two time points. Relationships between the mReHo:mCBF ratio and memory performance were analyzed.
Results Over 5 years, decreased mReHo:mCBF ratios in patients with T2DM were mainly distributed in four regions, among which the left insula exhibited more severely decreased mReHo:mCBF ratio in patients with T2DM than in HCs, while the left postcentral gyrus, the right Rolandic operculum, and the right precentral gyrus showed no significant intergroup difference. Correlations between the mReHo:mCBF ratio and memory performance were also found in patients with T2DM.
Conclusions This study suggests that T2DM may accelerate neurovascular coupling impairment in specific brain regions (the left insula), contributing to memory decline. This study implies that the mReHo:mCBF ratio is a potential imaging marker for detecting neurovascular changes.
- diabetes mellitus
- type 2
- cognitive neuroscience
- central nervous system
- magnetic resonance imaging
This is an open access article distributed in accordance with the Creative Commons Attribution Non Commercial (CC BY-NC 4.0) license, which permits others to distribute, remix, adapt, build upon this work non-commercially, and license their derivative works on different terms, provided the original work is properly cited, appropriate credit is given, any changes made indicated, and the use is non-commercial. See: http://creativecommons.org/licenses/by-nc/4.0/.
Statistics from Altmetric.com
Significance of this study
What is already known about this subject?
Respective alterations in resting-state brain neural activity and cerebral blood flow (CBF) in type 2 diabetes mellitus (T2DM) have been reported.
What are the new findings?
For the first time in this study, we combined regional homogeneity (ReHo) and CBF and found longitudinal alterations in regional neurovascular coupling (NVC) in patients with T2DM.
The longitudinal decline of mReHo:mCBF ratio in patients with type 2 diabetes was mainly distributed in the left insula, the left postcentral gyrus, the right Rolandic operculum, and the right precentral gyrus.
More severely decreased mReHo:mCBF ratio in the left insula was found in patients with T2DM than in healthy controls, with no significant intergroup difference in other regions.
Correlations between the mReHo:mCBF ratio and memory performance were found.
How might these results change the focus of research or clinical practice?
This study suggests that T2DM may accelerate NVC impairment in specific brain regions (the left insula), contributing to memory decline.
This study implies that standardized ReHo:CBF ratio (mReHo:mCBF ratio) is a potential imaging marker for detecting neurovascular changes.
Introduction
Type 2 diabetes mellitus (T2DM) may accelerate brain aging and is associated with a higher prevalence of cognitive impairments and increased risk of dementia.1 The underlying mechanisms of the relationship between T2DM and cognitive impairments are still not fully understood. Findings from many studies have shown disturbed brain neuronal activity and altered cerebral blood flow (CBF) in patients with T2DM,2 suggesting that neurodegenerative and cerebrovascular changes may play a role.
In recent years, the concept of neurovascular units has been proposed, emphasizing the importance of neurons and blood vessels as a whole in maintaining normal brain and cognitive functions.3 Normally, the cerebral microcirculation system responds to neural function changes by regulating blood flow, ensuring the neurons’ energy supply, and maintaining normal function.4 Sustained hyperglycemia in diabetes can cause neuronal and vascular damage through neuroinflammatory and oxidative stress reactions, disrupting normal neurovascular coupling (NVC) relationships, ultimately leading to cognitive impairment.5 Recent studies in both human6 and animals7 8 have shown that alterations in the integrated neurovascular unit, but not neural activity changes or vascular injuries, lead to reduced neuronal function. Therefore, when exploring underlying neural mechanisms of diabetes-related cognitive changes, we should pay more attention to NVC changes than solely brain activity or CBF. However, most traditional studies on T2DM focus on either brain activity or CBF, ignoring the integrity of the coupling between the two.
Regional homogeneity (ReHo) is used to measure the neural synchronization based on blood oxygen level dependent (BOLD) signals from resting-state functional MRI (rs-fMRI) and indirectly reflects local spontaneous neuronal activity. ReHo studies found that abnormal brain activities in patients with T2DM are distributed in multiple brain regions.9–12 CBF from arterial spin labeling (ASL) is used to assess the cerebral blood supply. In ASL, arterial blood water molecules are used as an endogenous tracer and magnetically labeled proximal to the area of interest. After they flow into the imaging layer, the control imaging information and the labeled imaging information are subtracted to obtain the brain tissue blood perfusion image.13 Results of ASL study in T2DM are controversial with mixed changing patterns.2 14–16 Normally, brain activity and CBF are closely correlated, which is called NVC.17 Quantitative fMRI with combined BOLD/ASL has been used to investigate abnormal NVC in several pathological conditions, including schizophrenia and Alzheimer’s disease.18 19 It may address questions that cannot be fully answered with either BOLD or ASL measures alone. As of now, there is only one cross-sectional study that reported NVC abnormalities in patients with T2DM by analyzing correlations between degree centrality maps and CBF maps and between the amplitude of low-frequency fluctuation maps and CBF maps.20 However, related longitudinal studies are lacking.
Here we combined BOLD and ASL measures for the first time to assess the standardized ReHo:CBF ratio (ReHo:CBF ratio) in reflecting regional NVC in patients with T2DM and individuals with diabetes over a 5-year follow-up using a longitudinal design. We aimed to investigate whether and how regional NVC changed in patients with T2DM over 5 years and whether these longitudinal changes also exist in exactly matched individuals without diabetes. Considering that memory dysfunctions are commonly reported in patients with T2DM,21 we also analyzed the relationship between NVC and memory performance. Based on previous research results showing that neurovascular changes are closely related with neurodegenerations in both normal aging and disease states,22 23 and that T2DM accelerates brain aging, we hypothesized that (1) local NVC changes would exist in patients with T2DM over the 5 years; (2) some of these changes are specific to diabetes, while others are also in the normal aging process of people without diabetes; and (3) the ReHo:CBF ratio would be associated with memory performance and blood glucose level.
Research design and methods
Subjects
Written informed consent was obtained from each participant before the experiments.
Sixty patients with T2DM were selected from the Tianjin Medical University General Hospital using the following criteria: (1) clinically diagnosed with T2DM according to the 2010 criteria of the American Diabetes Association24; (2) aged 40–67; and (3) right-handed. Exclusion criteria included (1) Mini-Mental State Examination (MMSE) score <27; (2) any psychiatric or neurological disorders that could influence cognitive function; (3) cerebrovascular accidents (such as cerebral hemorrhage and stroke); (4) T2DM-related complications (including diabetic retinopathy, diabetic nephropathy, and diabetic foot); (5) frequent or recent serious hypoglycemic events; (6) self-reported history of alcohol or substance abuse; and (7) family history of dementia, hypertension or hyperlipidemia. Sixty age-matched, gender-matched, and education-matched, right-handed healthy control (HC) subjects were recruited as controls from the local community. The HCs were euglycemic, and their exclusion criteria are the same as for patients with T2DM. All 60 patients and 60 HCs underwent a battery of laboratory examinations, neuropsychological tests, and MRI examinations at baseline. Thirty patients with T2DM and 38 HCs participated in the 5-year follow-up visit. Reasons for no follow-up included refusal (n=24), unable to contact (n=22) and surgical metal implants (n=6). Five subjects were excluded due to marked artifacts or head motions of more than 2.0 mm or 2.0° on MRI. Finally, 27 patients with T2DM and 36 HCs were eligible.
Clinical data and neuropsychological assessments
Data on weight and height were obtained by measurements on the spot. Body mass index (BMI) was calculated as weight in kilograms divided by the square of height in meters. Blood pressure (BP) was measured three times in a sitting position and averaged. Medical history and medication use were acquired from medical records, questionnaires, and interviews. Blood samples were collected by venipuncture after overnight fasting at least 10 hours to test the level of fasting blood glucose (FBG), triglycerides (TG), total cholesterol (TC), low-density lipoprotein cholesterol (LDL), high-density lipoprotein cholesterol (HDL), and glycated hemoglobin (HbA1c). The presence of retinopathy, peripheral neuropathy, and nephropathy was ascertained by direct ophthalmoscopy, clinical examination, and microalbuminuria test.
The memory status of the participants was evaluated on the day of the MRI scan. General cognitive status was evaluated by the MMSE.25 Anxiety and depression were evaluated by the Self-Rating Anxiety Scale26 and Self-Rating Depressive Scale,27 respectively. Short-term and long-term memory were evaluated by the Auditory Verbal Learning Test (AVLT).28 Working memory was evaluated by the forward and backward digit span test.29
Methods used for baseline and follow-up measurements were identical.
MRI data acquisition
MRI scanning was performed on a 3.0-Tesla scanner (Discovery MR750, General Electric, Milwaukee, Milwaukee, USA) with a standard eight-channel head coil. Routine T2-weighted images were acquired to exclude participants with visible brain lesions.
Sagittal, three-dimensional, T1-weighted images were acquired using a brain volume sequence with the following parameters: repetition time (TR) =8.2 ms, echo time (TE) =3.2 ms, inversion time=450 ms, flip angle (FA) =12°, field of view (FOV) =256 mm×256 mm, matrix=256×256, slice thickness=1 mm, no gap, and 188 sagittal slices.
Resting BOLD-fMRI data were acquired using a gradient-echo, single-shot, echo-planar imaging sequence with the following parameters: TR=2000 ms, TE=45 ms, FA=90°, FOV=220 mm×220 mm, matrix=64×64, 32 axial slices (slice thickness=4 mm, slice gap=0.5 mm), and 180 volumes.
Resting CBF was acquired with a pseudo-continuous ASL sequence with a three-dimensional, fast spin-echo acquisition and background suppression with the following parameters: TR=4886 ms, TE=10.5 ms, FA=90°, FOV=240 mm×240 mm, reconstruction matrix=128×128, 40 axial slices, slice thickness=4 mm, no gap, and number of excitation=3.
Sequences and parameters used for baseline and follow-up MRI scans were identical.
Data preprocessing
The processing of resting BOLD fMRI data was performed using the Data Processing Assistant for Resting-State fMRI (DPARSF),30 which is based on Statistical Parametric Mapping (SPM; http://www.fil.ion.ucl.ac.uk/spm) and the toolbox for Data Processing & Analysis of Brain Imaging.31 The main procedures included the following: (1) removing the first 10 time points (for signal equilibrium and participants’ adaptation to their immediate environment); (2) slice timing; (3) realigning (for head motion correction): participants with head motion exceeding 2.0 mm or 2.0° in any dimension throughout the course of scans were excluded from further analysis; (4) normalization: images were spatially normalized to Montreal Neurological Institute (MNI) template (using the Diffeomorphic Anatomical Registration Through Exponentiated Liealgebra (DARTEL)32 method, resampling voxel size=3×3×3 mm3); (5) detrend: linear trend of the time series was removed; (6) nuisance covariates regression, motion parameters, white matter, and cerebrospinal fluid signals were regressed out in order to control the potential impact of physiological artifacts (head motion was regressed using Friston 24-parameter model); (7) 0.01–0.08 Hz band-pass filter (for reducing the effects of low-frequency drift and high-frequency noise); (8) ReHo image calculation: Kendall’s coefficient of concordance was used to measure the similarity of the time series within a functional cluster based on ReHo—here 27 nearest neighboring voxels were defined as a cluster; (9) mReHo image (standardized ReHo image) calculation: the ReHo value of each voxel was divided by the global mean ReHo value within the whole-brain mask for standardization purposes; and (10) smooth: mReHo images were spatially smoothed with a Gaussian kernel of 8 mm full width at half maximum.
The processing of resting CBF data was performed using SPM V.12 software (http://www.fil.ion.ucl.ac.uk/spm/software/spm12/). The main procedures included the following: (1) CBF image calculation: quantitative CBF images were calculated for each participant (details of CBF calculation have been described previously)33; (2) normalization (CBF images were normalized to standard MNI space): the native ASL images of a group of healthy subjects were non-linearly normalized to a positron emission tomography-perfusion template in MNI space and then averaged to generate an ASL template34—individual ASL images were non-linearly normalized to the ASL template, the normalization parameters were estimated and saved, and then all CBF images were normalized to the standard space using the saved normalization parameters; (3) removing non-brain tissue; (4) mCBF image (standardized CBF image) calculation: the CBF value of each voxel was divided by the global mean CBF value within the whole-brain mask for standardization purposes; and (5) smooth: mCBF images were spatially smoothed with a Gaussian kernel of 8 mm full width at half maximum.
For longitudinal data, each individual’s follow-up image was coregistered with its baseline image before the normalization step. Other processing steps were the same as described above.
To assess regional NVC, the mReHo:mCBF ratio was calculated for each voxel, which can be intuitively interpreted as the regional synchrony of spontaneous neuronal activity per unit CBF supply.
Data analysis
Clinical data and neuropsychological assessment analysis
The clinical and neuropsychological data were analyzed using IBM SPSS Statistics for Windows V.22.0. Kolmogorov-Smirnov test was performed to test the normality of the demographic and clinical variables.
The baseline, follow-up, and 5-year change rate (Δr), calculated as (follow-up−baseline)/baseline of the clinical and neuropsychological data, were compared between patients with T2DM and HCs using the two-sample t-tests for normally distributed data, the Mann-Whitney U test for non-normally distributed data, and the χ2 test for dichotomous variables. Significant level was set at p<0.05.
The mReHo:mCBF ratio statistical analysis
For patients with T2DM, to detect longitudinal changes in the mReHo:mCBF ratio, voxel-wise paired t-test embedded in SPM V.12 was conducted. Cluster-wise family wise error rate (FWE)-corrected p<0.05 was applied (FWE corrected at the cluster level, initial threshold p<0.0001). The significant clusters derived from the voxel-wise paired t-test in patients with T2DM were defined as regions of interest (ROIs). The mean mReHo:mCBF ratio within each ROI was extracted.
ROI-based two-way repeated-measures analysis of variance (ANOVA) (group factor: T2DM and HC; time factor: baseline and follow-up) was performed and followed by post-hoc Student’s t-test. Correlations between the mReHo:mCBF ratio within the ROIs and the clinical/cognitive variables both in patients with T2DM and in HCs were analyzed using partial correlations after controlling for age, gender, and years of education. Statistical analyses were performed with SPSS V.22.0. Significant level was set at p<0.05.
Results
Demographic and cognitive characteristics
Demographic, clinical characteristics, and cognitive performances of patients with T2DM and HCs are shown in table 1. Five-year longitudinal Δr is also shown in table 1. There were no significant intergroup differences in age, gender, education, BMI, BP, TC, TG, or LDL, but baseline HDL was higher in patients with T2DM (p<0.05). As expected, HbA1c and FBG were higher in patients with T2DM (p<0.001). In addition, memory performance exhibited no difference between the two groups at baseline and follow-up.
Longitudinal clinical characteristics and neuropsychological tests of patients with T2DM and of HCs
Longitudinal comparison of the mReHo:mCBF ratio
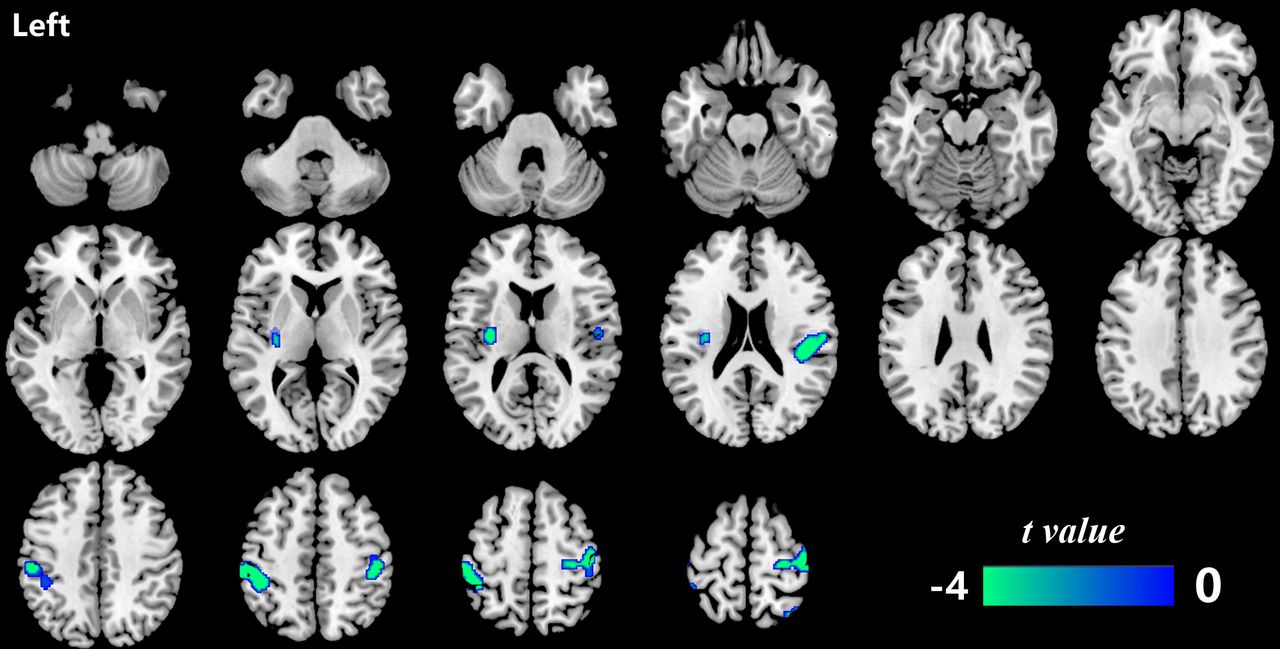
Significant mReHo:mCBF ratio reduction over 5 years in patients with T2DM was identified in four regions located in the left insula, the left postcentral gyrus, the right Rolandic operculum, and the right precentral gyrus (p<0.05, FWE cluster-corrected) (table 2 and figure 1). In order to investigate whether the longitudinal changes in patients with T2DM also exist in the HCs or are specific to patients with T2DM, ROI-based two-way repeated-measures ANOVA was performed across the two groups over the two time points. Significant group×time interactive effect was found in the ROI of the left insula (F=8.082, p=0.006). No significant interactive effect was observed in the other three clusters (figure 2). Post-hoc analysis on the ROI of the left insula further showed no difference in the mReHo:mCBF ratio between the two groups at baseline, but the value significantly decreased in patients with T2DM compared with the HC group at the follow-up visit (t=3.069, p=0.003).
Regions with significant longitudinal changes of mReHo:mCBF ratio in patients with type 2 diabetes (p<0.05, FWE cluster-corrected)

The brain regions with a significantly decreased mReHo:mCBF ratio in patients with type 2 diabetes (p<0.05, FWE cluster-corrected). Significant mReHo:mCBF ratio decline over 5 years was found in the left insula, the left postcentral gyrus, the right Rolandic operculum and the right precentral gyrus in patients with type 2 diabetes. CBF, cerebral blood flow; FWE, family wise error rate; mReHo:mCBF ratio, standardized ReHo:CBF ratio; ReHo, regional homogeneity.

Two-way repeated-measures analysis of variance of the mReHo:mCBF ratio in four clusters with significant longitudinal changes in patients with type 2 diabetes. Significant group×time interactive effect was found in the left insula (F=8.082, p=0.006) (A). No significant interactive effect was observed in the right Rolandic operculum (B), the left postcentral gyrus (C) or the right precentral gyrus (D). The error bars stand for SD. The left side of the brain corresponds to the left side of the picture and vice versa. CBF, cerebral blood flow; DM, diabetes mellitus; HC, healthy control; mReHo:mCBF ratio, standardized ReHo:CBF ratio; ReHo, regional homogeneity; TP1, time point 1 (baseline); TP2, time point 2 (follow-up).
Correlation analysis
At baseline, there was no relationship between the mReHo:mCBF ratio and memory performance. However, at the follow-up visit, significant positive correlations were found between the short memory score and the mReHo:mCBF ratio of the left insula, and between the short/long memory scores and the mReHo:mCBF ratio of the left postcentral gyrus in patients with T2DM. In addition, baseline HbA1c was positively related with the follow-up mReHo:mCBF ratio in the left insula of patients with T2DM. No other correlation was found in patients with T2DM. No significant correlation was found in HCs. The results of the correlation analysis are presented in figure 3.

Results of the correlation analysis in patients with type 2 diabetes. (A) The cluster of the left insula. (B–E) The correlation between the mReHo:mCBF ratio of the left insula (A) and HbA1c (B, C), the AVLT short-term memory scores (D) and the AVLT long-term memory scores (E). (F) The cluster of the left postcentral gyrus. (G, H) The correlation between the mReHo:mCBF ratio of the left postcentral gyrus (F) and the AVLT short-term memory scores (G) and the AVLT long-term memory scores (H). *Results with significant correlations. AVLT, Auditory Verbal Learning Test; CBF, cerebral blood flow; HbA1c, glycated hemoglobin; mReHo:mCBF, standardized ReHo:CBF ratio; ReHo, regional homogeneity.
Discussion
To our knowledge, this is the first study to investigate longitudinal changes of regional NVC in patients with T2DM by combining BOLD and ASL techniques. Patients with T2DM showed decreased mReHo:mCBF ratio in the left insula, the left postcentral gyrus, the right Rolandic operculum, and the right precentral gyrus. The mReHo:mCBF ratio was associated with memory performance in patients with T2DM. These findings may improve our understanding of the neural mechanisms of T2DM-related memory changes from the perspective of regional NVC.
ReHo based on BOLD signals is a voxel-based measure of neuronal activity.35 Although ReHo is an indirect measure of neural activity, it is one of the most commonly used rs-fMRI analytical methods36 37 and has high test–retest reliability.38 Majority of studies on T2DM displayed reduced ReHo values in occipital regions, with mixed findings in other regions such as the temporal lobe, postcentral gyrus, olfactory cortex, putamen, and so on.12 Increased ReHo in the precuneus and insula in patients with T2DM was also reported.11 39 40 As to the superior frontal gyrus, both increased and decreased ReHo values have been observed.39 40 ASL-CBF provides a quantitative measure of cerebral blood supply. The results of ASL study in T2DM are controversial,2 which may be due to the different patients included, including differences in age and differences in disease severity and duration. Although the exact pathophysiological mechanism underlying brain dysfunction and cognitive impairments in patients with T2DM remains uncertain, it is more likely to be a combination of neurodegenerative and vascular factors than any single one. This point was based on several experiments3 5 6 41 that confirmed NVC changes in patients with T2DM. NVC refers to the association of neural activity and CBF. Therefore, a combination of ReHo and CBF images (ReHo:CBF) reflecting the NVC may serve as a valuable in vivo method to elucidate the neural mechanisms of T2DM-related cognitive decline. Actually, the MRI method combining quantified neural activities and CBF has been successfully used for evaluating NVC changes in neuromyelitis optica19 and schizophrenia.18
In the current study, patients with T2DM exhibited decreased mReHo:mCBF ratio in the left insula, the right Rolandic operculum, the left postcentral gyrus, and the right precentral gyrus at 5-year follow-up. This decreased neuronal activity per unit CBF reflects the deviation from the previous balance (abnormal NVC). This can be interpreted as: under the same cerebral blood supply condition, the neural activity of patients with T2DM is reduced compared with that in 5 years ago. In other words, the brain needs to obtain more blood supply to maintain the same neural activity as it was 5 years ago.
The precentral/postcentral gyrus is not only associated with sensorimotor function, but also critical for cognitive activities42 and function of execution and attention.43 The posterior insula connects to the sensorimotor cortex, the dorsal-posterior cingulate, and occipital areas, functionally involved in processing and integrating external tactile, auditory, and intrinsic sensory information. It was also implicated in advanced cognitive functions such as language-related topics.44 The left insula was shown to be closely related to phonological working memory,45 and left insula damage was associated with poorer verbal memory performance.46 Given these roles, a healthy NVC state in the insula and precentral/postcentral gyrus should be essential for memorizing vocabulary (language-related). Therefore, disturbed regional NVC in these regions may interfere with the process of verbal memory. This was supported by the positive correlation between the mReHo:mCBF ratio in the left postcentral gyrus and the left insula and several memory metrics from the AVLT, which means that patients with higher mReHo:mCBF ratio demonstrated better memory performance. These results suggested that the NVC in the left postcentral gyrus and the left insula was critical for verbal memory, and patients with T2DM could maintain memory function at a relatively normal level through a brain compensation mechanism. Once the balance of the coupling deviates to a severe extent, the decompensation might occur and lead to decreased cognitive performances. However, this speculation should be verified in a longer-time follow-up study.
The right Rolandic operculum was expected to be involved in the compensation mechanism in the aging process,47 and therefore the right Rolandic operculum might be a reserved compensation-related brain region and could work with the left brain areas to maintain memory function during the neurodegenerative process in T2DM. Disturbed NVC in the right Rolandic operculum may lead to a diminished compensatory capacity.
Among the four clusters, only the mReHo:mCBF ratio in the left insula decreased more severely in patients with T2DM than in the HCs, while the changes in the other three clusters were similar in the two groups. These results were within our expectations and consistent with previous research. Cerebral matter volume changes in the sensorimotor cortex and Rolandic operculum area have been found in the normal aging processes.48 In addition, a previous review reported most patients with T2DM exhibit changes in cognition and brain that are comparable with their peers without diabetes who are 3–5 years older.49 Based on these, we speculated that patients with T2DM and HCs could share a common brain aging pattern; as shown in our results, the NVC changes in the left postcentral gyrus, the right Rolandic operculum, and the right precentral gyrus were similar within the two groups. However, the long-term persistent hyperglycemia, inflammatory, and oxidative stress processes could lead to neurovascular damage and blood–brain barrier dysfunction,50 which may accelerate the aging-related neurodegeneration in patients with T2DM. Therefore, it is explicable to find a more obvious mReHo:mCBF ratio decline in the left insula in patients with T2DM than that in the HCs. More significantly decreased mReHo:mCBF ratio in the left insula indicated more severe NVC damage of this area in patients with T2DM. The correlation between the mReHo:mCBF ratio in the left insula and verbal memory was found in patients with T2DM but not in the HCs, which suggested that neurovascular compensation may occur earlier in patients with T2DM than in HCs. With the disease progressing, the neurovascular damage may exceed the range of compensating ability; patients with T2DM will have to face decompensation and show a more severe memory dysfunction. The Δr of the mReHo:mCBF ratio in the right Rolandic operculum of the patient group was higher than that of the HCs (p=0.045) in the between-group comparisons without multiple comparisons (see online supplemental material 1 for specific methods and results). As mentioned, the right Rolandic operculum may be related to the compensatory reserve capacity of the brain. In patients with T2DM, compensation of the brain was likely to be activated earlier than in the HCs due to their accelerated brain degeneration and was manifested by increased NVC at an early stage. As the disease progresses, decompensation gradually appears and the NVC would decrease at an accelerated rate. However, this dynamic changing pattern of the NVC with the development of the disease is only a speculation. Unfortunately, this study only collected data at two time points spanning 5 years, which could not confirm this speculation. Therefore, a longer-term and multipoint longitudinal study is needed. No correlation was found between any memory performance and the mReHo:mCBF ratio value of any area of the brain in HCs. This may be due to the fact that the cognition level of HCs at this stage was still above the ceiling of the cognitive assessment in this study.
Supplemental material
Baseline HbA1c of patients with T2DM was found to be positively correlated with follow-up mReHo:mCBF ratio in the left insula, which is exactly the region with severely decreased mReHo:mCBF ratio in patients with T2DM compared with HCs. The positive correlation between HbA1c and the mReHo:mCBF ratio suggested that hyperglycemia seems to help maintain a relatively higher brain activity per unit blood flow supply in patients with T2DM. However, the 5-year decrease in mReHo:mCBF ratio was more severe in patients with T2DM than HCs. Therefore, this positive effect of hyperglycemia could be limited and might only exist in specific conditions, such as patients with T2DM who have not developed complications and whose brain function is still compensable. Additionally, the correlation was not found between follow-up HbA1c and follow-up mReHo:mCBF ratio. It suggested that the effect of hyperglycemia on NVC was not immediate; that is, early sustained hyperglycemia would have an impact on NVC at a later stage. Nevertheless, this explanation should be taken with caution.
In conclusion, this study conducted a 5-year follow-up study on patients with T2DM. It was found that the mReHo:mCBF ratio decreased in four brain regions, among which three brain regions showed a similar pattern of decline between the two groups while the left insula exhibited a more severe decline in patients with T2DM than in HCs. Positive correlations were detected between the mReHo:mCBF ratio and memory performance in patients with T2DM. These results suggested that T2DM may accelerate NVC disorder in specific brain regions, and the left insula may be one vulnerable target. This study implies that the mReHo:mCBF ratio is a potential imaging marker for detecting neurovascular impairment in patients with T2DM.
There are three limitations to our study. First, our 5-year follow-up study found decreased mReHo:mCBF ratio in the precentral and postcentral gyri, which are closely related to sensorimotor function. Diabetic peripheral neuropathy is a common complication in patients with T2DM, manifested as numbness, pain, and other paresthesias. Patients with T2DM in this study did not have peripheral neuropathy; therefore, our result suggested that disturbed NVC may occur before the appearance of clinically measurable symptoms. However, sensorimotor functions were not quantitatively tested in our study, and the relationship between the mReHo:mCBF ratio and the sensorimotor function was not assessed. Therefore, this assumption needs to be verified in future studies. Second, due to the long follow-up interval and the need for long-term medication to control blood glucose in patients with T2DM, the interference of treatment on the follow-up results could not be ruled out. Third, this study was the first to explore mReho:mCBF ratio longitudinal changes in patients with T2DM, and whether the results of this study can be generalized to the general diabetic population still needs to be verified by further research.
Acknowledgments
The authors thank all of the volunteers and participants for participating in the study.
References
Supplementary materials
Supplementary Data
This web only file has been produced by the BMJ Publishing Group from an electronic file supplied by the author(s) and has not been edited for content.
Footnotes
Contributors YZ and QZ designed the research. YZ, XZ, GM, WQ, JY and JL performed the research. YZ, XZ, WQ and QZ analyzed the data. YZ and QZ wrote the paper. QZ is the guarantor of this work and as such had full access to all the data in the study and takes responsibility for the integrity of the data and the accuracy of the data analysis.
Funding This work was supported by the Natural Science Foundation of Tianjin, China (17JCZDJC36300).
Competing interests None declared.
Patient consent for publication Not required.
Ethics approval The present study was approved by the Ethics Committee of the Tianjin Medical University General Hospital (IRB2020-YX-009-01).
Provenance and peer review Not commissioned; externally peer reviewed.
Data availability statement Data are available upon reasonable request. The data sets generated during and/or analyzed during the study are not publicly available because they are under construction, but are available from the corresponding author upon reasonable request. No applicable resources were generated or analyzed during the study.
Supplemental material This content has been supplied by the author(s). It has not been vetted by BMJ Publishing Group Limited (BMJ) and may not have been peer-reviewed. Any opinions or recommendations discussed are solely those of the author(s) and are not endorsed by BMJ. BMJ disclaims all liability and responsibility arising from any reliance placed on the content. Where the content includes any translated material, BMJ does not warrant the accuracy and reliability of the translations (including but not limited to local regulations, clinical guidelines, terminology, drug names and drug dosages), and is not responsible for any error and/or omissions arising from translation and adaptation or otherwise.