Article Text

Abstract
Introduction Despite advances in diabetic retinopathy (DR) medications, early identification is vitally important for DR administration and remains a major challenge. This study aims to develop a novel system of multidimensional network biomarkers (MDNBs) based on a widely targeted metabolomics approach to detect DR among patients with type 2 diabetes mellitus (T2DM) efficiently.
Research design and methods In this propensity score matching-based case-control study, we used ultra-performance liquid chromatography-electrospray ionization-tandem mass spectrometry system for serum metabolites assessment of 69 pairs of patients with T2DM with DR (cases) and without DR (controls). Comprehensive analysis, including principal component analysis, orthogonal partial least squares discriminant analysis, generalized linear regression models and a 1000-times permutation test on metabolomics characteristics were conducted to detect candidate MDNBs depending on the discovery set. Receiver operating characteristic analysis was applied for the validation of capability and feasibility of MDNBs based on a separate validation set.
Results We detected 613 features (318 in positive and 295 in negative ESI modes) in which 63 metabolites were highly relevant to the presence of DR. A panel of MDNBs containing linoleic acid, nicotinuric acid, ornithine and phenylacetylglutamine was determined based on the discovery set. Depending on the separate validation set, the area under the curve (95% CI), sensitivity and specificity of this MDNBs system were 0.92 (0.84 to 1.0), 96% and 78%, respectively.
Conclusions This study demonstrates that metabolomics-based MDNBs are associated with the presence of DR and capable of distinguishing DR from T2DM efficiently. Our data also provide new insights into the mechanisms of DR and the potential value for new treatment targets development. Additional studies are needed to confirm our findings.
- diabetes mellitus
- type 2
- diabetic retinopathy
- biomarkers
This is an open access article distributed in accordance with the Creative Commons Attribution Non Commercial (CC BY-NC 4.0) license, which permits others to distribute, remix, adapt, build upon this work non-commercially, and license their derivative works on different terms, provided the original work is properly cited, appropriate credit is given, any changes made indicated, and the use is non-commercial. See: http://creativecommons.org/licenses/by-nc/4.0/.
Statistics from Altmetric.com
Significance of this study
What is already known about this subject?
Diabetic retinopathy (DR) is a leading microvascular complication of diabetes mellitus, a major disease linked to metabolism.
Optimal biomarkers with sufficient sensitivity and specificity are vitally important for the effective prevention and control of DR.
What are the new findings?
We discovered that a highly specific and sensitive multidimensional network biomarkers (MDNBs) system containing linoleic acid, nicotinuric acid, ornithine and phenylacetylglutamine is capable of detecting patients with DR with high sensitivity and specificity.
Pathways, including linoleic acid metabolism, alanine, aspartate and glutamate metabolism and phenylalanine metabolism, may play a vital role in the initiation and development of DR.
How might these results change the focus of research or clinical practice?
Our findings may provide new insights into better understanding of the pathogenesis of DR and hold translational value in DR administration and the development of novel treatments.
Introduction
It is reported that the number of people with diabetes mellitus (DM) has reached 415 million worldwide by 2015 and is expected to rise to 642 million in 2040.1 With the advancement of DM treatment and more patients with DM living longer, the number of people with diabetic retinopathy (DR) is increasing rapidly worldwide, especially in Asia, including China.2–4 The annual incidence and progression of DR ranged from 2.2% and 3.4% in 1980 to 12.7% and 12.3% in 2018, respectively.5 Yau et al2 believed that the overall prevalence of all types of DR was 34.6% and about 93 million people were affected by DR worldwide in 2012. A meta-analysis revealed that the overall prevalence of DR in China was estimated to be 1.14%.6 According to Handan Eye Study, about 9.2 million Chinese rural people were suffering from DR.7 DR has become one of the most common microvascular complications of DM and remains a leading cause of vision impairment and blindness among working-age adults.5
As a devastating and progressive disease, DR can be generally divided into two stages according to its severity: non-proliferative DR (NPDR) and proliferative DR (PDR).4 NPDR is the earlier stage than PDR and characterized by microaneurysms, cotton-wool spots, intraretinal microvascular abnormalities, hard exudates as well as venous beading, whereas PDR is hallmarked by neovascularization of the optic disc or elsewhere, preretinal and vitreous hemorrhage.3 These clinical manifestations can only be detected by careful examination of the fundus, especially the peripheral fundus examination after mydriasis, which is often rejected by patients. In practice, NPDR usually remains undetected until it progresses to more advanced stages.5 Although current therapies including laser photocoagulation and intravitreal antivascular endothelial growth factor (anti-VEGF) injection can prevent visual loss when undertaken timely and appropriately, laser photocoagulation is inherently destructive with unavoidable side effects and anti-VEGF injection is expensive and needs repeated applications.4 Therefore, it is a pressing need to detect DR as early as possible in order to delay its progression, improve DR administration and significantly increase the effectiveness of therapy.
Metabolome analysis is a powerful approach to identify and quantify the entire collection of living systems’ intracellular and extracellular low molecular-weight metabolites response to biological stimuli or genetic modification.8 9 The dynamic metabolites mentioned above are considered the downstream products from proteome and transcriptome, and their changes may reveal crucial information relevant to the individual’s health status. Recently, several hospital-based metabolomics studies have been conducted to find efficient biomarkers and discover underlying mechanisms in diseases, including DM,10 cardiovascular disease,11 Alzheimer’s disease12 and retinal diseases.13 Specific technique platforms containing nuclear magnetic resonance spectroscopy, gas chromatography-mass spectrometry (GC-MS) and liquid chromatography-mass spectrometry (LC-MS) have been developed for metabolomics studies in the past several decades.8 Among them, the LC-MS system is more commonly used for metabolomic profiling than others because of its high sensitivity and selectivity. Although previous metabolomics studies have been applied in DR,14 15 few focused on the metabolomic underpinnings of DR early identification, which is widely accepted to be vitally necessary for DR administration efficiently. Abundant evidence has disclosed that serum or plasma metabolites and lipids are associated with diabetes and the development of retina hyperpermeability.14 16–18 We assume that there might be a panel of metabolomic multidimensional network biomarkers (MDNBs) for distinguishing DR from patients with type 2 diabetes mellitus (T2DM) efficiently.
To address this gap and thoroughly understand the unique, complicated metabolic state of DR, we, therefore, performed the current study using a widely targeted metabolomics approach by ion-pair reversed-phase ultra-performance liquid chromatography-electrospray ionization-tandem mass spectrometry (UPLC-ESI-MS/MS) in the serum of patients with T2DM with DR and those without DR, seeking to develop a new system of MDNBs with relatively high sensitivity and specificity for DR identification. We also aim to find underlying pathways for further understanding of the disease mechanisms.
Materials and methods
Study design and population
This was a propensity score matching (PSM)-based case-control study. To decrease the potential impact of the selection bias, we selected participants from the outpatient or inpatient of endocrinology departments in the Second Affiliated Hospital of Wenzhou Medical University (WMU) and the First Affiliated Hospital of Anhui Medical University in China. The diagnosis of DM was based on standard criteria recommended by WHO since 1999.
The inclusion criteria were as follows: (1) T2DM; (2) ≥35 years old. Participants with following situation would be excluded: (1) any other eye diseases or history of eye surgery; (2) cancer, infectious disease, mental disorder, heart failure, severe hypertension (systolic blood pressure ≥180 mm Hg or diastolic blood pressure ≥110 mm Hg) and any other severe chronic systemic disease; (3) poor quality of fundus photographs, which were not clear for DR diagnosis. Only those following each of the inclusion criteria and none of the exclusion criteria were potential participants.
All participants received detailed ophthalmic examinations and were separately assessed based on their retinal photographs by two experienced ophthalmologists (more details in the online supplemental methods). Among them, patients with T2DM with DR in at least one eye were determined as the cases, and others without any DR were defined as the controls. To reduce the impacts of potential confounders on our conclusions, we used a one-to-one optimal PSM method19 to minimize the difference within pairs based on a multiple logistic model containing age, sex, body mass index (BMI) and glycated hemoglobin. Ultimately, we included 69 pairs of participants in the current study. Besides, a total of 69 healthy volunteers without diabetes were also matched from the routine physical examination cohort in the Second Affiliated Hospital of WMU, using PSM by another multiple logistic regression model containing age, sex and BMI. The flowchart of the recruitment procedure is shown in online supplemental figure 1.
Supplemental material
Data collection
Quality assurance and quality control were well considered to increase the quality of our data. All subjects were invited to complete a semi-structured questionnaire by a face-to-face interview. Age was calculated with the formula: (investigation date−birthday)/365. Information on the occupation, education level, disease history, therapy history for DM medication, smoking habits, alcohol consumption and other demographic features was also obtained. The collection of other data containing clinical manifestation and biochemical assessments was performed by two systematically trained investigators strictly following the specific standardized operation procedures of the current study.
Sample collection, storage and assessment
After at least 8-hour fasting, 6 mL of venous blood was collected under complete aseptic precautions from all the subjects and stored at 4℃. The serum was separated by centrifugation at 2000 rpm for 10 min within 30 min, then transferred into a 1.5 mL sterile tube and stored at −86℃ ultra-low temperature freeze immediately. After the enrollment of all participants, serum samples were shipped in dry ice to the central laboratory of Metware, a professional and experienced metabolomics institution in Wuhan, China. Samples arrived in <24 hours and were stored immediately at −86℃ until further processing. The qualitative and relative quantitative assessments of widely targeted metabolites in the serum samples were performed using UPLC-ESI-MS/MS system. The MS2 spectral tag library including the MS and MS/MS spectra was used.20 Modified protocols for serum samples analysis were according to the method described previously21 and summarized in the online supplemental methods.
Data processing
After the serum metabolites assessment, the UPLC-ESI-MS/MS data acquired by Analyst Software V.1.6.3 (AB Sciex) were preprocessed (conversion, peak detection, retention time correction and peak alignment) by MultiQuant Software (AB Sciex), and then processed using MetaboAnalyst V.4.0 (https://www.metaboanalyst.ca/) and STATA MP V.15.0 (StataCorp, College Station, Texas, USA) including missing value processing,22 filtering23 and normalization. Details are available in the online supplemental methods.
Statistical analysis
The sample size of this study was determined using STATA MP V.15.0, referring to a previous study.14 The current sample size (69 participants per group) was sufficient for the detection of differential metabolites between the two groups, with 90% of the power and a type I error of 0.05 (two-sided). Demographic and clinical data were presented as the mean±SD or median (the first quartile, the third quartile) depending on their distributions for continuous data and frequency (percentage) for categorical data. Differences between the two groups were compared using paired t-test, Mann-Whitney U test or χ2 test based on the requirements of each statistical approach.
Due to the multidimensional nature of metabolomics data and the number of metabolites being much larger than that of the samples, a series of univariate and multivariate analysis was applied as follows: the univariate methods containing paired t-test and fold change (FC, defined as the ratio of cases by controls) analysis to represent the differences between the cases and controls. The false discovery rate (FDR) adjustment was also performed to reduce the probability of false-positive results using the Benjamini-Hochberg method.
To achieve more robust findings, we first randomly shuffled the PSM dataset to avoid a correlation between consequent elements.24 Then, the dataset was randomly split at a ratio of 2:1 into a discovery set (46 pairs) for training the model and a separate validation set (23 pairs) to test its performance. Participants in each set would never be included in another one, and both the discovery and validation sets were consistent with the original distribution. For multivariate analysis, principal component analysis (PCA) was applied to find a small set of variables that represent and explain the original data and simplify a dataset by reducing dimensionality. Meanwhile, orthogonal partial least squares discriminant analysis (OPLS-DA) was conducted to find a linear combination of features for the classification of cases and controls. To evaluate the robustness of the detected OPLS-DA model, we calculated R2Y (cum) and Q2 (cum) by 10-fold cross-validation, which independently represents the explanatory power and the predictive power of the model. An additional permutation test (1000 times) was also carried out to ensure the model without overfitting. Finally, the score value of variable importance for the projection (VIP) was acquired from the OPLS-DA model to individually select variables having a large influence on the contribution to the explanatory power of the model. Depending on the discovery set, the criteria of differential metabolites screening were defined as q value <0.05, FC value >1.2 or <0.8 as well as VIP >1. Meanwhile, a heatmap was also drawn to show the patterns of differential metabolites between the cases and controls.
Multivariable generalized linear regression models were performed to comprehensively investigate the associations between each differential metabolite and the presence of DR, in which ORs with 95% CI were separately calculated with the metabolite intensity as a continuous variable (IQR) and categorical variable (quartile). The capability and feasibility of each detected metabolite were evaluated using receiver operating characteristic (ROC) analysis based on the validation set. An optimal MDNBs system with higher sensitivity and specificity was screened depending on the area under the curve (AUC) from different combinations of detected differential metabolites.
All statistical tests were two-sided, and the p value ≤0.05 was set as the significant level.
Results
Characteristics of participants
Among 138 participants (69 pairs) in the cases and controls, 74 were men (46 in the discovery set and 28 in the validation set). The clinical and demographic characteristics of the participants stratified by the discovery and validation sets were presented in table 1. In this PSM-based case-control study, DR cases were more likely to have longer duration suffering from T2DM and higher proportion receiving medications than those of controls. In the DR group, there were 9 (13%) participants with mild NPDR, 31 (45%) with moderate NPDR, 20 (29%) with severe NPDR and 9 (13%) with PDR. Other characteristics of participants between the two groups in both the discovery and validation sets were comparable, indicating that the potential confounding impacts on our findings had been well adjusted for depending on the PSM approach.
Clinical and demographic characteristics of the study population
PCA and OPLS-DA
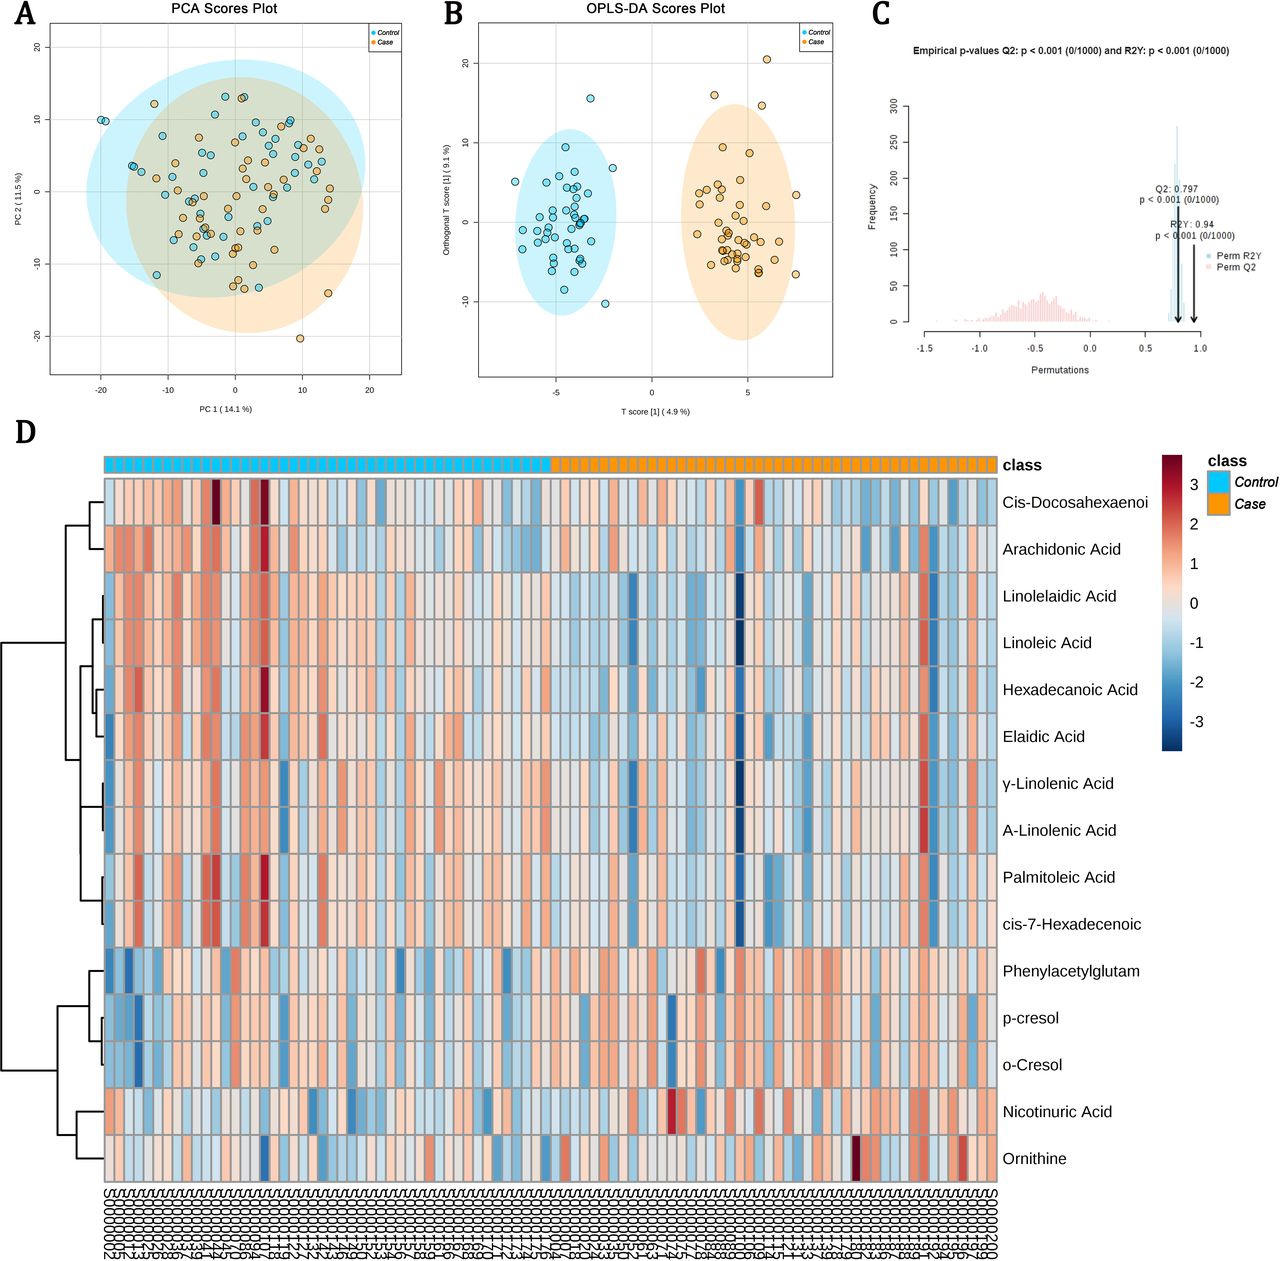
A total of 613 features (318 in ESI+ and 295 in ESI− modes) were detected depending on the UPLC-ESI-MS/MS data (more details in the online supplemental results) in the discovery set after being processed. As can be seen clearly in the PCA score plot (figure 1A), we observed a shift between the cases (the yellow dots) and controls (the blue dots). Figure 1B also clearly revealed that the cases and controls could be successfully distinguished from each other depending on the OPLS-DA scores plot. The parameters of the OPLS-DA model (R2Y (cum)=0.97, Q2 (cum)=0.65) calculated by 10-fold cross-validation also suggested that the model had satisfied robustness. In the validation of this OPLS-DA model based on a 1000-time permutation test, the empirical p values for R2Y and Q2 were all <0.001 (figure 1C), which indicated again that the observed statistic is not part of the distribution formed by those from the permuted data, thereby suggesting that the OPLS-DA model can be used to detect markers differentiating between DR and T2DM without DR successfully.

Metabolomic data analyses based on the discovery set. (A) Score plot of the principal component analysis (PCA) model; (B) score plot of the orthogonal partial least squares discriminant analysis (OPLS-DA) model, and the R2 was 0.97 and the Q2 was 0.65 calculated by 10-fold cross-validation; (C) results of 1000-time permutation test of the OPLS-DA model, and the empirical p values for R2Y and Q2 were all <0.001. The blue dots represent the samples of type 2 diabetes mellitus (T2DM) without diabetic retinopathy (DR) (controls), and the yellow dots indicate the samples of DR (cases); (D) heatmap for intensities of metabolomics-based markers identified in the discovery set. The heatmap presents relative peak areas of the final 15 detected differential metabolites between DR and T2DM without DR based on the discovery set. With colors changing from red to blue, red and blue colors mean upregulated and downregulated metabolites in the serum sample of patients with DR, respectively.
Differential metabolites detection
Under the criteria of detection which was defined as the combination of VIP >1, FC value <0.8 or >1.2 and FDR-adjusted p value <0.05, the intensity of 63 unique metabolites in the discovery set was significantly different between the cases and controls. Of the 63 unique metabolites, 42 metabolites in the cases were significantly increased, and the other 21 were undoubtedly decreased as compared with the controls. As we were mainly interested in the patterns of endogenous metabolites which could be driving systemic biological factors, a total of 48 metabolites that might be exogenous to humans (including medications, food additives and buffering agents) were excluded from the following data analysis. The remaining 15 metabolites are presented in table 2 and figure 1D. Also, pathway analysis was performed and strongly indicated that the occurrence and development of DR would be associated with the metabolisms of linoleic acid, alpha-linolenic acid, cysteine and methionine, argine and proline, arachidonic acid and phenylalanine (online supplemental figure 2).
Differential metabolites depending on the discovery set
Association of metabolite intensity with the presence of DR
Depending on the discovery set, the associations of each detected differential metabolite intensity with the presence of DR could be found in table 3 and online supplemental table 1. After adjusting for the impacts due to some potential confounding factors containing age, therapy history and smoking habits, OR (95% CI) for four distinct metabolites including linoleic acid, nicotinuric acid, ornithine and phenylacetylglutamine (PAG) were 0.22 (0.11 to 0.45), 2.50 (1.47 to 4.25), 1.80 (1.12 to 2.89), 4.64 (1.98 to 10.88) with per IQR elevation, respectively. These all revealed an individual independent association of DR occurrence with them. Meanwhile, the same associations were also observed between the odds of DR and quartile-classified metabolites intensities, and apparent linear trend between the outcome and four exposures could be observed individually (p for trend <0.05, table 3).
Association between the peak intensity of the four metabolites and the odds of diabetic retinopathy
In addition, online supplemental figure 3 showed the changes in the 15 metabolites mentioned above among the cases, T2DM controls and healthy controls. The intensities of PAG, p-cresol, o-cresol, nicotinuric acid and ornithine revealed obvious accumulating trends from healthy volunteers to patients with DM and DR cases. In contrast, the levels of linoleic acid (C18:2N6C), linolelaidic acid (C18:2N6T), palmitoleic acid (C16:1), gamma-linolenic acid (C18:3N6), alpha-linolenic acid (C18:3N3), cis-7-hexadecenoic acid, hexadecanoic acid (C16:0), elaidic acid (C18:1N9T), cis-4,7,10,13,16,19-docosahexaenoic acid (C22:6N3) and arachidonic acid, all of which were polyunsaturated fatty acids (PUFAs), disclosed apparent decreasing trends from healthy volunteers to patients with DM and DR cases.
MDNBs screening and evaluation of its capability on DR identification
Table 2 presented the capability of 15 metabolites on DR recognition depending on ROC analysis in the discovery set, respectively. In a series of different combinations of the 15 metabolites, which were developed to overcome the limitation of a single biomarker, we compared all other models with the total model, including all the 15 metabolites, as the reference to screen an optimal panel of MDNBs. According to the theory of Occam’s razor,25 entities should not be multiplied unnecessarily to avoid overfitting and potential collinearities. Therefore, we finally selected four uncorrelated metabolites based on the results of correlation analysis to fit two combined models with fewer variables but similar efficiency of distinguishing DR from their counterparts. As could be seen in figure 2A, the AUC (95% CI) for linoleic acid, combined1, combined2 and the total model were 0.81 (0.72 to 0.90), 0.85 (0.77 to 0.93), 0.93 (0.87 to 0.98) and 0.96 (0.92 to 0.99), respectively. As no significant difference was found between the combined2 model and the total model (online supplemental table 2), the combined2 model including linoleic acid, nicotinuric acid, ornithine and PAG was determined as the candidate MDNBs system with sufficient sensitivity (91%) and specificity (87%).

Combined receiver operating characteristic (ROC) curves of multidimensional network biomarkers (MDNBs) distinguishing subjects with diabetic retinopathy (DR) versus subjects with type 2 diabetes mellitus without DR in the discovery set (A) and validation set (B). The combined2 model (MDNBs) contains linoleic acid, nicotinuric acid, ornithine and phenylacetylglutamine; the combined1 model contains linoleic acid and nicotinuric acid; the total model contains all the 15 potential metabolite biomarkers.
The evaluation of the candidate MDNBs system based on the validation set is presented in figure 2B. Its AUC (95% CI), sensitivity and specificity were 0.92 (0.84 to 1.0), 96% and 78%, respectively. Moreover, no significant difference between the MDNBs and the total model was detected (online supplemental table 2). This strongly suggested that the panel of linoleic acid, nicotinuric acid, ornithine and PAG could be used as a sensitive and specific system of MDNBs to distinguish DR from their counterparts in the population with T2DM.
Sensitive analysis
After excluding nine PDR and their paired controls, the remaining 60 pairs of participants were also randomly split into a discovery set (40 pairs) and a validation set (20 pairs) at the ratio of 2:1, which has been widely applied in data mining practice including machine learning. Then we repeated the validation of this detected MDNBs system. The associated AUC (95% CI), sensitivity and specificity were 0.93 (0.88 to 0.99), 90% and 88% in the discovery set, and 0.90 (0.81 to 0.99), 75% and 90% in the validation set, respectively (online supplemental figure 4). The capability of the MDNBs on DR identification was consistent with the former findings.
Discussion
In this PSM-based, multicenter case-control study, we extensively assessed the serum metabolomics profiles on the presence of DR depending on the widely targeted metabolomics approach. A total of 15 endogenous metabolites were detected to be significant with the odds of DR. The results of pathway analysis revealed that DR occurrence was mainly involved in metabolisms of linoleic acid, alpha-linolenic acid, cysteine and methionine, argine and proline, arachidonic acid as well as phenylalanine, which suggested that metabolic disorder would play an important role in the initiation and development of DR. Among them, the panel of linoleic acid, nicotinuric acid, ornithine and PAG were highly specific and sensitive to distinguishing DR from T2DM and could be an optimal MDNBs system for DR identification.
Available evidence suggests that PUFAs have a unique ability to modulate capillary integrity, neovascularization and inflammation in the retina.26 PUFAs deficiency may lead to increased inflammation in patients with diabetes and primarily increase the likelihood of the presence, development and severity of DR.27 In the present study, 10 PUFAs containing linoleic acid (C18:2N6C), arachidonic acid and others revealed an apparent decreasing trend from healthy participants to T2DM and patients with DR. Our findings are consistent with the studies mentioned above and suggest that elevated PUFAs may effectively decrease the likelihood of DR and postpone its progression. A similar result is also observed in a plasma GC-MS-based metabolomics study.28 However, in another plasma metabolomics study, Chen et al14 report that no significant differences of linoleic acid and arachidonic acid intensities exist between patients with DR and controls with diabetes. They suppose that the low level of arachidonic acid might be modified by the use of antihypertensive medications. To clarify this potential effect of the antihypertensive medications on the PUFAs levels, we carried out a subanalysis in all participants with antihypertensive medications between DR cases and the controls. We observed that the intensities of these two metabolites were also significantly lower in DR cases than those of the controls (28 cases vs 18 control, p<0.001 for linoleic acid and p=0.012 for arachidonic acid). The inconsistency in the findings by Chen et al as compared with other studies may be owing to the different metabolomics-based approaches and distinct nationalities of the participants. Additional studies are needed to confirm this.
PAG is a metabolite from amino acid fermentation and results from glutamine conjugation of phenylacetic acid. The previous study suggests that elevated serum PAG is a strong and independent risk factor for overall mortality and cardiovascular disease, pointing to the relevance of microbial metabolism and tubular secretion, irrespective of protein binding.29 However, no report has investigated the relationship between PAG and DR. And in the present study, we observed that elevated serum PAG would significantly increase the odds of DR (OR 4.64, 95% CI 1.98 to 10.88, with per IQR increase of PAG). As a non-proteinogenic amino acid and an intermediate in metabolic processes, ornithine is a central part of the urea cycle and essential on the protective effect of insulin in DM through ornithine decarboxylase/polyamine systems.30 However, no reports of the role of ornithine in DR can be found. In the current study, we detected that the intensity of serum ornithine was positively linked to elevated odds of DR (OR 1.80, 95% CI 1.12 to 2.89, with per IQR increase of ornithine).
Of the potential biomarkers found in the current study, nicotinuric acid is the primary catabolic product of nicotinic acid, which is mainly related to the production of nicotinamide adenine dinucleotide (NAD+) and nicotinamide adenine dinucleotide phosphate (NADP+), the core enzymes for oxidation-reduction reactions.31 Huang et al32 have reported that the urine nicotinuric acid intensity in diabetes (n=25) was higher than those without DM (n=37) in a urinary metabolomics study depending on the high-performance liquid chromatography-time-of-flight mass spectrometry. Furthermore, nicotinic acid has also been reported to alter lipid metabolism and increase the possibility of insulin resistance,33 which is widely considered as the vital pathological mechanism of metabolic syndrome. In the present study, the highest level of serum nicotinuric acid was discovered in DR cases followed by T2DM without DR and healthy controls (online supplemental figure 3). To the best of our knowledge, this is the first report to suggest that serum nicotinuric acid level is accumulating during the development of DR, which may contribute to the understanding of the underlying pathological mechanisms of DR initiation and progression.
Several strengths can be found in the current study as compared with previous studies. First, the structure and intensities of 613 features are detected using a widely targeted metabolomics approach, which is believed to obtain more precise and accurate data on predefined metabolites as compared with traditional untargeted metabolomics study. Second, participants included in the current study have been matched by the PSM method, in which some potential confounding factors will be more comparable between the cases and controls. Third, a comprehensive analysis of the metabolomics characteristics of DR is conducted using several appropriate statistical methods. Finally, a sensitive and specific panel of MDNBs for DR screening, instead of a single biomarker, is trained depending on the discovery set and validated by both a 10-fold cross-validation test and a 1000-times permutation test, which suggests that our findings are robust and credible. Additional rigorous, designed studies would be needed to verify our findings.
This study also has limitations, such as the relatively small sample size and the participants only from two hospitals in China. Although a small sample size will affect the reliability of the results to some extent since it will lead to insufficient power to reject the null hypothesis, this does not mean that the current sample size is insufficient since it has been carefully estimated during the study design period. Furthermore, the participants of this study are enrolled from two top hospitals in both Zhejiang and Anhui provinces, which cover >120 million people. This will decrease the potential impact of the selection bias on our findings to some extent. Another limitation is that our data of metabolites might be affected by the current body nutrition and metabolic status of each individual patient since this is a case-control study. Further longitudinal studies are needed to confirm our findings.
In conclusion, to the best of our knowledge, this is the first report to suggest that a system of metabolomics-based MDNBs containing linoleic acid, nicotinuric acid, ornithine and PAG are associated with the presence of DR and capable of distinguishing DR from T2DM efficiently. Based on our results, we demonstrate that metabolomics-based MDNBs would like to be optimal biomarkers of DR and very suitable for distinguishing DR from T2DM efficiently, especially in those at the early stage of DR or without some typical signs and symptoms to be timely diagnosed via traditional routine techniques in clinical practice. Our findings will provide a new option to forecast some patients with T2DM at the high risk to develop DR before the occurrence and development, to detect many early stage patients with DR among T2DM, to perform early diagnosis of DR and provide efficient medications to patients with DR in time. All these applications will be very beneficial to DR administration and guide ophthalmologists to select better medications for their patients, which will provide a solid foundation for novel treatment targets screening in future studies. In a word, our findings emphasize the clinical and public health policy relevance of precise DR administration. Our findings also contribute to the current knowledge of DR pathophysiology by highlighting the role of lipid metabolism, especially the linoleic acid and arachidonic acid pathway, which indicates potential novel targets for DR treatment.
Acknowledgments
The authors would like to thank the colleagues from Wenzhou Medical University, Anhui Medical University and Zhejiang University School of Medicine for their hard works and collaborations. The authors would like to thank Metware, Inc., for their careful assay of all the serum samples and comments on the data analysis. The authors would like to thank all study participants for donating their contribution and time. The authors would also like to thank Dr Clara Pak from the University of Rochester Medical Center for her valuable suggestions and edits to the manuscript.
References
Supplementary materials
Supplementary Data
This web only file has been produced by the BMJ Publishing Group from an electronic file supplied by the author(s) and has not been edited for content.
Footnotes
JZ, YL and HH contributed equally.
Contributors JZ and YL conducted the research, analyzed the data and wrote the manuscript. XH and YW analyzed the data. JL, TW, HZ, NZ, CG, FP and SZ contributed to the epidemiological investigation, sample handling, data management and analysis. CJ repeated the data analysis independently. GM, CZ and HH designed the study, thoroughly reviewed and edited the manuscript.
Funding This study was funded by Zhejiang Basic Public Welfare Research Project (LGF19H260011), Wenzhou Basic Public Welfare Research Project (Y20180201), the Initial Scientific Research Fund (KYQD170301), the Major Project of the Eye Hospital of Wenzhou Medical University (YNZD201602) and the academician’s science and technology innovation program in Zhejiang province (2018R413182). Part of this work was also funded by the National Nature Science Foundation of China (81670777) and Natural Science Foundation of Zhejiang Province (LZ19H020001).
Competing interests None declared.
Patient consent for publication Not required.
Ethics approval The protocol had been carefully reviewed and approved by the Ethics Committee of the Eye hospital of WMU before the study (Number: KYK (2017) 46). The procedures strictly followed the tenets of the Declaration of Helsinki. All participants in the current study were voluntary and provided written informed consents.
Provenance and peer review Not commissioned; externally peer reviewed.
Data availability statement Data are available on reasonable request. The raw/processed data cannot be shared at this time as the data also form part of an ongoing study but are available from corresponding author on reasonable request.
Supplemental material This content has been supplied by the author(s). It has not been vetted by BMJ Publishing Group Limited (BMJ) and may not have been peer-reviewed. Any opinions or recommendations discussed are solely those of the author(s) and are not endorsed by BMJ. BMJ disclaims all liability and responsibility arising from any reliance placed on the content. Where the content includes any translated material, BMJ does not warrant the accuracy and reliability of the translations (including but not limited to local regulations, clinical guidelines, terminology, drug names and drug dosages), and is not responsible for any error and/or omissions arising from translation and adaptation or otherwise.