Article Text

Abstract
Introduction We compared the degree of spousal concordance in a set of detailed pathophysiological markers and risk factors for type 2 diabetes to understand where in the causal cascade spousal similarities are most relevant.
Research design and methods This is a cross-sectional analysis of couples who participated in The Maastricht Study (n=172). We used quantile regression models to assess spousal concordance in risk factors for type 2 diabetes, including four adiposity measures, two dimensions of physical activity, sedentary time and two diet indicators. We additionally assessed beta cell function and insulin sensitivity and glucose metabolism status with fasting and 2-hour plasma glucose and hemoglobin A1c.
Results The strongest spousal concordance (beta estimates) was observed for the Dutch Healthy Diet Index (DHDI) in men. A one-unit increase in wives’ DHDI was associated with a 0.53 (95% CI 0.22 to 0.67) unit difference in men’s DHDI. In women, the strongest concordance was for the time spent in high-intensity physical activity (HPA); thus, a one-unit increase in husbands’ time spent in HPA was associated with a 0.36 (95% CI 0.17 to 0.64) unit difference in women’s time spent in HPA. The weakest spousal concordance was observed in beta cell function indices.
Conclusions Spousal concordance was strongest in behavioral risk factors. Concordance weakened when moving downstream in the causal cascade leading to type 2 diabetes. Public health prevention strategies to mitigate diabetes risk may benefit from targeting spousal similarities in health-related behaviors and diabetes risk factors to design innovative and potentially more effective couple-based interventions.
- epidemiology
- diabetes mellitus
- type 2
- risk factors
- insulin resistance
This is an open access article distributed in accordance with the Creative Commons Attribution Non Commercial (CC BY-NC 4.0) license, which permits others to distribute, remix, adapt, build upon this work non-commercially, and license their derivative works on different terms, provided the original work is properly cited, appropriate credit is given, any changes made indicated, and the use is non-commercial. See: http://creativecommons.org/licenses/by-nc/4.0/.
Statistics from Altmetric.com
Significance of this study
What is already known about this subject?
Spousal relations affect health and health-related behaviors, and couples often have similar risk factor levels, which tend to converge over time.
The risk of developing type 2 diabetes is increased among people with a spouse with diabetes compared with people with a spouse without diabetes.
Previous studies of spousal concordance in type 2 diabetes risk factors have generally studied only a few determinants each, not all of them together.
What are the new findings?
Our results showed, with a high level of detail, that spousal concordance was strongest in behavioral risk factors, particularly for the Dutch Healthy Diet Index and time spent in high-intensity physical activity.
By contrast, the weakest spousal concordance was found in beta cell function indices.
How might these results change the focus of research or clinical practice?
Public health prevention strategies to mitigate diabetes risk might benefit from targeting spousal similarities in health-related behaviors and diabetes risk factors to design innovative couple-based interventions.
Introduction
It is widely recognized that social relationships influence health and health-related behaviors.1 2 Spousal relations are known for their health concordance.1 In particular, individuals with a spouse with diabetes are at increased risk of developing type 2 diabetes.3–5 A recent meta-analysis found that when one spouse had type 2 diabetes, the other spouse had a 90% higher likelihood of also having type 2 diabetes compared with somebody with a spouse without diabetes.4 Moreover, spousal similarities in type 2 diabetes risk factors have been reported for obesity,6 7 self-reported physical activity8 9 and diet.10 11
While understanding about spousal concordance of type 2 diabetes and their corresponding risk factors has increased, many studies have not used measures with enough detail to distinguish mechanisms such as beta cell function and insulin sensitivity. Few studies have explored concordance in objectively measured physical activity12 as well as concordance in alternative measures of adiposity to body mass index (BMI) and waist circumference. Understanding spousal concordance at this level of detail under a causal cascade framework13 14 is important to identify at which level spousal similarities are greatest and which factors to target in prevention strategies. We hypothesized that the degree of spousal concordance will be stronger in upstream behavioral risk factors in the causal cascade leading to type 2 diabetes (such as physical activity or diet), rather than in downstream determinants like insulin sensitivity or beta cell function. Therefore, the objective of this study was to assess and compare the degree of spousal concordance in a detailed set of pathophysiological markers and risk factors of type 2 diabetes.
Research design and methods
The Maastricht Study design and population
We used data from The Maastricht Study, an observational, prospective, population-based cohort study. The rationale and methodology have been described previously.15 In brief, the study focuses on the etiology, pathophysiology, complications and comorbidities of type 2 diabetes and is characterized by an extensive phenotyping approach. Eligible for participation were all individuals aged between 40 and 75 years and living in the southern part of the Netherlands. Participants were recruited through mass media campaigns and from the municipal registries and the regional diabetes patient registry via mailings. Recruitment was stratified according to known type 2 diabetes status, with an oversampling of individuals with type 2 diabetes, for reasons of efficiency. The present report includes cross-sectional data from the first 3451 participants who completed the baseline survey between November 2010 and September 2013. The examinations of each participant were performed within a time window of 3 months. All participants gave written informed consent.
Ascertainment of spousal relations
From the 3451 participants of The Maastricht Study, 3074 provided information on their social network by using a name generator tool. This questionnaire asks the participants to list and identify individuals in their social network, including the type of relationship (family, friends, coworkers and spouses/partners), as described in detail elsewhere.16 Of those, 2393 individuals provided sufficient information to be used in a matching algorithm to identify individuals named in the name generator tool who also participated in The Maastricht Study. After removing duplicated couples (n=88), ascertainment of mismatched couples (n=12), exclusion of same-sex couples (n=3) and couples in which either spouse had a type 1 diabetes diagnosis (n=2), we identified 326 spousal relationships (figure 1).

Sample exclusion flow chart. *Percentage of body fat had one observation less. AUC, area under the curve; HOMA2-IR, Homeostatic Model Assessment of Insulin Resistance.
Outcomes and main exposures
Physical activity
Daily activity levels were assessed using the activPAL3 physical activity monitor (PAL Technologies, Glasgow, UK). A full description of activPAL data processing and validation of waking time definition has previously been described elsewhere.17 The total amount of stepping (physical activity) was based on the stepping posture and calculated as the mean time stepping during waking time per day. This was further classified as low-intensity physical activity (LPA) if step frequency was ≤110 steps per minute during waking time and high-intensity physical activity (HPA) if step frequency was >110 steps per minute during waking time.18 The amount of sedentary time was based on the sedentary posture (sitting or lying) between wake and bedtime and calculated as the mean time spent in a sedentary position during waking time per day. To calculate the percentage of time spent in LPA, HPA and sedentary time from the total waking time, physical activity dimensions and sedentary time were divided by the total waking minutes on waking days and then multiplied by 100.
Diet indicators
Dietary information was collected with a validated food frequency questionnaire (FFQ) developed using the Dutch National FFQ Tool.19 The FFQ collected information on the habitual frequency of consumption of 23 major food groups (eg, fruits, vegetables, dairy products, meat, bread; fats, oils, savory and so on) over the last 12 months.19 Total energy intake was calculated using the Dutch NEVO food consumption table version 2011. Implausible energy intake were values <800 kcal or >4200 for men and <500 kcal or >3500 kcal for women. We used the Dutch Healthy Diet Index (DHDI) as a measure of diet quality. It assesses adherence to Dutch dietary guidelines from 2015 on healthy food consumption.20 The DHDI has 15 components, including fruit, vegetables, whole grain products, legumes, nuts, dairy, fish, fats and oils, coffee, red meat, processed meat, sweetened beverages and fruit juices, alcohol and salt; the coffee component was not included in this analysis as the FFQ did not distinguish between filtered and unfiltered coffee. Each component scores from 0 to 10 points; thus, the total score ranges from 0 representing no adherence to 140 representing complete adherence. Further details on operationalization are provided elsewhere.20
Adiposity measures
Detailed physical examination procedures can be found in the supplementary material of the publication by Schram et al.15 BMI and the percentage of body fat (BF) were proxy measures of general adiposity. The percentage of BF was based on skinfold measures and calculated with the Siri equation.21 Waist circumference and the waist to hip ratio were used as measures of central adiposity.
Pathophysiological markers: beta cell function and insulin sensitivity
All participants, except those who used insulin, underwent a standardized 2-hour 75 g oral glucose tolerance test (OGTT) after an overnight fast. Venous blood samples were collected before, 15, 30, 45, 60, 90, and 120 min after ingestion of the oral glucose load.15 Plasma assessment of C peptide and glucose levels is described in detail elsewhere.22 We used two measurements of hepatic and muscle insulin sensitivity: the updated version of the Homeostatic Model Assessment of Insulin Resistance (HOMA2-IR) and the Matsuda Index, respectively.23 24 We assessed beta cell function with five indices as previously described.22 25 26 Two of them were OGTT-based indices: C-peptidogenic indext30 and the ratio of the C peptide to glucose area under the curve. The other three indices were mathematical model-based parameters: glucose sensitivity index, potentiation factor and the rate sensitivity index.25 26 These model-based parameters describe insulin secretion as the summed beta cell response to absolute glucose levels.26 The disposition index was used as a measure of insulin secretion adjusted for the level of insulin sensitivity.27
Glucose metabolism indicators
We used fasting and 2-hour plasma glucose as well as hemoglobin A1c (mmol/mol and %) as glucose metabolism indicators.
Covariates
Sociodemographic indicators
These included age and educational level, which was categorized as low if the participant reported having lower vocational education or below; otherwise, it was categorized as medium educational level or above.
Behavioral risk factors
Smoking status was categorized as never/former versus current smokers, while alcohol consumption was categorized as high consumption if women reported consumption of more than seven glasses of alcohol per week or men reported consumption of more than 14 glasses per week; otherwise, participants were classified as having no or low alcohol consumption.
Chronic disease background
Type 2 diabetes was defined as having a fasting plasma glucose value ≥7.0 mmol/L or a 2-hour plasma glucose value ≥11.1 mmol/L28 or use of blood glucose-lowering medication. Hypertension was defined as having blood pressure value ≥140/90 mm Hg or use of antihypertensive medication. We captured history of cardiovascular disease using binary variables. Family history of diabetes was defined as a categorical variable (yes/no/unknown). Missing values were grouped together with ‘unknown’ category in order to avoid further reduction of the analytical sample size in the regression analysis.
Statistical analysis
We present the median (IQR) or frequencies for descriptive analyses. Spearman rank correlation coefficients with 95% CI were used to assess the statistical dependence between the same indicators in the two spouses. We used χ2 test to compare the expected versus the observed prevalence of chronic diseases and behavioral risk factors in the couple. Quantile regression was used to model the median value as it provides a better summary of centrality when asymmetries and heavy tails exist; this modeling choice is also robust to outlier values.29 It is important to highlight that the rank-inversion method to compute confidence limits potentially produces asymmetric CIs.
The outcome of interest and the main exposure were continuous variables measured in each of the spouses. For example, if the association under study was the spousal concordance in insulin sensitivity measured with HOMA2-IR index, then two estimates were presented, one related to men’s insulin sensitivity as a function of the wives’ insulin sensitivity and the second one related to women’s insulin sensitivity as a function of the husbands’ insulin sensitivity. Furthermore, if the outcome was examined for men, model adjustment corresponded to men’s potential confounding factors (age, waist circumference, time in HPA and family history of diabetes), and vice versa model adjustment for women’s confounding factors when the outcome was examined in women. In order to avoid confusion we will refer to men and women to indicate the sex stratum for the outcome of the models, and we will refer to husbands or wives with regard to their role in defining exposures for their spouse.
We present age-adjusted and multivariable adjusted models. Confounder selection was performed using directed acyclic graphs. In our models, spousal characteristics are regarded as indicators of the unobserved shared spousal environment. Likewise, covariates (observed in the ‘outcome’ partner) are regarded as indicators of that same environment. Thus, the purpose of our adjustments is not to isolate a causal effect between the same variable in both spouses, but to explore to which degree the effect of the unobserved shared environment captured by the partner’s characteristics (unadjusted analyses) can be explained by the shared environment’s effects via the ‘outcome partner’s own major risk factors. Physical activity models were adjusted for age, educational level, alcohol use and smoking status. The DHDI model was adjusted for age, total energy intake, educational level, waist circumference and smoking; total energy intake was adjusted for age, smoking status, educational level and waist circumference. Adiposity measures were adjusted for age, time in HPA, smoking status, DHDI and educational level. Beta cell function, insulin sensitivity and glucose metabolism indicators were adjusted for age, waist circumference, time in HPA and family history of diabetes. The final analytical sample varied for each outcome of interest due to missing and non-plausible (negative) values in the outcome and covariates (figure 1). To compare the degree of spousal concordance across the different sets of outcomes, we used age-adjusted models under a complete case analysis definition (n=172 couples). This definition excluded the rate sensitivity index to avoid further reduction of the number of couples with complete information.
In order to identify any potential determinants of selective participation of spouses in The Maastricht Study, we compared outcome and covariate distributions among individuals who reported having a spouse/partner who was not identified as participant in The Maastricht Study with individuals in our analytical sample. We further compared spouses’ characteristics of those included in the complete case sample with those with incomplete data. Finally, to assess how missing values in objectively measured physical activity affected estimates of adiposity measures, pathophysiological markers and glucose metabolism indicators models, we performed a sensitivity analysis using self-reported moderate-vigorous physical activity (MVPA) assessed with the CHAMPS questionnaire30 for model adjustment. All analyses were performed using R V.3.6.2.31
Results
Study participants’ risk factors and pathophysiological markers are summarized in table 1. Overall, men and women showed inherent sex differences in adiposity measures and total energy intake.
The Maastricht Study spouses’ characteristics
Table 2 shows that among 29% and 4% of the couples both members had hypertension and type 2 diabetes, respectively. Furthermore, we observed a higher prevalence of spousal concordance in family history of diabetes (12%) and high alcohol consumption (14%) than the expected prevalence of concordance based on the marginal individual prevalence of these risk factors (8.8% and 8.4%, respectively).
Sociodemographic characteristics, chronic disease background and behavioral risk factors from The Maastricht Study spouse relationships
Degree of spousal concordance
Table 3 shows the Spearman correlation coefficients and beta coefficients with 95% CI for the degree of spousal concordance in type 2 diabetes risk factors and pathophysiological markers for men and women separately. The strongest Spearman correlation coefficients were observed in DHDI (0.42, 95% CI 0.34 to 0.52) and time spent in HPA (0.36, 95% CI 0.24 to 0.47); these were followed by BMI (0.33, 95% CI 0.24 to 0.42), waist circumference (0.32, 95% CI 0.22 to 0.43) and time in LPA (0.27, 95% CI 0.14 to 0.38). The weakest correlation coefficients were observed in beta cell function indices.
Spearman correlation coefficients and quantile regression models of the degree of spousal concordance in pathophysiological markers and type 2 diabetes risk factors
We observed a positive association throughout all outcomes within couples (table 3). Examples on the interpretation of beta coefficients (95% CI) presented in table 3 are as follows: a one-unit increase in wives’ DHDI was associated with a 0.42 (95% CI 0.31 to 0.54) unit difference in men’s DHDI, whereas a one-unit increase in husbands’ DHDI was associated with a 0.29 (95% CI 0.19 to 0.45) unit difference in women DHDI. A one-unit increase in the wives’ or husbands’ time spent in HPA was associated with a 0.35 (95% CI 0.23 to 0.43) and 0.28 (95% CI 0.09 to 0.53) unit difference in the time that men and women spent in HPA, respectively.
Comparison of the degree of spousal concordance
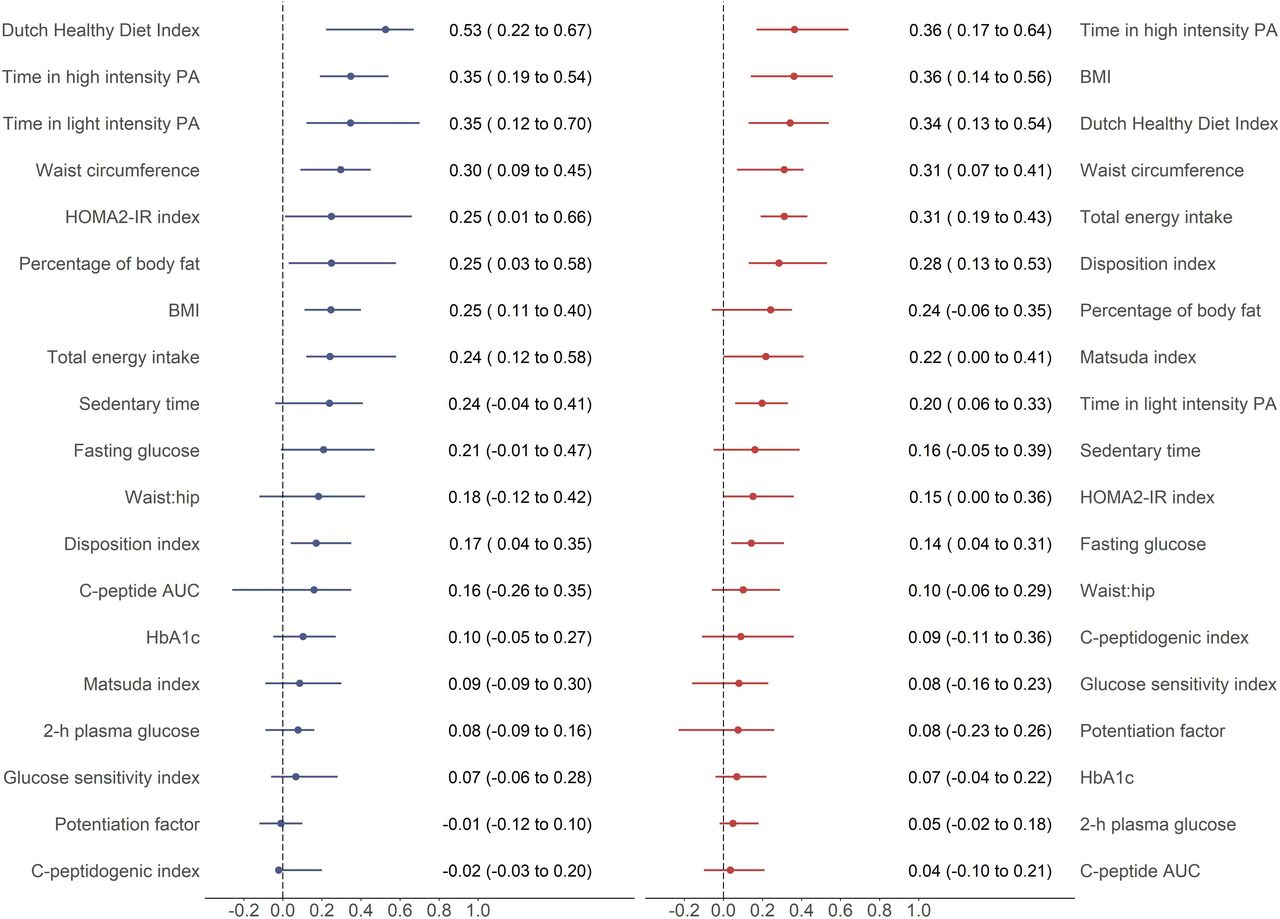
Among men the highest degree of spousal concordance was observed in DHDI (figure 2); this was followed by the time spent in both HPA and LPA, measures of adiposity (waist circumference, percentage of BF and BMI) and the HOMA2-IR index. Women showed the highest concordance for time spent in HPA and BMI; this was followed by DHDI, total energy intake, waist circumference, disposition index and percentage of BF. Beta cell function indices and glucose metabolism status indicators (2-hour plasma glucose and hemoglobin A1c) showed the weakest degree of spousal concordance in both men and women.
Age-adjusted quantile regression models in the complete case analysis sample (n=172) comparing the degree of spousal concordance in the different sets of outcomes sorted by decreasing order and separately for men and women. Beta coefficients with 95% CI. Blue lines represent men’s outcomes with wives’ measurements as exposure. Red lines represent women’s outcomes with husbands’ measurements as exposure. AUC, area under the curve; BMI, body mass index; HbA1c, hemoglobin A1c; HOMA2-IR, Homeostatic Model Assessment of Insulin Resistance; PA, physical activity.
Online supplemental tables S1 and S2 show the results from the sensitivity analysis aiming to identify potential drivers of selective participation of spouses in The Maastricht Study. Individuals with a spouse who also participated in The Maastricht Study (n=326) had lower values of glucose metabolism indicators, lower values of BMI, waist circumference, percentage of BF and lower prevalence of type 2 diabetes compared with individuals with a spouse who did not (men=1231 and women=997). Specifically, men with wives who participated in The Maastricht Study (n=326) had higher values of beta cell function indices, higher stepping minutes per day, spent a higher amount of time in LPA and HPA, and a smaller percentage of them were current smokers compared with men with wives who did not (n=1231). Furthermore, women with husbands who participated in The Maastricht Study (n=326) had higher values of C-peptidogenic indext30 and disposition index, had a lower prevalence of hypertension and had less sedentary time compared with women with husbands who did not (n=997). Overall, spouses with complete information (n=172) showed similar study characteristics (online supplemental tables S3 and S4) to those with incomplete information. Men included in the complete case analysis showed a lower prevalence of high alcohol consumption (20.3%) and type 2 diabetes (13.3%) compared with those with incomplete information (32.4% and 24.6%, respectively).
Supplemental material
Online supplemental table S5 shows the adiposity measures, pathophysiological markers, and glucose indicator models adjusted for self-reported physical activity. Compared with estimates from our current analysis, men and women’s models adjusted for MVPA included 8 and 24 more couples, respectively. Estimates from these models showed heterogeneous results. Most of men’s pathophysiological marker models, BMI and women’s glucose indicators showed similar estimates to those adjusted for time in HPA models. Women’s adiposity measures, men’s waist circumference and waist to hip ratio models showed stronger estimates when adjusting for MVPA than models adjusted for time spent in HPA.
Conclusions
This cross-sectional analysis of couples who both participated in the detailed phenotyping of The Maastricht Study showed that spousal concordance was strongest in behavioral risk factors, particularly for DHDI and time spent in HPA. By contrast, the weakest spousal concordance was found in beta cell function indices, which from a biopsychosocial perspective are more downstream determinants of type 2 diabetes.13 Within this multilayer causal cascade framework, pathophysiological mechanisms are regulated by a feedback loop between beta cell secretory response and insulin sensitive organs,32 which are influenced by individuals’ adiposity levels,33 which in turn are influenced by individuals’ diet or physical activity levels. Moving upstream, individuals’ risk factors cluster in families. At this higher level of aggregation, spouse relationships influence health behaviors through psychosocial mechanisms and shared environment.14 Thus, a higher spousal concordance would be expected in upstream risk factors for type 2 diabetes. Indeed, theories behind spousal concordance include the shared resource hypothesis, the social control hypothesis (that leads to convergence in risk behaviors over time) and assortative mating.34 However, it was not possible to explore the potential contribution of these mechanisms at the observed spousal concordance due to lack of relevant information, for example length of marriage, which might have an impact on the spouses’ behaviors and adiposity measurements.
Our results are consistent with previous studies showing a positive association in physical activity levels among spouses,8 9 although these studies captured physical activity levels with self-reported questionnaires. Our study is one of the first to assess spousal concordance in objectively measured physical activity. It provides much stronger evidence that the observed concordance is not driven by a shared degree of over-reporting or under-reporting and demonstrates a much more detailed view of the degree of concordance in two different dimensions of physical activity. As opposed to the study performed by Harada et al,12 in which physical activity and sedentary behavior were measured objectively with accelerometers, we found that spousal concordance in sedentary time was lower than time spent in physical activity.
We identified a stronger influence from wives than from husbands on spouses’ diet; this finding suggests that, within this age group, women play a more important role in procuring household food. A similar degree of concordance for total energy intake and DHDI was observed among women. Our findings are in line with results from previous studies showing spousal concordance in healthier eating patterns10 and total energy intake.11 Our findings also showed a greater influence from husbands than wives on spouses’ BMI levels. Evidence regarding spousal concordance in adiposity measures is heterogeneous. While some studies show higher spousal concordance for BMI than for waist circumference,35 other studies show similar degree of concordance in these two adiposity measures.36 Our study adds to previous knowledge on adiposity measures assessed in spouses using skinfold thickness measurements, a non-invasive, easy and inexpensive procedure to assess body composition to calculate the percentage of BF.
The novelty of this study lies in its investigation of spousal similarities in the pathophysiological mechanisms for the development of type 2 diabetes, which from a causal cascade perspective are the downstream determinants of type 2 diabetes. Previous studies have focused on identifying spousal concordance in fasting glucose levels, hemoglobin A1c as well as in spousal diabetes status.3 4 35 36 We found higher spousal concordance (correlation coefficients) in fasting blood glucose35 but lower in hemoglobin A1c36 than those previously reported. Our findings add to our understanding of the level at which glucose homeostatic mechanisms are similar between spouses and are of direct relevance for disentangling the heterogeneity in the interaction between health behaviors and the downstream etiology of type 2 diabetes. The pathophysiological mechanisms and risk factors driving glucose abnormalities preceding overt diabetes are heterogeneous and varied in their contribution to disease development. For example, isolated impaired fasting glucose assessed with OGTT is characterized by elevated hepatic glucose production, reduced liver and adipose tissue insulin sensitivity, as well as reduced first-phase insulin secretion.32 We found that among women there was a higher spousal concordance in the overall beta cell function (disposition index) compared with the observed concordance in muscle insulin sensitivity (Matsuda Index) or hepatic insulin sensitivity (HOMA2-IR index), whereas among men there was a higher concordance in hepatic insulin sensitivity than in the overall beta cell function and muscle insulin sensitivity. A reason why the distinction between beta cell function and insulin sensitivity is important is that insulin sensitivity responds well and quite quickly to increases in physical activity37 38 and can consequently be hypothesized to have a higher concordance if there is concordance in physical activity. It is also important because these findings reflect a clear path to using spousal concordance to intervene in type 2 diabetes risk. By contrast, beta cell function and an individual’s capacity to compensate the higher need of insulin due to progressive insulin resistance are known to have a stronger (individual) genetic component and are less associated with known lifestyle factors.33 Recent studies have indicated that married couples experience parallel shifts in intestinal microbial communities.39 This novel mechanism could be speculated to provide an association between the shared spousal environment and beta cell function.
The major strength of our study is that we used a highly detailed previously validated set of beta cell function indices that resemble different aspects of beta cell secretory response,22 25 26 providing a comprehensive pathophysiological assessment of early abnormalities in glucose metabolism pathways. Physical activity was measured using accelerometers, a more accurate and reliable physical activity assessment compared with self-reported physical activity. Results from the sensitivity analysis comparing model adjustment using self-reported MVPA are consistent with the lower accuracy of self-report methods for physical activity measurement. Adjustment for self-reported physical activity caused less attenuation of the obesity concordance estimates than adjustment for objectively measured physical activity, indicating that the higher concordance might be the result of a less accurate measurement of physical activity.
The limitations of our study include the limited sample size. The number of couples with available information was reduced due to missing and implausible values in both the outcomes and covariates. As missing information in either member of the couple resulted in exclusion of the couple, the impact of missing values was larger than in studies using individuals as the analysis unit. The cross-sectional design of our study limits our ability to infer causality. Selection forces may have played a role as only a minority of participants in a couple had a spouse who also participated in The Maastricht Study. Indeed, individuals with a spouse who also participated in The Maastricht Study had a healthier metabolic and risk factor profile than individuals with a spouse who did not. For example, individuals in the analytical sample had lower values of glucose metabolism indicators, adiposity measures and a lower prevalence of type 2 diabetes compared with individuals with a spouse who did not participate in The Maastricht Study. However, the selection of metabolically healthier individuals is likely to bias the concordance estimates only if selection resulted in exclusion of discordant couples, which in turn would have resulted in an overestimation of concordance. Furthermore, it is unlikely that the selection process would result in biasing the pattern and broad ranking of estimates of concordance across variables.
In conclusion, this study provides novel insight into the degree of spousal concordance in pathophysiological markers and risk factors leading to type 2 diabetes. Our results showed, with a high level of detail, that spousal concordance was stronger in behavioral risk factors. The degree of concordance weakened moving downstream in the causal cascade leading to type 2 diabetes. From a practical point of view, public health prevention strategies to mitigate diabetes risk might benefit from targeting spousal similarities in health-related behaviors and diabetes risk factors to design innovative couple-based interventions, for example by delivering physical activity prompts during specific time windows when one of the partner is physically active and the other is being simultaneously sedentary.
Acknowledgments
This work was the result of OS-R’s research stay abroad at The Maastricht Study Research Center, Maastricht University Medical Center+, Maastricht, The Netherlands, under supervision of MTS. This research stay abroad was supported by the European Foundation for the Study of Diabetes (EFSD) Albert Renold Travel Fellowship Programme; the Danish Diabetes Association (Diabetesforeningen); and the Graduate School of Health, Aarhus University, Aarhus, Denmark.
References
Supplementary materials
Supplementary Data
This web only file has been produced by the BMJ Publishing Group from an electronic file supplied by the author(s) and has not been edited for content.
Footnotes
DRW and MTS are joint senior authors.
Contributors OS-R, MTS, DRW, AH, CDAS, SB, NHTMD-M, RKS, HB, SE, AK, PD, HHCMS, NCS, and MCJMvD made substantial contributions to the conception and design of the study, acquisition of data, or analysis and interpretation of data. OS-R, MTS, DRW, AH, CDAS, SB, NHTMD-M, RKS, HB, SE, AK, PD, HHCMS, NCS, and MCJMvD drafted the article or revised it critically for important intellectual content. OS-R, MTS, DRW, AH, CDAS, SB, NHTMD-M, RKS, HB, SE, AK, PD, HHCMS, NCS, and MCJMvD approved the version to be published.
Funding The Maastricht Study was supported by the European Regional Development Fund via OP-Zuid, the Province of Limburg, the Dutch Ministry of Economic Affairs (grant 31O.041), Stichting De Weijerhorst (Maastricht, The Netherlands), the Pearl String Initiative Diabetes (Amsterdam, The Netherlands), the Cardiovascular Center (CVC, Maastricht, the Netherlands), CARIM School for Cardiovascular Diseases (Maastricht, The Netherlands), CAPHRI Care and Public Health Research Institute (Maastricht, The Netherlands), NUTRIM School for Nutrition and Translational Research in Metabolism (Maastricht, the Netherlands), Stichting Annadal (Maastricht, The Netherlands), Health Foundation Limburg (Maastricht, The Netherlands), and by unrestricted grants from Janssen-Cilag (Tilburg, The Netherlands), Novo Nordisk Farma (Alphen aan den Rijn, The Netherlands), and Sanofi-Aventis Netherlands (Gouda, The Netherlands). MTS is the guarantor of this work. OS-R is funded by the Danish Diabetes Academy, which is in turn funded by the Novo Nordisk Foundation. OS-R, AH and DRW received support provided by the Steno Diabetes Center Aarhus (SDCA), which is partially funded by an unrestricted donation from the Novo Nordisk Foundation. OS-R received travel grant support from the EFSD Albert Renold Travel Fellowship Programme; the Danish Diabetes Association (Diabetesforeningen); and the Graduate School of Health, Aarhus University, Denmark, to carry out a 10-week research stay abroad at the Maastricht Study Research Center, Maastricht University Medical Center+, Maastricht, The Netherlands.
Competing interests None declared.
Patient consent for publication Not required.
Ethics approval The study has been approved by the institutional medical ethical committee (NL31329.068.10) and the Ministry of Health, Welfare and Sports of the Netherlands (permit 131088-105234-PG).
Provenance and peer review Not commissioned; externally peer reviewed.
Data availability statement Data are available upon reasonable request.
Supplemental material This content has been supplied by the author(s). It has not been vetted by BMJ Publishing Group Limited (BMJ) and may not have been peer-reviewed. Any opinions or recommendations discussed are solely those of the author(s) and are not endorsed by BMJ. BMJ disclaims all liability and responsibility arising from any reliance placed on the content. Where the content includes any translated material, BMJ does not warrant the accuracy and reliability of the translations (including but not limited to local regulations, clinical guidelines, terminology, drug names and drug dosages), and is not responsible for any error and/or omissions arising from translation and adaptation or otherwise.